

Abstract
Clinical trials for preventative therapies are complex and costly endeavors focused on individuals likely to develop disease in a short time frame, randomizing them to treatment groups, and following them over time. In such trials, statistical power is governed by the rate of disease events in each group and cost is determined by randomization, treatment, and follow-up. Strategies that increase the rate of disease events by enrolling individuals with high risk of disease can significantly reduce study size, duration, and cost. Comprehensive study of common, complex diseases has resulted in a growing list of robustly associated genetic markers. Here, we evaluate the utility—in terms of trial size, duration, and cost—of enriching prevention trial samples by combining clinical information with genetic risk scores to identify individuals at greater risk of disease. We also describe a framework for utilizing genetic risk scores in these trials and evaluating the associated cost and time savings. With type 1 diabetes (T1D), type 2 diabetes (T2D), myocardial infarction (MI), and advanced age-related macular degeneration (AMD) as examples, we illustrate the potential and limitations of using genetic data for prevention trial design. We illustrate settings where incorporating genetic information could reduce trial cost or duration considerably, as well as settings where potential savings are negligible. Results are strongly dependent on the genetic architecture of the disease, but we also show that these benefits should increase as the list of robustly associated markers for each disease grows and as large samples of genotyped individuals become available.
Introduction
Designing a randomized clinical trial for disease prevention is a complex and costly endeavor.1 A key step is to identify individuals likely to develop the disease during the study. The cost of a prevention trial strongly depends on the rate of disease onset among participants: low rates of disease onset require large sample sizes or long trial duration to achieve adequate statistical power. Most primary prevention trials thus apply “enrichment” strategies to recruit individuals at high risk of disease onset.2–4 Such trial design strategies also have ethical benefits because only at-risk subjects are exposed to potential side effects of a novel intervention. Enrichment designs can also be used in other types of clinical trials (see Simon5 for examples).
Now genetic markers have been robustly associated with many complex diseases; it is timely to explore how genetic information, in conjunction with clinical information, can be used in the design of prevention trials.6 This question can be decomposed into two more specific questions: first, how can we accurately predict disease risk from genetic data; and second, how can we use predicted genetic risks to design more efficient prevention trials? The question of predicting genetic risk of complex diseases has recently been explored in various contexts.7–9
Initial attempts to utilize genetic information in trial design proposed using a small number of risk genotypes as discrete inclusion criteria. Examples include using BRCA1 (MIM 113705) and BRCA2 (MIM 600185) genotypes in breast-cancer-prevention trials. Here, we explore an extension of this concept that can incorporate hundreds or thousands of robustly associated genetic markers, via a quantitative “genetic risk score” aggregated across markers.10 The cost and duration of a prevention trial will depend on the prediction accuracy of the risk score and the threshold used to select eligible subjects.
To evaluate the benefits and limitations of using genetic risk-prediction models, we compare the cost and duration of prevention trials in various scenarios, including trials using only clinical information and trials also using genetic information to identify high-risk subjects. To illustrate the issues, we consider current risk-prediction models for four diseases: type 1 diabetes (T1D [MIM 222100]), type 2 diabetes (T2D [MIM 125853]), myocardial infarction (MI [MIM 608446]), and age-related macular degeneration (AMD [MIM 603075]). Through simulation, we show that aggregate risk scores are expected to help reduce cost of clinical trials, sometimes modestly (T2D, MI) and sometimes substantially (T1D, AMD). Reanalyzing existing experimental data, we further evaluate our model in the context of T2D and AMD. Finally, we evaluate the utility of biobanks where a large number of already genotyped individuals could make enrichment based on genetic information particularly cost effective.
Material and Methods
Framework of Genetic Enrichment Trial for Disease Prevention
We consider a standard design framework for prevention trials as “conventional prevention trials.” Eligibility criteria are assessed in potential trial participants after they provide informed consent. Typically, this involves selecting individuals likely to develop the disease based on clinical risk factors, such as glucose levels for T2D3 and low-density lipoprotein (LDL) or C-reactive protein (CRP) levels for MI.4,11 Additional risk variables such as age, gender, or smoking history may also be incorporated into the criteria (Table 1). Eligible participants are randomized to different treatment arms and followed for a trial period as illustrated in Figure 1A. The treatment effect will be evaluated by comparing the frequency of disease onset between arms. The inclusion criteria capitalize on prognostic factors that “enrich” disease onset among the trial subjects. Studying these individuals increases the number of disease-onset events and thus reduces the sample size and the trial cost.
Table 1.
A Summary of Genetic and Treatment Information for Four Disease Traits
| Disease Trait | T2D | AMD | T1D | MI |
|---|---|---|---|---|
| Current Genetic Knowledge | ||||
| Population prevalence | 3.0%12 | 11.8%a,13 | 0.54%14 | 4.0%15 |
| Sibling recurrence risk | 3.516 | 2.217 | 13.714 | 3.215 |
| Heritability in liability scaleb | 0.60 | 0.68 | 0.86 | 0.71 |
| No. known risk variants | 2918 | 719 | 4120 | 1221 |
| Range of odds ratios per allele | 1.06–1.37 | 1.31–4.31 | 1.05–5.49 | 1.13–1.28 |
| Heritability explained by known genetic risk variants | 3%–9% | 46%–59% | 18%–29% | 1%–5% |
| Example Prevention Trial | ||||
| Treatment effect | thiazoli-dinedione22 | zinc + antioxidants23 | oral insulin24 | statin4 |
| Inclusion criteriac | IGT/IFG | ≥3 baseline AMD grade | NAc | NAc |
| Average annual rate of disease onset in control arm (conventional trial) | 8.7% | 4.4% | 2.1% | 2.5% |
| Average annual rate of disease onset in treatment arm (conventional trial) | 3.9% | 3.2% | 1.0% | 1.5% |
| Trial duration | 3 years | 5 years | 4 years | 5 years |
| Clinical screening costd | $1,500 | $1,500 | $1,500 | $1,500 |
| Additional per-subject cost for genetic screening | $100 | $100 | $100 | $100 |
| Trial cost per year per subject | $6,000 | $3,500 | $12,000 | $6,000 |
AMD prevalence from individuals with age 80 years or older.
Heritability is estimated from prevalence and sibling recurrence risk.13
Inclusion criteria are applied only in the experimental data setting for T2D and AMD, not in the simulation-based studies.
Screening and trial costs are assumed to take failure rate into account.
Figure 1.
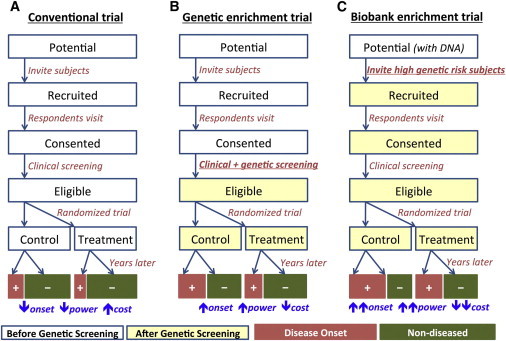
Frameworks of Conventional and Genetically Enriched Prevention Trials
(A) Conventional prevention trial not utilizing genetic information.
(B) Standard genetic enrichment trial following up only individuals at high genetic risk after genetic screening.
(C) Biobank-based enrichment trial where DNA information is available a priori and used for inviting individuals at the beginning of trial.
In genetic enrichment trials, the inclusion criteria further incorporate genetic information in a quantitative manner (Figure 1B). In such trials, a larger number of potential participants are screened to obtain a small fraction of individuals at higher risk of disease. Consequently, the targeted participants will be at higher risk than those in conventional trials, and they will also be more likely to develop the disease during the trial period.
Examining the trade-off between resources used in the screening stage and the trial stage is essential to optimize the efficiency of the trial. If the eligible criteria are too stringent, the number of potential participants to recruit and screen will be orders of magnitude larger than that of conventional trials, and the associated costs of screening will become a substantial portion of the total trial cost. On the other hand, too-liberal criteria will fail to enrich the disease onset among the trial participants, diminishing the benefits of genetic screening.
Another type of possible enrichment trial builds upon a pool of potential participants with genetic information readily available. Several large-scale DNA biobanks are currently being established with sample sizes up to hundreds of thousands patients25 with consent for genetic prescreening. Individuals found to be at high risk based on genetic risk factors determined from their banked genetic information would be prioritized for recruitment. Given a sufficiently large number of samples in the DNA biobank, this strategy makes it possible to identify an extremely small fraction of individuals at much higher risk than others without additional screening cost (Figure 1C).
Genetic Risk Model from Known Genetic Risk Variants
We consider a model of individual genetic risk based on markers known to be associated with disease traits with genome-wide significance. Typically an individual genetic risk score is calculated as a weighted sum of risk alleles26
where xi is 0, 1, or 2 copies of ith risk alleles and ORi denotes the odds ratio of ith risk allele estimated from previous data. When there were multiple published risk variants in a locus, our analysis used only variants for which pairwise r2 < 0.10. This helps ensure independence between risk allele effects; a refined model allowing for multiple correlated variants per locus may outperform the approach used here. Assuming that the risk variant effects are the same in published genetic studies and clinical trial populations, the rate of disease onset in the prevention trial participants can be modeled as a logistic function of γ(x). Thus,
| (1) |
where d denotes disease-onset event during the trial period (e.g., 3 years for our simulated T2D trial and 5 years for our simulated AMD trial), z is the binary indicator of randomization of treatment assignment, and treatment effect size of δ and intercept term μ are constants selected to ensure the desired rates of disease onset in the control and treatment arms prior to genetic enrichment. We solved μ and δ numerically by using Brent’s root-finding algorithm. The receiver operating characteristics (ROC) of this genetic risk score can be obtained given the risk allele frequency and disease prevalence. All numerical estimations were based on simulated genotypes of millions of individuals as described in the next section.
Simulation of Genetic Risk Scores
We evaluated the performance of genetic enrichment trial designs by using simulated genetic and phenotype data for four diseases. To simulate the genetic risk score by using known genetic risk variants, we simulated genotypes for a million trial-eligible individuals based on risk allele frequencies reported from published results. For each simulated individual, we generated a genetic risk score by using the published effect size of each risk variant and the simulated genotypes. On the basis of the distribution of genetic risk scores, we estimated the intercept and treatment effect parameters to ensure that incidence in the treatment and placebo arms would match the effects in Table 1. The likelihoods of the individual having disease were evaluated by Equation 1. To account for the uncertainty in published odds ratios, we sampled odds ratios from lognormal distribution defined according to published odds ratios and confidence intervals and then repeated the simulation procedure with 100 different sets of sampled risk scores. The “very optimistic” and “very pessimistic” estimates of ROC in Figure S1 (available online) use the upper and lower bound of 95% confidence intervals of odds ratio for each of the risk variants, respectively.
Risk Model from Known AUC Values
More generally, individual disease risk can be estimated from genetic and clinical information independently or collectively. In particular, we consider combined genetic and clinical risk from cohort studies of AMD and T2D.23,27 In these studies, an alternative measurement—the area under the ROC curve (AUC)28—is reported. Assuming that summed risk scores are approximately normally distributed, we estimated the variance of genetic risk scores and effect size of treatment from AUC value, population prevalence, and rate of disease onset in the control and treatment arms (see the section “Details on Parameter Estimation Based on AUC” for further details).
In the analysis of empirical data in AMD, the published AUC values were adjusted for inclusion criteria of baseline grade 3 or greater via the following equation:
where AUCorg and AUCadj denote original and adjusted AUC values, respectively, and f2 is the proportion of individuals with baseline grade 2 or less. We have assumed that no individual with grade 2 developed the disease during the trial period, which is a reasonable approximation given that only 8 out of 454 (2%) individuals with baseline grade 2 developed advanced AMD throughout the trial. For the analysis of T2D empirical data, the AUCs were calculated with the real data. We also assumed that the effect from clinical and genetic variables remains constant over the trial period.
In addition to the analysis of empirical data, AUC-based methods were also used in two hypothetical simulation settings where 25% and 50% of the known heritability in liability scale13 could be explained by known genetic variants. This can prospectively project the degree of enrichment through the use of genetic factors that will be discovered in the future.
Estimation of Sample Size, Trial Cost, and Trial Duration
Given a threshold t for the genetic risk score, the expected fraction of individuals with disease-onset events during the trial can be modeled as
where πC(t) and πT(t) are the rates of disease onset in the control and treatment arms, respectively. Prior to enrichment, these estimates correspond to the section “Example Prevention Trial” in Table 1. Given a false positive rate α (=0.05) and power 1 − β (=0.8), the required per-treatment group sample size follows29
Given per-sample clinical screening cost Cs, follow-up cost Cf, and proportion of eligible participants fe, the cost of a conventional prevention trial is determined as
where n0 represents sample size of conventional trial (see Figure 1A).
For a genetic enrichment trial (see Figure 1B) with additional cost Cg, for genetic screening cost Cg, if we assume that clinical and genetic screening is performed simultaneously with clinical screening, the overall cost becomes
We can estimate the reduction in the required duration of a trial with a fixed sample size and desired power by first estimating the number of cases accrued in a trial of fixed length and then using the simplifying assumption that the number of new cases in each trial arm is proportional to trial length (ignoring the competing effects of increased progression as participants age and of decreased incidence as cases become saturated). For the short trials examined here, the assumption is reasonable.
Details on Parameter Estimation Based on AUC
Assume that the risk score γ(x) ∼ N(0,σ2) and the treatment effect size is δ. The rate of disease onset is given by
which is identical to Equation 1. The objective is to estimate μ, σ2, and δ from known parameters. We use reported AUC values and prevalence to estimate σ2 and use incidence rate in the treatment and control arms to estimate μ and δ.
More specifically, assuming δ = 0, we estimate μ and σ2 from reported AUC values and the disease prevalence (E[d|z = 0]) of the population that the AUC is calculated from. We simulated a million random samples from the model and numerically solved μ and σ2 by using Brent’s root-finding algorithm given E[d|z = 0] and AUC values. Between the trial population and the population where the AUC is calculated from, we assumed that σ2 is identical. However, because μ can often be different between the two populations, we re-estimated μ and δ among the trial subjects by using the reported incidence rate E[d|z = 0] and E[d|z = 1], again by using Brent’s algorithm.
Results
We consider the three types of randomized two-arm primary prevention trials illustrated in Figure 1: (1) conventional prevention trials that screen potential participants via eligibility criteria based on a set of clinical variables, (2) genetic enrichment prevention trials that screen participants via clinical variables and genetic risk factors, and (3) biobank enrichment prevention trials that identify potential participants with high genetic risk scores prior to clinical screening. We first evaluate the benefits of using genetic information via simulations, and we later use empirical data from previous studies, such as the Age-Related Eye Disease (AREDS)23 and Whitehall II27 studies, to account for potential overlap between clinical and genetic risk factors.
Effects of Known Risk Variants on Disease Liability
We first evaluated the potential ability of GWAS variants to identify at-risk individuals by using simulations. We considered risk variants identified by large-scale meta-analyses for T1D,20 T2D,18 MI,21 and AMD19 as robust genetic associations (see Table 1). Using published risk allele frequencies and effect sizes, we simulated individual genetic risk scores by assuming the log-additive odds model in Equation 1. Figure 2 illustrates the distribution of the genetic risk score for individuals with and without disease for each trait. The distributions of the genetic risk scores in individuals with and without disease are very similar for T2D and MI but quite different for AMD and T1D, where a number of loci with large effect sizes have been described. These genetic risk profiles depend on current knowledge of the genetic architecture of each disease and can also be summarized as receiver operating characteristics (ROC) curves that describe our ability to distinguish individuals with and without disease by using genotypes. In addition to predictions based on published effect size estimates, ROCs summarized in Figure S1 also include predictions that account for uncertainty in published effect sizes.
Figure 2.
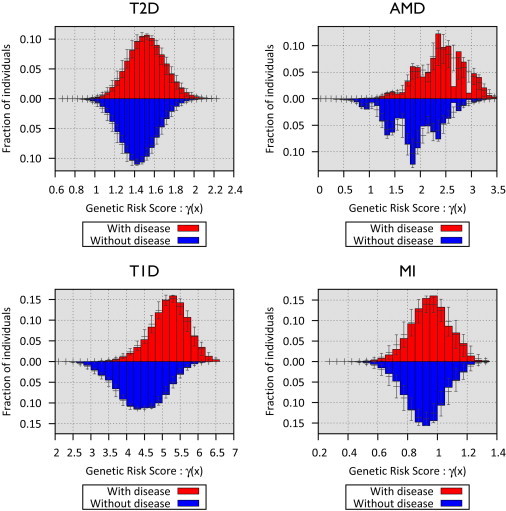
Distribution of Genetic Risk Scores from Currently Known Risk Variants for Four Disease Traits
The x axis represent the genetic risk score with respect to the individuals with the lowest risk genotypes. The y axis represents the fraction of individuals with disease based on their risk score. The 95% confidence intervals account for variations in the odds ratio estimates.
We next used simulations to predict the relative prevalence of disease in individuals with high and low genetic risk scores (Table 2). For AMD and T1D, we estimate that selecting individuals with genetic risks in the top decile would result in a ∼3- to 5-fold increase in disease prevalence. Selecting individuals with genetic risks in the top percentile would result in a ∼5- to 12-fold increase in prevalence. For T2D and MI, ∼1.5- to 2-fold increases in disease prevalence were expected among individuals within the top decile, whereas ∼2- to 3-fold increases in risk were expected among individuals with risks in the top percentile of genetic risk.
Table 2.
Disease Liability Explained by Currently Known Risk Variants
| Genetic Risk Threshold |
Fold Enrichment from Baseline Disease Prevalence (in Parentheses)a |
|||
|---|---|---|---|---|
| T2D (3.0%) | AMD (11.8%) | T1D (0.54%) | MI (4.0%) | |
| Top 50% genetic risk | 1.32 | 1.65 | 1.84 | 1.23 |
| Top 20% genetic risk | 1.67 | 2.63 | 3.42 | 1.43 |
| Top 10% genetic risk | 1.92 | 3.36 | 4.96 | 1.57 |
| Top 5% genetic risk | 2.17 | 4.07 | 6.82 | 1.69 |
| Top 2% genetic risk | 2.50 | 4.63 | 9.78 | 1.83 |
| Top 1% genetic risk | 2.74 | 4.81 | 12.42 | 1.94 |
The ratio of prevalence in the individuals with top genetic risk to the baseline prevalence in Table 1.
Utility of Known Risk Variants in Efficient Design of Prevention Trials
Next, we estimated the utility of genetic risk scores for trial design. We considered prevention trials for T1D, T2D, MI, and AMD. In each case, we modeled treatment effect, trial cost, and duration guided by previous studies (Table 1). These simulations made two important simplifying assumptions. First, because the largest genetic association studies for these traits used case-control analysis to estimate the impact of individual risk alleles on prevalence (rather than incidence within a period of time), we assumed that the impact of genetic variants on hazard-ratios (as estimated in a case-control study) and on disease incidence rates during trial follow-up are the same. Second, because there is little data on how genetic and clinical predictors interact to predict disease risk, our models assume that genetic effects are the same in the subjects who meet the trial’s eligibility criteria. To the extent that clinical variables mediate the impact of genetic variants on disease risk, this assumption will lead to optimistic predictions of performance for trials that use both genetic and clinical covariates for enrichment. Further, it could mean that although we can evaluate the potential value of genetic enrichment trials, we are not well positioned to explore whether these trials will be more cost effective than trials focused on individuals whose clinical profiles indicate very high risk for disease. Our analysis of prospective data generated by the AREDS (on AMD)23 and Whitehall II (on T2D)27 studies overcomes these limitations.
In our simulations, as individuals with higher risk were targeted, the incidence of disease gradually increased in both treatment arms, whereas the treatment effect size only slightly increased (Figure S2). This increase in the disease incidence translates into reduced sample size requirements (Figure 3). At the same time, large increases in on-trial disease incidence require progressively larger samples to be screened for clinical and genetic risk factors, increasing screening costs. The optimal trial cost is determined by balancing these two trade-offs. As shown in Table 3 and Figure 3, our simulation suggests that cost savings up to 11% for T2D, 40% for AMD, 67% for T1D, and 13% for MI are possible when genetic enrichment is used to complement clinical risk factors. For a fixed sample size, genetic enrichment can reduce trial duration by ∼24% for T2D and MI and by 40%–62% for AMD and T1D.
Figure 3.
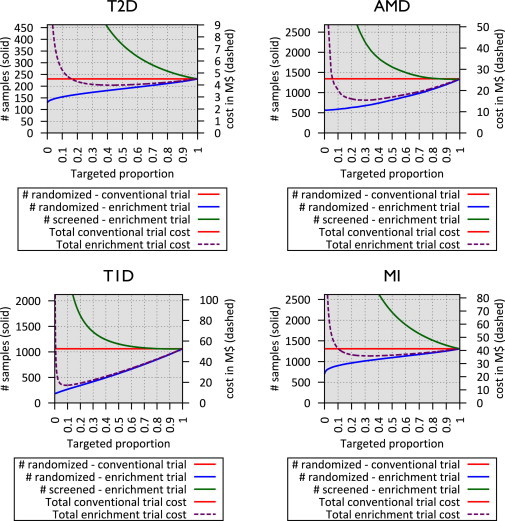
Sample Size and Total Cost of Genetically Enriched Prevention Trials Using Currently Known Risk Variants
x axis represents the targeted proportion of individuals at high genetic risk, and the left y axis, corresponding to solid lines, represents sample size for a conventional trial (red), on-trial sample size for a genetic enrichment trial (blue), and screening sample size for a genetic enrichment trial (green). The right y axis, corresponding to dashed lines, represents the total cost of the genetic enrichment trial given targeted proportion.
Table 3.
Sample Size, Cost, and Trial Duration of Enrichment Trials, Simulated from Published GWAS Risk Variants
| Disease Trait | Trial Design |
Optimized Trial Cost (Fixed Trial Duration) |
Reduced Trial Duration (Fixed No. Subjects) |
||||||
|---|---|---|---|---|---|---|---|---|---|
| %Targeted Subjects | Trial No. Subjects | Trial Duration | Total Cost ($) | %Targeted Subjects | Trial No. Subjects | Trial Duration | Total Cost ($) | ||
| T2D | conventional trial | 100% | 231 | 3.0 years | 4.5M | 100% | 231 | 3.0 years | 4.5M |
| T2D | genetic enrichment triala | 43% | 184 | 3.0 years | 4.0M | 20% | 231 | 2.3 years | 5.1M |
| T2D | biobank enrichment trialb | 1% | 136 | 3.0 years | 2.7M | 1% | 231 | 2.1 years | 3.3M |
| AMD | conventional trial | 100% | 1,342 | 5.0 years | 25.5M | 100% | 1,342 | 5.0 years | 25.5M |
| AMD | genetic enrichment trial | 31% | 680 | 5.0 years | 15.4M | 20% | 1,342 | 3.0 years | 24.7M |
| AMD | biobank enrichment trial | 1% | 565 | 5.0 years | 10.7M | 1% | 1,342 | 3.0 years | 16.1M |
| T1D | conventional trial | 100% | 1,061 | 4.0 years | 52.5M | 100% | 1,061 | 4.0 years | 52.5M |
| T1D | genetic enrichment trial | 9% | 260 | 4.0 years | 17.1M | 20% | 1,061 | 1.5 years | 27.4M |
| T1D | biobank enrichment trial | 1% | 190 | 4.0 years | 9.4M | 1% | 1,061 | 1.1 years | 16.1M |
| MI | conventional trial | 100% | 1,309 | 5.0 years | 41.2M | 100% | 1,309 | 5.0 years | 41.2M |
| MI | genetic enrichment trial | 34% | 1,032 | 5.0 years | 35.8M | 20% | 1,309 | 3.8 years | 40.6M |
| MI | biobank enrichment trial | 1% | 771 | 5.0 years | 24.3M | 1% | 1,309 | 3.2 years | 26.9M |
In genetic enrichment trials, the cost-optimizing fraction of targeted samples subjects is selected for determining reduced trial cost, and 20% of targeted samples subjects is selected for determining reduced trial duration.
In biobank-based enrichment, 1% of targeted samples subjects is assumed to determine trial cost and sample size reduction.
Evaluation with Experimental Data
To complement these simulations, we applied our enrichment trial framework to longitudinal data sets documenting incidence of two specific diseases—AMD and T2D—as well as clinical and genetic risk factors. This evaluation removes the simplifying assumptions required in our simulations.
Because both clinical and genetic risk scores are available in this empirical setting, to precisely evaluate the additional benefits of genetic information, here we consider (1) conventional prevention trials following up all participants meeting eligibility criteria, (2) clinically enriched prevention trials focusing on individuals with high clinical risk scores based on clinical, demographic, and environmental variables, on top of the eligibility criteria, and (3) genetically and clinically enriched prevention trials focusing on individuals with high combined risk scores, incorporating both genetic and clinical risks.
Age-Related Macular Degeneration
A published cohort study of 1,446 individuals at high risk of advanced AMD allowed us to investigate our framework for this setting.23 Participants were assayed for known genetic risk variants in addition to clinical risk variables—age, gender, education, smoking history, and baseline AMD grade. In total, 19% (279) of the subjects developed advanced AMD (including unilateral and bilateral and dry and wet types of advanced AMD) within 6.3 years of entering the study. The advantage of combining clinical and genetic risk compared to clinical risk only is reflected in area under the ROC curve (AUC)30 statistics. A predictive model based on clinical risk variables alone resulted in AUC statistic of 0.757, whereas a predictive model using combined genetic and clinical variables resulted in an AUC statistic of 0.821. Among all risk variables considered, the baseline AMD grade was the strongest predictor of advanced AMD. Among the 454 individuals with a low baseline AMD grade of 2, only 8 (2%) of them developed advanced AMD during the trial period; in contrast, among 992 individuals with a high baseline AMD grade of ≥3 (defined as AREDS category), 271 (27%) developed advanced AMD during the trial period. To mimic a realistic scenario for an AMD prevention trial from the cohort study, we considered a prevention trial with baseline grade ≥3 as inclusion criteria. We estimate that in this subset of individuals, the AUC would be 0.637 if we used only clinical predictors and 0.743 with genetic and clinical predictors.
Based on these adjusted AUCs and the reported rate of disease onset for each of the treatment groups,17 we estimated the sample size requirements, trial cost, and duration for evaluating the efficacy of zinc + antioxidant treatment (Table 4). Our results show that, compared to a conventional prevention trial relying only on baseline AMD grade ≥3 as the inclusion criterion, enrichment based on clinical risk scores from the demographic and environmental risk variables could either reduce trial cost by up to 15% by reducing sample size requirements by 24% or reduce the trial duration by 24% at a fixed sample size. Enrichment with both clinical and genetic factors can reduce trial cost by up to 33%, either by reducing sample size requirements by 44% or by reducing trial duration by 36%—either option corresponds to substantial efficiency gains beyond enrichment with only clinical characteristics.
Table 4.
Sample Size, Cost, and Trial Duration of Enrichment Trials Based on Experimental Results23,27
| Disease Trait | Trial Design |
Optimized Trial Cost (Fixed Trial Duration) |
Reduced Trial Durationa(Fixed No. Subjects) |
||||||
|---|---|---|---|---|---|---|---|---|---|
| %Targeted Subjects | Trial No. Subjects | Trial Duration | Total Cost ($) | %Targeted Subjects | Trial No. Subjects | Trial Duration | Total Cost ($) | ||
| T2D | conventional trialb | 100% | 231 | 3.0 years | 4.51M | 100% | 231 | 3.0 years | 4.51M |
| T2D | clinical-only enrichment trialc | 29% | 124 | 3.0 years | 2.92M | 20% | 231 | 1.9 years | 3.95M |
| T2D | combined (clinical+genetic) enrichment triald | 28% | 120 | 3.0 years | 2.84M | 20% | 231 | 1.9 years | 3.93M |
| AMD | conventional trialb | 100% | 1,342 | 5.0 years | 25.5M | 100% | 1,342 | 5.0 years | 25.5M |
| AMD | clinical-only enrichment trialc | 41% | 1,018 | 5.0 years | 21.8M | 20% | 1,342 | 3.8 years | 28.5M |
| AMD | combined (clinical+genetic) enrichment triald | 30% | 753 | 5.0 years | 17.2M | 20% | 1,342 | 3.2 years | 25.7M |
Cost-optimizing fraction of targeted samples subjects are selected for determining reduced trial cost, and 20% of targeted subjects are selected for determining reduced trial duration.
In combined enrichment trial, we combine the clinical and genetic information and use this combined risk in the trial design.
Conventional trial uses only basic inclusion criteria—IFG or IGT status for T2D and baseline AMD grade ≥3.
In clinical-only enrichment trial, the clinical risk is calculated with a multitude of clinical factors including demographic and environmental factors.
Whereas simulation using GWAS-based effect size estimates, under the assumption that there is no interaction between clinical and genetic risk factors, suggested a potential 40% savings in prevention trial cost, this empirical analysis suggests a savings of ∼33% in prevention trial cost when combining genetic and clinical variables as risk predictors. In this case, both estimates are similar—suggesting that the assumptions above do not qualitatively affect the conclusions of our simulation-based analysis.
Type 2 Diabetes
To empirically evaluate the efficiency of T2D prevention trials, we used data from the Whitehall II prospective cohort study. This longitudinal study recruited a cohort of civil servants, 25 to 55 years old in central London, from 1985 to 1988 and followed them until 2003–2004. The detailed design and data analysis were reported previously.27 Among 5,535 participants, we selected 1,916 prediabetic subjects with either impaired glucose tolerance (IGT) (7.8–11.0 mmol/dl) or impaired fasting glucose (IFG) level (5.6–6.9 mmol/dl) in the initial phase or clinical examination to resemble subjects typically recruited in a type 2 diabetes prevention trial.3
Using the Framingham offspring T2D risk scores calculated only from clinical variables,31 genetic risk scores calculated from 20 robustly associated variants,18 and risk scores calculated from both clinical and genetic factors, we evaluated different strategies for trial enrichment. Consistent with the previous study,27 we find that the genetic risk scores alone do not effectively predict onset of T2D in this cohort (AUC: 0.52). The Framingham T2D risk scores from clinical variables (AUC: 0.75) or combined risk scores (AUC: 0.76) were much more informative in predicting progression of diabetes among at-risk individuals.
In this case, we estimate that clinical risk-score-based enrichment trials using Framingham T2D risk scores can reduce the trial cost by 35%, the sample size by 46%, or the trial duration by 37% (compared to conventional trials using only IFG/IGT status as eligibility criteria). We also estimate that, in this case, using combined risk scores that also include genetic information would result in negligible additional benefits (Table 4). This finding reflects our limited knowledge of the genetic variants contributing to T2D risk (mirrored in their low AUC contribution) and is much more pessimistic than the estimate of an ∼11% cost saving from our simulations.
Biobank-Driven Prevention Trial Designs
We also simulated biobank-driven enrichment trials, which rely on a very large set of individuals for whom genetic information is stored in a DNA biobank and who have consented to being invited to participate in clinical trials. Given planned biobanking efforts targeting >100,000 individuals, this approach may allow identification of individuals with very rare and very high-risk genotypes for modest (incremental) screening cost. We estimated the sample size, trial cost, and possible reduction in trial duration when biobanks that were 100× larger than the planned on-trial sample sizes. In this case, individuals in the top percentile of genetic risk might be targeted (Table 3) and, except for very simple predictors like age, traditional clinical risk factors would be ignored.
We estimate that such biobank-driven enrichment strategies might reduce the trial cost by 41% for T2D, 58% for AMD, 82% for T1D, and 41% for MI, when combined with screening for clinical risk factors. These estimates correspond to 20% to 37% in cost savings beyond those available in standard genetic enrichment trials.
Prospect of Improved Genetic Risk Prediction
To assess the impact of future improvements in genetic risk predictions, we simulated enrichment prevention trials by using hypothetical sets of risk variants that might explain 25% or 50% of the heritability13 for the four disease traits (Table S1). In these simulations, the genetic enrichment prevention trials of T2D and MI are estimated to achieve cost and trial size savings similar to those available for AMD and T1D. These results suggest that more complete catalogs of disease risk alleles may substantially increase the potential utility of genetic information for trial enrichment.
Discussion
With rapid advances in high-throughput biological screening strategies, there is great hope that genetic information will enable the design of more efficient clinical trials and that further gains in efficiency may be provided by other genomic predictors of disease (such as transcript levels, epigenomic modifications, and proteomic profiles). Here, we evaluated the potential benefits of using genetic information for designing prevention trials and derive a framework for estimating the potential cost savings when genetic information is used to identify at-risk individuals for inclusion in a trial.
Our results demonstrate that focusing on individuals with high genetic risk may allow for reduced trial cost and duration. Currently, benefits from genetic enrichment trials are likely to be limited to diseases such as AMD or T1D, where variants accounting for a large fraction of the heritability have been identified. However, future advances in genetic knowledge (driven by sequencing studies and other studies of rare variation, for example) should extend the utility of genetic enrichment trials to broader sets of complex diseases, including conditions for which genetic enrichment is currently unlikely to succeed, such as T2D or MI.
It is important to note that the incremental value of genetic information is dependent on the clinical variables available and the populations and timescale of interest. Recent studies on the AMD risk assessment from AREDs subjects suggest that the improvement in AUC resulting from genetic factors can be considerably lower when additional clinical and demographic variables such as the presence of large drusen, advanced AMD in one eye, and family history are considered.32,33 When these additional covariates were included, overall AUC was considerably increased, from 0.73 to 0.87, and addition of genetic factors only marginally increased the AUC from 0.87 to 0.88. Most importantly, adjusting for the clinical variables, the estimated hazard ratio for CFH and ARMS2 alleles was substantially reduced from 1.97 to 1.28 and from 2.21 to 1.56, respectively. Therefore, in the AMD prevention trials utilizing these additional clinical variables described above, the benefit of genetic information might be marginal. This suggests that—for AMD—much of the genetic risk may be mediated by these strong clinical predictors, and when these clinical predictors are included in models of short-term risk, there is limited additional predictive value in including genetic risk factors. In practice, it will be very useful to prospectively evaluate the risk models including both genetic and environmental risk factors in appropriate samples—a practice that is, unfortunately, not yet common.
Our observation that very large gains in efficiency are possible when DNA biobanks with genetic information on hundreds of thousands of potential trial participants is available is particularly interesting. In this setting, trials can focus on individuals who carry very rare combinations of many risk alleles. For example, by focusing on individuals in the top 1% of the genetic risk of T1D, T2D, AMD, or MI, we predict cost savings of 82%, 40%, 58%, and 41%. If basic clinical information is also stored in the biobank, the potential efficiency gains will be even larger.
Our cost models assume a fixed cost of screening and treatment. They do not allow for cost savings that may be possible in very large screening efforts; or, conversely, for cost increases that might result from the necessity of extending screening to additional sites. They also assume that genetic risk factors do not impact treatment efficiency—although that may not always be the case. Interestingly, we note that the ratio of screening, genotyping, and on-trial costs has a noticeable impact on the potential benefits of genetic information for trial design. Because genetic information potentially allows for smaller numbers of on-trial individuals, its benefits are particularly important when the on-trial costs are large. For our hypothetical AMD enrichment trials, an increase in on-trial cost per subject from $3,500 to $20,000 would mean that an enrichment strategy combining genetic and clinical variables could enable a savings of ∼42% in cost (instead of a ∼33% savings when the on-trial costs are lower). As noted above, this savings will also be dependent on the precise clinical variables available for study and the incremental predictive power of genetic information over these variables.
Our simulations required important assumptions—particularly, the assumption that clinical and genetic risk factors do not interact with each other. For T2D and AMD, we were able to overcome this limitation by extending our analysis to also consider empirical samples that included information on disease incidence as well as clinical and genetic risk factors. Although similar empirical assessments remain to be done for MI and T1D, we predict that the outcome for MI will be similar to that for T2D (where we conclude that currently available genetic markers will typically have limited utility), and we expect the situation for T1D might be more similar to that for AMD (where currently available genetic markers can already enable large cost savings). Future improvements in modeling will benefit from estimates of the performance of combined genetic and clinical risk scores in prospective studies.
By default, we assumed a multiplicative (or log-additive) model for risk across loci. If an additive model were assumed instead,34 the benefits from selecting individuals with many risk alleles would be much smaller. Very large prospective population screens are lacking, so this is an assumption that needs validation. Limited reassurance is available for some traits, such as macular degeneration, where log-additive and additive models lead to different risk predictions (AUC of >0.75 and ∼0.57, respectively) and published empirical data agrees well with the log-additive model predictions. For other traits, this is an issue that deserves further empirical study. We note that genotype-based enrollment (as with other trial enrichment strategies) could limit the generalizability of trial results. In these cases, demonstration of a benefit for genetically at-risk individuals could be followed by a larger study evaluating more general use of the treatment.
Here, we focused on evaluating the utility of genetic information for enriching prevention trials. However, we expect that the combination of genetic information and clinical trials will be a fertile area of research—including not just advances in trial design but also opportunities to use genetic variants to understand the biology of drug response and adverse events. In cases where screening for clinical risk factors is laborious and expensive, genetic risk scores may be used as a filter that focuses the clinical screening on at-risk individuals (an example might be antibody test response screening used to identify individuals at risk of developing T1D35). Finally, for common diseases where the genetic architecture is poorly understood, a proxy for a high genetic risk score might be the presence of an affected first-degree relative, such as a parent or sibling.
It should be noted that genetically enriched trials typically limit the application of treatment only to those with high genetic risk, because it is possible that the beneficial effects are specific to the genetically enriched subjects (see Web Resources). However, once beneficial effects are shown in an enriched trial, it could motivate a large study to evaluate the possibility for more general use of the treatment.
Our model allows estimation of trial cost and duration in a variety of enrichment scenarios, including eligibility criteria based on clinical factors, genetic factors, or their combination. Although we haven’t investigated multi-arm trial designs, our work can model the utility of biobank-driven enrichment (where genetic information may be available for hundreds of thousands of individuals) or of advances in genetic information. Code enabling others to evaluate cost, sample size, and time requirements for different trial designs is available from our website (see Web Resources).
Acknowledgments
We would like to thank Soumitra Ghosh for his insight into type 1 diabetes trials and Paul Newcombe and Linda McCarthy for their comments on the age-related macular degeneration models.
Supplemental Data
Web Resources
The URLs for data presented herein are as follows:
Center for Statistical Genetics, Trial Enrichment, http://genome.sph.umich.edu/wiki/Trial_Enrichment
FDA guideline for enrichment strategy for clinical trials, http://www.fda.gov/downloads/Drugs/GuidanceComplianceRegulatoryInformation/Guidances/UCM332181.pdf
Online Mendelian Inheritance in Man (OMIM), http://www.omim.org/
References
- 1.Dickson M., Gagnon J.P. Key factors in the rising cost of new drug discovery and development. Nat. Rev. Drug Discov. 2004;3:417–429. doi: 10.1038/nrd1382. [DOI] [PubMed] [Google Scholar]
- 2.Cummings J.L., Doody R., Clark C. Disease-modifying therapies for Alzheimer disease: challenges to early intervention. Neurology. 2007;69:1622–1634. doi: 10.1212/01.wnl.0000295996.54210.69. [DOI] [PubMed] [Google Scholar]
- 3.Florez J.C., Jablonski K.A., Bayley N., Pollin T.I., de Bakker P.I., Shuldiner A.R., Knowler W.C., Nathan D.M., Altshuler D., Diabetes Prevention Program Research Group TCF7L2 polymorphisms and progression to diabetes in the Diabetes Prevention Program. N. Engl. J. Med. 2006;355:241–250. doi: 10.1056/NEJMoa062418. [DOI] [PMC free article] [PubMed] [Google Scholar]
- 4.Ridker P.M., Danielson E., Fonseca F.A., Genest J., Gotto A.M., Jr., Kastelein J.J., Koenig W., Libby P., Lorenzatti A.J., MacFadyen J.G., JUPITER Study Group Rosuvastatin to prevent vascular events in men and women with elevated C-reactive protein. N. Engl. J. Med. 2008;359:2195–2207. doi: 10.1056/NEJMoa0807646. [DOI] [PubMed] [Google Scholar]
- 5.Simon R. The use of genomics in clinical trial design. Clin. Cancer Res. 2008;14:5984–5993. doi: 10.1158/1078-0432.CCR-07-4531. [DOI] [PubMed] [Google Scholar]
- 6.Burke W., Psaty B.M. Personalized medicine in the era of genomics. JAMA. 2007;298:1682–1684. doi: 10.1001/jama.298.14.1682. [DOI] [PubMed] [Google Scholar]
- 7.Pharoah P.D.P., Antoniou A.C., Easton D.F., Ponder B.A.J. Polygenes, risk prediction, and targeted prevention of breast cancer. N. Engl. J. Med. 2008;358:2796–2803. doi: 10.1056/NEJMsa0708739. [DOI] [PubMed] [Google Scholar]
- 8.Yang J., Benyamin B., McEvoy B.P., Gordon S., Henders A.K., Nyholt D.R., Madden P.A., Heath A.C., Martin N.G., Montgomery G.W. Common SNPs explain a large proportion of the heritability for human height. Nat. Genet. 2010;42:565–569. doi: 10.1038/ng.608. [DOI] [PMC free article] [PubMed] [Google Scholar]
- 9.Sanna S., Li B., Mulas A., Sidore C., Kang H.M., Jackson A.U., Piras M.G., Usala G., Maninchedda G., Sassu A. Fine mapping of five loci associated with low-density lipoprotein cholesterol detects variants that double the explained heritability. PLoS Genet. 2011;7:e1002198. doi: 10.1371/journal.pgen.1002198. [DOI] [PMC free article] [PubMed] [Google Scholar]
- 10.Lin X., Song K., Lim N., Yuan X., Johnson T., Abderrahmani A., Vollenweider P., Stirnadel H., Sundseth S.S., Lai E. Risk prediction of prevalent diabetes in a Swiss population using a weighted genetic score—the CoLaus Study. Diabetologia. 2009;52:600–608. doi: 10.1007/s00125-008-1254-y. [DOI] [PubMed] [Google Scholar]
- 11.Ridker P.M., Danielson E., Fonseca F.A., Genest J., Gotto A.M., Jr., Kastelein J.J., Koenig W., Libby P., Lorenzatti A.J., Macfadyen J.G., JUPITER Trial Study Group Reduction in C-reactive protein and LDL cholesterol and cardiovascular event rates after initiation of rosuvastatin: a prospective study of the JUPITER trial. Lancet. 2009;373:1175–1182. doi: 10.1016/S0140-6736(09)60447-5. [DOI] [PubMed] [Google Scholar]
- 12.Rathmann W., Giani G. Global prevalence of diabetes: estimates for the year 2000 and projections for 2030. Diabetes Care. 2004;27:2568–2569. doi: 10.2337/diacare.27.10.2568. author reply 2569. [DOI] [PubMed] [Google Scholar]
- 13.Wray N.R., Visscher P.M. Narrowing the boundaries of the genetic architecture of schizophrenia. Schizophr. Bull. 2010;36:14–23. doi: 10.1093/schbul/sbp137. [DOI] [PMC free article] [PubMed] [Google Scholar]
- 14.Hyttinen V., Kaprio J., Kinnunen L., Koskenvuo M., Tuomilehto J. Genetic liability of type 1 diabetes and the onset age among 22,650 young Finnish twin pairs: a nationwide follow-up study. Diabetes. 2003;52:1052–1055. doi: 10.2337/diabetes.52.4.1052. [DOI] [PubMed] [Google Scholar]
- 15.Nora J.J., Lortscher R.H., Spangler R.D., Nora A.H., Kimberling W.J. Genetic—epidemiologic study of early-onset ischemic heart disease. Circulation. 1980;61:503–508. doi: 10.1161/01.cir.61.3.503. [DOI] [PubMed] [Google Scholar]
- 16.Das S.K., Elbein S.C. The genetic basis of type 2 diabetes. Cellscience. 2006;2:100–131. doi: 10.1901/jaba.2006.2-100. [DOI] [PMC free article] [PubMed] [Google Scholar]
- 17.Seddon J.M., Cote J., Page W.F., Aggen S.H., Neale M.C. The US twin study of age-related macular degeneration: relative roles of genetic and environmental influences. Arch. Ophthalmol. 2005;123:321–327. doi: 10.1001/archopht.123.3.321. [DOI] [PubMed] [Google Scholar]
- 18.Voight B.F., Scott L.J., Steinthorsdottir V., Morris A.P., Dina C., Welch R.P., Zeggini E., Huth C., Aulchenko Y.S., Thorleifsson G., MAGIC investigators; GIANT Consortium Twelve type 2 diabetes susceptibility loci identified through large-scale association analysis. Nat. Genet. 2010;42:579–589. doi: 10.1038/ng.609. [DOI] [PMC free article] [PubMed] [Google Scholar]
- 19.Chen W., Stambolian D., Edwards A.O., Branham K.E., Othman M., Jakobsdottir J., Tosakulwong N., Pericak-Vance M.A., Campochiaro P.A., Klein M.L., Complications of Age-Related Macular Degeneration Prevention Trial Research Group Genetic variants near TIMP3 and high-density lipoprotein-associated loci influence susceptibility to age-related macular degeneration. Proc. Natl. Acad. Sci. USA. 2010;107:7401–7406. doi: 10.1073/pnas.0912702107. [DOI] [PMC free article] [PubMed] [Google Scholar]
- 20.Barrett J.C., Clayton D.G., Concannon P., Akolkar B., Cooper J.D., Erlich H.A., Julier C., Morahan G., Nerup J., Nierras C., Type 1 Diabetes Genetics Consortium Genome-wide association study and meta-analysis find that over 40 loci affect risk of type 1 diabetes. Nat. Genet. 2009;41:703–707. doi: 10.1038/ng.381. [DOI] [PMC free article] [PubMed] [Google Scholar]
- 21.Kathiresan S., Voight B.F., Purcell S., Musunuru K., Ardissino D., Mannucci P.M., Anand S., Engert J.C., Samani N.J., Schunkert H., Myocardial Infarction Genetics Consortium; Wellcome Trust Case Control Consortium Genome-wide association of early-onset myocardial infarction with single nucleotide polymorphisms and copy number variants. Nat. Genet. 2009;41:334–341. doi: 10.1038/ng.327. [DOI] [PMC free article] [PubMed] [Google Scholar]
- 22.Gerstein H.C., Yusuf S., Bosch J., Pogue J., Sheridan P., Dinccag N., Hanefeld M., Hoogwerf B., Laakso M., Mohan V., DREAM (Diabetes REduction Assessment with ramipril and rosiglitazone Medication) Trial Investigators Effect of rosiglitazone on the frequency of diabetes in patients with impaired glucose tolerance or impaired fasting glucose: a randomised controlled trial. Lancet. 2006;368:1096–1105. doi: 10.1016/S0140-6736(06)69420-8. [DOI] [PubMed] [Google Scholar]
- 23.Seddon J.M., Reynolds R., Maller J., Fagerness J.A., Daly M.J., Rosner B. Prediction model for prevalence and incidence of advanced age-related macular degeneration based on genetic, demographic, and environmental variables. Invest. Ophthalmol. Vis. Sci. 2009;50:2044–2053. doi: 10.1167/iovs.08-3064. [DOI] [PMC free article] [PubMed] [Google Scholar]
- 24.Reimann M., Bonifacio E., Solimena M., Schwarz P.E., Ludwig B., Hanefeld M., Bornstein S.R. An update on preventive and regenerative therapies in diabetes mellitus. Pharmacol. Ther. 2009;121:317–331. doi: 10.1016/j.pharmthera.2008.11.009. [DOI] [PubMed] [Google Scholar]
- 25.Jayasinghe S.R., Mishra A., Van Daal A., Kwan E. Genetics and cardiovascular disease: Design and development of a DNA biobank. Exp. Clin. Cardiol. 2009;14:33–37. [PMC free article] [PubMed] [Google Scholar]
- 26.Evans D.M., Marchini J., Morris A.P., Cardon L.R. Two-stage two-locus models in genome-wide association. PLoS Genet. 2006;2:e157. doi: 10.1371/journal.pgen.0020157. [DOI] [PMC free article] [PubMed] [Google Scholar]
- 27.Talmud P.J., Hingorani A.D., Cooper J.A., Marmot M.G., Brunner E.J., Kumari M., Kivimäki M., Humphries S.E. Utility of genetic and non-genetic risk factors in prediction of type 2 diabetes: Whitehall II prospective cohort study. BMJ. 2010;340:b4838. doi: 10.1136/bmj.b4838. [DOI] [PMC free article] [PubMed] [Google Scholar]
- 28.Hanley J.A., McNeil B.J. The meaning and use of the area under a receiver operating characteristic (ROC) curve. Radiology. 1982;143:29–36. doi: 10.1148/radiology.143.1.7063747. [DOI] [PubMed] [Google Scholar]
- 29.Lachin J.M. Introduction to sample size determination and power analysis for clinical trials. Control. Clin. Trials. 1981;2:93–113. doi: 10.1016/0197-2456(81)90001-5. [DOI] [PubMed] [Google Scholar]
- 30.Rosner B., Glynn R.J. Power and sample size estimation for the Wilcoxon rank sum test with application to comparisons of C statistics from alternative prediction models. Biometrics. 2009;65:188–197. doi: 10.1111/j.1541-0420.2008.01062.x. [DOI] [PubMed] [Google Scholar]
- 31.Wilson P.W.F., Meigs J.B., Sullivan L., Fox C.S., Nathan D.M., D’Agostino R.B., Sr. Prediction of incident diabetes mellitus in middle-aged adults: the Framingham Offspring Study. Arch. Intern. Med. 2007;167:1068–1074. doi: 10.1001/archinte.167.10.1068. [DOI] [PubMed] [Google Scholar]
- 32.Klein M.L., Francis P.J., Ferris F.L., 3rd, Hamon S.C., Clemons T.E. Risk assessment model for development of advanced age-related macular degeneration. Arch. Ophthalmol. 2011;129:1543–1550. doi: 10.1001/archophthalmol.2011.216. [DOI] [PubMed] [Google Scholar]
- 33.McCarthy L.C., Newcombe P.J., Whittaker J.C., Wurzelmann J.I., Fries M.A., Burnham N.R., Cai G., Stinnett S.W., Trivedi T.M., Xu C.-F. Predictive models of choroidal neovascularization and geographic atrophy incidence applied to clinical trial design. Am. J. Ophthalmol. 2012;154:568–578. doi: 10.1016/j.ajo.2012.03.021. e12. [DOI] [PubMed] [Google Scholar]
- 34.Moonesinghe R., Khoury M.J., Liu T., Janssens A.C. Discriminative accuracy of genomic profiling comparing multiplicative and additive risk models. Eur. J. Hum. Genet. 2011;19:180–185. doi: 10.1038/ejhg.2010.165. [DOI] [PMC free article] [PubMed] [Google Scholar]
- 35.Orban T., Sosenko J.M., Cuthbertson D., Krischer J.P., Skyler J.S., Jackson R., Yu L., Palmer J.P., Schatz D., Eisenbarth G., Diabetes Prevention Trial-Type 1 Study Group Pancreatic islet autoantibodies as predictors of type 1 diabetes in the Diabetes Prevention Trial-Type 1. Diabetes Care. 2009;32:2269–2274. doi: 10.2337/dc09-0934. [DOI] [PMC free article] [PubMed] [Google Scholar]
Associated Data
This section collects any data citations, data availability statements, or supplementary materials included in this article.