Abstract
We investigated pupillary light reflex (PLR) in 152 children with ASD, 116 typically developing (TD) children, and 36 children with non-ASD neurodevelopmental disorders (NDDs). Heart rate variability (HRV) was measured simultaneously to study potential impairments in the autonomic nervous system (ANS) associated with ASD. The results showed that the ASD group had significantly longer PLR latency, reduced relative constriction amplitude, and shorter constriction/redilation time than those of the TD group. Similar atypical PLR parameters were observed in the NDD group. A significant age effect on PLR latency was observed in children younger than 9 years in the TD group, but not in the ASD and NDD groups. Atypical HRV parameters were observed in the ASD and NDD groups. A significant negative correlation existed between the PLR constriction amplitude and average heart rate in children with an ASD, but not in children with typical development.
Keywords: pupillary light reflex, heart rate variability, autism, autonomic nervous system
Introduction
Autism spectrum disorders (ASDs) are complex developmental disorders with symptoms in three core areas: social functioning, communication, and restricted or repetitive behaviors. While much progress has been made regarding ASD, the understanding of its etiology is still evolving (Geschwind and Levitt 2007). Although diagnosis of ASD is based on behavioral assessment, various physical measures have also been used to look for the neurological dysfunctions underlying ASD. Among various measures, pupillary response has been an interesting target. Pupil size is controlled by two antagonistic iris muscles: the sphincter and the dilator (Barbur 2003) and can be easily measured using non-invasive imaging methods. Pupillary responses can reveal a rich set of neurological information (Loewenfeld 1999) and have long been used in both medical practice (Bremner 2009) and psychophysical studies (Laeng et al. 2012).
A few studies compared baseline pupil size in children with ASD and typically developing children, but the results have been inconsistent. Anderson and Colombo (2009) found baseline pupil size was significantly larger in children with ASD than either mental age or chronological age matched controls when they were presented with grey slides. This finding was later replicated in two different samples of children with ASD (Anderson et al. in press). However,Martineau et al. (2011) showed that children with ASD had significantly smaller baseline pupil size than typically developing children in response to a black slide. No difference in baseline pupil size was observed in a study by van Engeland et al. (1991) between the ASD group and typical controls.Fan et al. (2009a) also reported similar baseline pupil size in children with ASD and typically developing children in both dark- and light-adapted conditions although the data variation was significantly higher in the ASD group.
It is recognized in clinical tests (Bremner 2009) that resting pupil size may vary over a wide range even in individuals without any medical problems. On the other hand, the dynamic changes in pupil size induced by various stimuli may provide more reliable information about the neurological system (Bremner 2009).Anderson et al. (2006) reported an atypical pupillary response in children with ASD when viewing children’s faces. Specifically, the ASD group showed pupillary constriction in response to children’s faces; whereas children with typical development or developmental delays (non-ASD) showed pupil dilation.Martineau et al. (2011) revealed that the pupillary responses to neutral faces, virtual faces, and objects followed a similar three-phase time course in both children with ASD and typical controls, i.e. a rapid initial dilation followed with a rapid constriction and then a slow recovery to baseline. Recently, Wagner et al. (in press) reported that pupillary response to emotional faces was similar in adolescents with ASD and typical controls.
In comparison to the aforementioned social stimuli, luminance change is an easier way to induce consistent pupillary responses (Barbur 2003). When stimulated by a flash of light, pupil undergoes a characteristic process to constrict and then recover (Bremner 2009), which is referred to as pupillary light reflex (PLR). Atypical PLR was previously reported in children with ASD (Rubin 1961; Fan et al. 2009a). Rubin (1961) discovered that the pupillary constriction speed was significantly slower in children with autism than typical controls when stimulated using a constant light intensity. This observation was confirmed byFan et al. (2009a) using a short 100 ms optical stimulus at several different intensities.Fan et al. (2009a) also reported a significantly longer PLR latency and reduced constriction amplitude associated with ASD.
The PLR pathway includes the retina, pretectal nucleus, Edinger-Westphal nucleus, and ciliary ganglion (Lowenstein and Loewenfeld 1950; Appenzeller 1999). This PLR pathway is largely under the influence of the parasympathetic pathway of the autonomic nervous system (ANS) (Neuhuber and Schrödl 2011). Parasympathetic nerve fibers, which originate in the pupilloconstrictor neurons in the Edinger-Westphal nucleus and synapse at the ciliary ganglion, control the sphincter muscle. Sympathetic nerve fibers from the superior cervical ganglion control the dilator muscle which may also modulate the pupillary constriction process. As a result, PLR parameters can be influenced by ANS dysfunction (Bremner 2009).
ANS dysfunction has been reported in children with ASD in several studies.Ming et al. (2011) reported that families endorsed significantly more symptoms of autonomic dysfunction in their children with ASD than control families. Several studies have reported elevated heart rate in individuals with ASD in comparison to typically developing controls (Kootz and Cohen 1981; Ming et al. 2005; Bal et al. 2010).Ming et al. (2005) also found higher mean arterial and diastolic blood pressure, lower cardiac vagal tone and lower cardiac sensitivity to baroreflex in children with ASD. These findings suggest that children with ASD have an elevated autonomic arousal. In addition, lower baseline respiratory sinus arrhythmia was reported in children with ASD (Bal et al. 2010) suggesting a reduced vagal modulation in ASD. However,Mathewson et al. (2011) demonstrated that baseline cardiac autonomic measures were significantly affected by medication use in adults with ASD.
Heart rate and heart rate variability (HRV), which measures the beat–to-beat variations of the heart rate, are regulated by the ANS. Vagal activity reduces heart rate through the sinoatrial (SA) and atrioventricular (AV) nodes, while sympathetic activation increases the heart rate also through the SA node. HRV parameters are considered an objective assessment of cardiac autonomic function (Kamath and Fallen 1993; Thayer and Sternberg 2006). HRV has been used to evaluate ANS dysfunction in disorders such as panic disorder (Yeragani et al. 1993), schizophrenia (Bär et al. 2007), and sleep disorders (Bonnet and Arand 1998). Interestingly, a significant correlation between HRV and PLR was previously reported in patients with acute schizophrenia (Bär et al. 2008). However, HRV has not been investigated extensively in ASD.
The purpose of this present study is to investigate the atypical PLR associated with ASD in a larger heterogeneous sample. To study the potential association between atypical PLR and other ANS dysfunction in children with ASD, we simultaneously measured HRV during the PLR test. Because of the involvement of cognitive impairment and medication taking in children with ASD, their potential effects on PLR and HRV parameters were studied. We also tested a group of children with non-ASD neurodevelopmental disorders to investigate whether atypical PLR is specific to ASD. Due to the wide age distribution in the test population, the potential age effects on PLR and HRV parameters were also examined.
Methods
Participants
A total of 152 children with an ASD participated in this study (referred to as the “ASD” group). The ages ranged from 5 to 19 years with an average age of 10.7 ± 3.4 years; the group consisted of 135 boys (10.9 ± 3.5 years) and 17 girls (9.8 ± 2.6 years). Of the 152 participants, 145 were patients receiving clinical services at the University of Missouri Thompson Center for Autism and Neurodevelopmental Disorders, an interdisciplinary academic medical center specializing in diagnosis and treatment of ASD. Diagnostic interviews, caregiver questionnaires, and observation focusing on DSM-IV criteria (American Psychiatric Association, 2000) were used for the diagnosis of ASD in these individuals. The Autism Diagnostic Observation Schedule (ADOS) (Lord et al. 1989) was obtained for 112 participants and the Autism Diagnostic Interview – Revised (ADI-R) (Lord et al. 1994) was obtained for 80 patients; the ASD diagnosis was confirmed in all of these cases. Evaluations were conducted by a pediatrician and/or neuropsychologist; if there was disagreement, the results were discussed jointly to reach a consensus diagnosis. The remaining 7 children were diagnosed using a variety of measures, which were reviewed by the authors to confirm the ASD diagnosis. In addition, each of these 7 families completed the Social Communication Questionnaire Lifetime (SCQ) (Eaves et al. 2006) and Social Responsive Scale Questionnaire (SRS) (Constantino and Gruber 2005), all of which were scored above the ASD cutoff.
Among the 152 children with ASD, 86 were diagnosed with classic autism, 32 with Asperger’s Syndrome, and 34 with pervasive developmental disorder-not otherwise specified (PDD-NOS). Seventy children in the ASD group had taken one or more medications (includes stimulants, atypical antipsychotics, serotonin reuptake inhibitors, antihistamines, antiepileptics etc.) within 48 hours before the PLR test (referred to as the “w/med” group). The remaining children had not taken medication (referred to as the “w/o med” group).
A sample of 116 typically developing healthy children between 6 and 17 years of age without known visual, neurological, or cardiovascular problems comprised a typically developing comparison group (referred to as the “TD” group). Nine children who had a sibling with ASD were excluded from the data analysis. Thus 107 children (mean age = 10.9 ± 2.9 years) were included in the TD group, which consisted of 79 boys (mean age = 11.1 ± 3.1 years) and 28 girls (mean age = 10.6 ± 2.4 years). All participants in the TD group scored below the clinical cutoff (<15) on the Social Communication Questionnaire Lifetime (Eaves et al. 2006) (mean score = 2.3± 2.8). None of the TD participants had taken medications within 48 hours before the PLR test.
A sample of 36 children ranging in age from 5 to 17 years of age (mean age = 9.9 ± 3.0 years) with intellectual disabilities due to other neurodevelopmental disorders (NDDs) also participated in this study. This group, referred to as the “NDD” group, included 27 boys (mean age = 10.0 ± 3.1 years) and 9 girls (mean age = 9.7 ± 2.6 years). This group included Down syndrome (7), Fragile X syndrome (5), Neurofibromatosis Type One (1), Prader-Willi syndrome (1), and the remainder with idiopathic intellectual impairment. All participants in this group were assessed to confirm that they did not meet the diagnostic criteria for ASD. Nineteen children in the NDD group were on medications similar to those described above for the ASD group.
Intelligence quotient (IQ) scores were available for all participants with the exception of 30 children in the ASD group, 7 in the TD group and 2 in NDD group. The vast majority of IQ scores were derived from the Ravens Progressive Matrices (RPM) (Raven 1996) (n = 81 ASD, 100 TD, and 34 NDD). The remainder were derived from the Wechsler Abbreviated Test of Intelligence (n = 12 ASD), Differential Abilities Scale – 2nd Edition (n = 15 ASD), Leiter International Performance Scale – Revised (n = 9 ASD) and Stanford-Binet Intelligence Scales – Fifth Edition (n = 5 ASD). For purposes of later analysis of the relationship between overall intellectual ability and PLR parameters, participants were categorized into either the “Low IQ” group or the “High IQ” group. An IQ equivalent of 80 or higher (9.1 percentile) was used to designate a child with normal-to-above normal intelligence (Wechsler 1991). Thus, the 9.1 percentile was used for those who were assessed with the RPM, and a threshold score of 80 was used for children who had been assessed by other IQ tests. Distributions of the IQ subgroups and medication status of participants are shown in Table 1.
Table 1.
Distribution of IQ and medication use in TD, ASD and NDD groups.
| Group | IQ | w/o med | w/med | |
|---|---|---|---|---|
| TD | High-IQ | 98 | 0 | |
| Low-IQ | 2 | 0 | ||
| ASD | High-IQ | 44 | 34 | |
| Low-IQ | 23 | 21 | ||
| ASD diagnosis | Asperger | High-IQ | 9 | 11 |
| Low-IQ | 2 | 0 | ||
| Autism | High-IQ | 23 | 14 | |
| Low-IQ | 19 | 15 | ||
| PDD-NOS | High-IQ | 12 | 9 | |
| Low-IQ | 2 | 6 | ||
| NDD | High-IQ | 9 | 9 | |
| Low-IQ | 7 | 9 | ||
High-IQ: IQ score of 80 or higher (at or above 9.1th percentile)
Low-IQ: IQ score lower than 80 (below 9.1th percentile)
This study was approved by the Institutional Review Board of the University of Missouri. All participants and their legal guardians provided written informed assent and consent prior to participating.
PLR instrument
The binocular pupillography recording system used in this study is similar to that described previously (Fan et al. 2009a; Fan et al. 2009b). The system uses near-infrared imaging cameras (GC660, Allied Vision Technologies, Stadtroda, Germany) to record pupil images at a speed of 115 frames-per-second (fps). The spatial resolution of the imaging system is 0.035 mm/pixel. A 100 ms optical stimulus is produced using 530 nm green LEDs which illuminates a circular optical diffuser. The illuminated diffuser is positioned at 12.5 cm from the eye and has an effective diameter of 1.27cm (an equivalent visual field of 5.7°). The stimulus intensity was controlled by adjusting the electric current to the LED and by using different neutral density filters.
To obtain heart rate variability (HRV) in our population, the heart beat signal (RR tachogram) was recorded using a wireless heart rate measuring device (Polar RS800CX, Polar Electro Oy, Finland). A chest strap with an enclosed heart rate sensor measured the QRS intervals at a rate of 1 kHz. Several studies have found that the performance of this device is consistent with the conventional 12-lead ECG system (Gamelin et al. 2008; Goodie et al. 2000; Nunan et al. 2009; Porto and Junqueira Jr 2009).
Test procedure
The PLR test procedure was performed as described in detail previously (Daluwatte et al. 2012). In brief, throughout testing the child was seated in a comfortable chair with a back. Heart rate measurements were begun 5 minutes prior to the PLR testing and continued for 5 minutes following completion of the PLR testing. Participants fixed the sight on pictures of animals or toys displayed on a dim computer monitor placed 1.3 m away from the eye. PLR was first measured in light adapted (LA) conditions (220 lx room luminance) using 3 different stimulus intensities in ascending order: LA 69.3 cd/m2, LA 872.1 cd/m2, and LA 8721.1 cd/m2. The dark-adapted (DA) PLR was then measured at a stimulation intensity of DA 63.1 cd/m2 after 15-min of dark adaptation (<0.01 lx room luminance). For each stimulus condition, the left eye was stimulated 4 times and then the right eye was stimulated 4 times. A 30-sec interval was provided between consecutive stimulations. We tested 43% of the participants in the ASD group, 36% in the TD group, and 53% in the NDD group in the morning, while the remaining was tested in the afternoon.
Data analysis
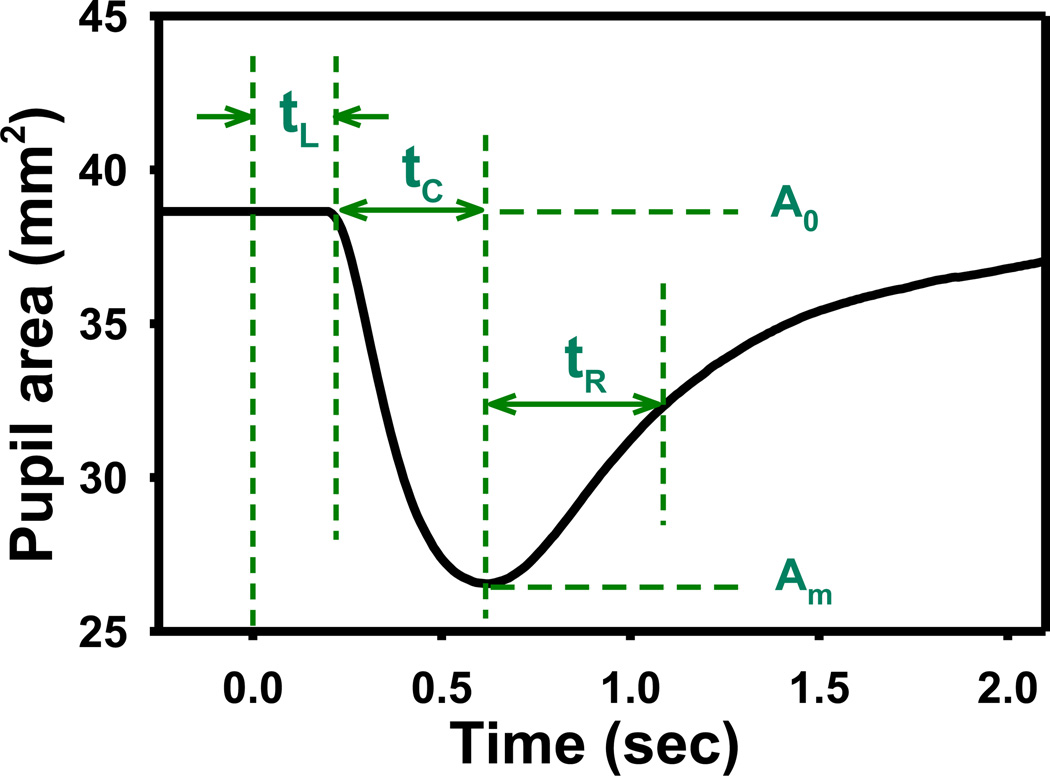
The pupilogram was constructed by extracting the pupil size from acquired pupil images as described in detail elsewhere (Fan et al., 2009a). The following PLR parameters were calculated from the pupilogram to quantify the child’s pupillary response (Fig. 1): (1) the baseline pupil diameter (D0), defined as the average resting pupil diameter before stimulus onset; (2) the relative constriction amplitude, calculated as , where Dm is the minimal pupil diameter during constriction; (3) the latency (tL), defined as the time that elapsed between stimulus onset and the beginning of pupil constriction; (4) the constriction time (tC), defined as the time interval between the beginning of pupil constriction and when pupil reached minimal diameter Dm; (5) the redilation time (tR), calculated as the time interval between the minimal diameter Dm and when the pupil recovered to half of the constriction; (6) the constriction velocity (vC), calculated as D0 − Dm /2tC; and (7) the redilation velocity (vR), calculated as D0 − Dm /4tR. PLR data from both eyes obtained during 8 repeated measurements were averaged to calculate the mean value and standard deviation at each stimulus condition. PLR images of 2 children in the ASD group, 1 child in the TD group, and 3 children in the NDD group could not be processed because of excessive eye movement or closure during the test.
Figure 1.
An illustration of the pupilogram and the associated PLR parameters. The optical stimulus is given at time zero. The baseline and minimal pupil diameters are calculated as , respectively. The relative constriction amplitude is obtained as A% = A0−Am /A0. The constriction and redilation velocities are calculated as vC=D0 − Dm /2tC and vR= D0 − Dm /4tR, respectively.
In addition to the average heart rate (AHR), heart rate variability (HRV) was calculated using both time-domain and frequency-domain analyses as explained by Malik (1996). Two time-domain parameters were calculated: (1) the standard deviation of normal to normal (NN) intervals (SDNN) and (2) the root mean square of successive differences (rMSSD). The frequency-domain power spectrum was analyzed using Fast Fourier Transform (FFT). Two frequency-domain HRV parameters were calculated: the normalized power of the high-frequency band (HFN) (HF = 0.15–0.4 Hz) and the LF/HF power ratio, where the low-frequency bandwidth was 0.04–0.15 Hz. HFN is generally considered as an indicator of vagal activity and is correlated with rMSSD (Malik 1996). SDNN carries influences from both parasympathetic and sympathetic modulation (Malik 1996). The LF/HF ratio may reflect the “sympathetic outflow” or the “sympathovagal balance” (Malik 1996; Berntson et al. 1997).
To determine any potential effect of participating in the PLR procedure on heart rate variability, the HRV was analyzed in the following 5 different “HRV measurement phases”: (1) before the PLR test (5 min), (2) during LA PLR (10 min), (3) during dark adaptation (15 min), (4) during DA PLR (5 min), and (5) after the PLR test (5 min). We were not able to acquire HRV in 9 children in the ASD group, 1 in the TD group, and 1 in the NDD group because the participants declined to wear the heart rate sensor. A malfunction of the heart rate sensor resulted in missing HRV data in 2 other children in the ASD group.
The Kolmogorov-Smirnov test was used to verify normal distributions of all measured PLR and HRV parameters. For each PLR and HRV parameter, the Analysis of Covariance (ANCOVA) using the PROC MIXED procedure in SAS (Version 9.2, SAS Institute Inc., Cary, NC, USA) was applied to examine the effects of group (TD, ASD, and NDD), age, and test conditions (stimulus intensity/HRV measurement phase and time of day of the test). Follow up analysis of variance (ANOVA), multivariate analysis of variance (MANOVA), and t-tests with Bonferroni correction were used appropriately to confirm effects revealed by the ANCOVA model. ANOVA model was applied to study the effects of IQ (High IQ and Low IQ) and medication (“w/o med” and “w/med”) in the ASD and NDD groups, and the effect of ASD diagnosis (classic autism, Asperger’s, and PDD-NOS) in the ASD group. The method reported by Steyn and Ellis (2009) was applied to evaluate effect size for group differences using MANOVA. An value of 0.02, 0.13 and 0.26 was considered as a small, medium and large effect, respectively (Steyn and Ellis, 2009). Pearson product moment correlation was applied to study correlation between PLR parameters and HRV parameters. A p value <0.05 was considered significant.
Results
The mean and standard deviations of all measured PLR and HRV parameters in the TD, ASD, and NDD groups are shown in Table 2 and Table 3, respectively.
Table 2.
Summary of PLR results. The results are represented as group mean ± standard deviation.
| Stimulus intensity (cd/m2) |
Resting pupil diameter (mm) |
PLR latency (ms)* |
Constriction (%)* |
Constriction time (ms)* |
Redilation time (ms)* |
Constriction velocity (mm2/s) |
Redilation velocity (mm2/s) |
|
|---|---|---|---|---|---|---|---|---|
| TD | LA 69.3 | 274.3±23.9 | 11.8±5.5 | 370.7±73.4 | 402.0±86.3 | 0.81±0.44 | 0.37±0.20 | |
| LA 872.1 | 6.58±0.61 | 239.0±16.2 | 26.9±7.1 | 399.2±52.8 | 498.1±99.9 | 1.75±0.75 | 0.72±0.30 | |
| LA 8721.1 | 214.4±14.4 | 40.8±7.2 | 464.5±51.2 | 595.6±116.6 | 2.37±0.95 | 0.98±0.45 | ||
| DA 63.1 | 7.44±0.77 | 244.0±15.4 | 44.7±6.9 | 580.2±59.4 | 804.4±171.8 | 2.41±0.97 | 0.91±0.36 | |
| ASD | LA 69.3 | 302.2±32.2 | 9.6±6.1 | 336.7±75.6 | 370.3±89.2 | 0.76±0.50 | 0.35±0.21 | |
| LA 872.1 | 6.50±0.81 | 265.3±25.4 | 22.5±8.3 | 364.5±63.4 | 455.8±104.0 | 1.65±0.76 | 0.68±0.31 | |
| LA 8721.1 | 237.7±22.5 | 36.6±8.5 | 434.1±62.9 | 560.7±106.1 | 2.39±0.91 | 0.95±0.35 | ||
| DA 63.1 | 7.47±0.88 | 262.7±18.5 | 41.6±7.7 | 552.1±73.8 | 737.8±155.0 | 2.55±0.91 | 0.99±0.40 | |
| NDD | LA 69.3 | 307.1±44.6 | 10.5±5.8 | 372.9±77.1 | 415.7±117.4 | 0.65±0.46 | 0.29±0.19 | |
| LA 872.1 | 6.36±0.74 | 270.9±22.1 | 22.1±7.3 | 379.4±60.1 | 475.5±86.8 | 1.42±0.86 | 0.55±0.34 | |
| LA 8721.1 | 245.6±23.6 | 36.5±8.8 | 446.0±66.8 | 562.2±85.6 | 1.99±1.01 | 0.78±0.34 | ||
| DA 63.1 | 7.14±0.83 | 269.9±26.2 | 42.2±8.5 | 566.3±107.4 | 730.0±116.5 | 2.00±0.85 | 0.79±0.35 | |
Significant group difference (ANCOVA p< 0.0001).
Table 3.
Summary of HRV results. The results are represented as group mean ± standard deviation.
| HRV measurement phase |
AHR (bmp)* | SDNN (ms)* | rMSSD (ms)* |
LF/HF (n.u.) | HFN (%) | |
|---|---|---|---|---|---|---|
| TD | 1 | 90.1±12.4 | 64.2±24.3 | 38.2±20.5 | 2.7±1.6 | 31.2±10.3 |
| 2 | 90.0±12.1 | 69.7±24.3 | 36.9±17.7 | 4.5±5.2 | 22.8±8.0 | |
| 3 | 93.1±12.5 | 66.4±28.0 | 32.6±17.1 | 3.4±1.6 | 26.3±10.0 | |
| 4 | 91.0±13.0 | 72.0±26.3 | 36.4±18.2 | 4.4±3.0 | 22.7±9.5 | |
| 5 | 92.9±13.3 | 65.4±27.2 | 33.2±17.7 | 4.1±0.3 | 25.2±10.5 | |
| ASD | 1 | 95.2±14.0 | 56.9±20.1 | 32.2±15.6 | 2.9±1.8 | 29.5±10.8 |
| 2 | 96.1±13.7 | 61.1±20.9 | 31.4±15.6 | 3.7±2.1 | 24.7±9.9 | |
| 3 | 99.8±12.9 | 56.8±23.4 | 27.4±14.0 | 3.4±1.7 | 25.2±8.3 | |
| 4 | 97.0±13.0 | 60.6±23.8 | 30.6±15.5 | 3.7±1.9 | 24.1±8.4 | |
| 5 | 99.4±13.4 | 57.1±23.3 | 28.0±13.9 | 3.8±2.6 | 24.3±9.3 | |
| NDD | 1 | 100.1±13.8 | 51.4±18.3 | 27.9±12.6 | 2.4±1.2 | 32.6±10.4 |
| 2 | 98.9±13.1 | 54.6±18.2 | 28.6±12.3 | 3.1±1.6 | 27.3±9.1 | |
| 3 | 105.3±13.4 | 44.8±13.6 | 22.1±9.1 | 3.0±1.3 | 26.9±7.5 | |
| 4 | 101.5±13.8 | 51.5±19.2 | 26.7±12.2 | 3.7±2.0 | 24.6±9.6 | |
| 5 | 104.7±14.5 | 45.9±15.4 | 23.3±12.3 | 3.5±1.8 | 25.5±9.4 | |
Significant group difference (ANCOVA p< 0.0001).
bmp = beats per minute
SDNN = standard deviation of normal to normal (NN) intervals
rMSSD = root mean square of successive differences
LF = low frequency
HF = high frequency
The ANCOVA model revealed that the stimulation condition (adaptation and stimulus intensity) had a statistically significant effect (p < 0.0001) on all PLR parameters, including the constriction time (tC), relative constriction amplitude (ΔA%), latency (tL), redilation time (tR), constriction velocity (vC), and redilation velocity (vR). As expected, the resting pupil size was larger in DA than in LA. The PLR constriction amplitude, constriction time, and redilation time all increased with stimulus intensity, whereas the PLR latency decreased with stimulus intensity at the same adaptation. The constriction and redilation velocities also increased with stimulus intensity in LA and were larger in DA tests than LA tests at similar stimulus intensities. The interaction between group and stimulus was not significant for any of the PLR parameters, which suggests that the stimulus dependency was similar in all subject groups.
Subject group differences
Group differences in PLR parameters
The PLR parameters were significantly different between the TD and ASD groups, and between the TD and NDD groups, but not between the ASD and NDD groups.
The ANCOVA model indicated that the group (TD, ASD, and NDD) had a significant effect on PLR latency (F2,1107 = 150.44 p <0.0001), relative constriction amplitude (F2,1106 = 29.96 p < 0.0001), constriction time (F2,1103 = 31.69 p < 0.0001), and redilation time (F2,1096=14.67 p < 0.0001). Post-hoc MANOVA confirmed that the ASD and NDD groups had a significantly longer latency (F4,229 = 23.24 p < 0.0001 for ASD; F4,130 = 21.69 p < 0.0001 for NDD) and lesser relative constriction amplitude (F4,231 = 4.47 p = 0.002 for ASD; F4,130 = 3.74 p = 0.007 for NDD) than those of the TD group for all testing conditions. The ASD group also had a shorter constriction time (MANOVA F4,228 = 5.01 p =0.0007 ) and redilation time (MANOVA F4,225 = 3.39 p = 0.01 ) than those of the TD group. The mean PLR latency of the NDD group appeared to be longer than that of the ASD group, but the difference was not statistically significant (MANOVA F4,152 = 1.71 p = 0.15). No significant group differences were found for other PLR parameters.
Group differences in AHR and HRV parameters
The ASD and NDD groups had significantly different AHR and HRV parameters than the TD group. The NDD group showed a significantly faster AHR than the ASD group.
The ANCOVA model revealed a significant group effect on AHR (F2,1343 = 50.81 p < 0.0001) and on time-domain HRV parameters (F2,1340 = 41.92 p < 0.0001; and F2,1340 = 27.46 p < 0.0001 for SDNN and rMSSD respectively). Post-hoc MANOVA confirmed that children with ASD had a significantly faster heart rate than that of typical controls in all 5 HRV measurement phases (F5,218 = 3.32 p = 0.007 ) (Table 3). The mean values of SDNN and rMSSD were lower in the ASD group than the TD group. However, MANOVA revealed that these differences were not statistically significant (F5,217 = 2.00 p = 0.08; and F5,217 = 1.46 p = 0.20 for SDNN and rMSSD, respectively). The AHR of the NDD group was significantly faster than that of the ASD group (MANOVA F5,146 = 2.63 p = 0.03 ). The NDD group also had a significantly faster AHR (F5,132 = 5.41 p = 0.0001 ), lower SDNN (F5,131 = 4.70 p = 0.0006 ) and lower rMSSD (F5,131 = 2.63 p = 0.03 ) than those of the TD group.
Age effect
A significant age effect on PLR latency was observed in the TD group, but not in the ASD group. Both ASD and TD groups showed similar age trends for average heart rate and HRV parameters.
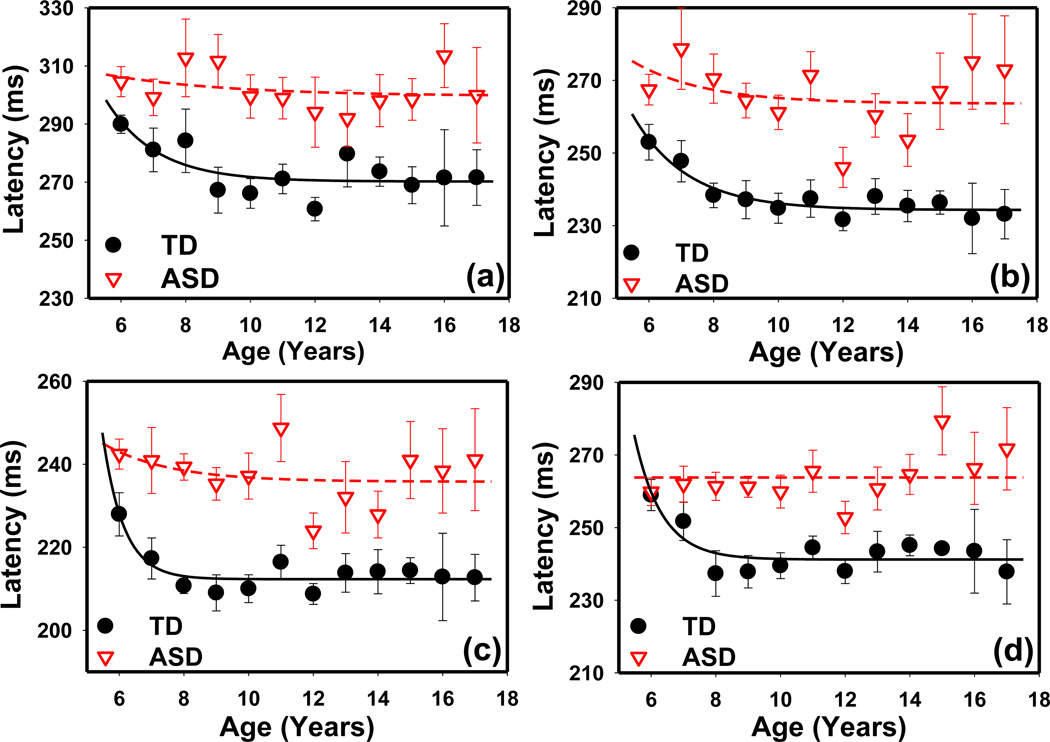
In the TD group, the PLR latency decreased from 6 to 8 years and reached a plateau thereafter (Fig. 2). One 16-year-old and two 13-year-olds in the TD group were identified as outliers on the regression line (PROC ROBUSTREG procedure in SAS); hence, their data were not included in the data shown in Fig. 2. In children 6 to 8 years of age, the ANCOVA model indicated that the Age*Group interaction was a significant factor on PLR latency (F4,265 = 3.26 p = 0.01), suggesting that PLR latency had different age profiles in the 3 subject groups. Analysis using the CONTRAST statement of GLM procedure with matrix [+1, 0, −1] in SAS confirmed that latency decreased from 6 to 8 years in the TD group (F1,21 = 0.22 p = 0.64; F1,21 = 4.85 p = 0.039; F1,21 = 8.97 p = 0.007; and F1,21 = 7.49 p = 0.012 for latency measured at LA 69.3 cd/m2, LA 872.1 cd/m2, LA 8721.1 cd/m2, and DA 63.1 cd/m2, respectively). However, this decreasing trend did not exist in the ASD group at any of the 4 stimulus intensities (F1,36 = 0.37 p = 0.55; F1,35 = 0.07 p = 0.79; F1,37 = 0.08 p = 0.93; and F1,35 = 0.06 p = 0.81).
Figure 2.
PLR latency vs. age measured in the TD and ASD groups at different stimulus conditions: (a) LA 69.3 cd/m2, (b) LA 872.1 cd/m2, (c) LA 8721.1 cd/m2, (d) DA 63.1 cd/m2. The lines are fitting results using an exponential decay function y=a*exp(−b*x)+c. The error bars indicate the standard error.
For further confirmation, the lines in Fig. 2 show the best curve fitting results using an exponential decay function y = a exp(−bx) + c with the curve-fitting tool in Matlab (Mathworks, MA). The TD results were well fitted with this function, with R2 ranging from 0.56 to 0.88. However, either the ASD results could not be fitted with this exponential decay function or the decay was much slower than the TD results. The age effect was also not significant in the NDD group, although the number of participants was much smaller.
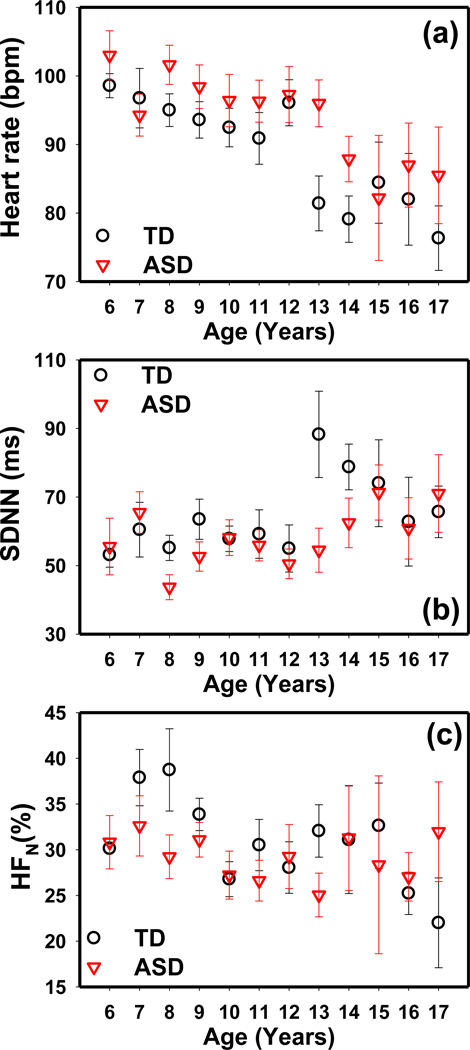
The ANCOVA model revealed a significant age effect on AHR and both time- and frequency-domain HRV parameters. The AHR, SDNN, and HFN values measured during HRV measurement phase 1 (before the PLR test) in the TD and ASD groups are shown in Fig. 3. The AHR decreased with age in both groups. SDNN showed little change before 12 years of age but was increased in older children. HFN decreased with age in both the TD and ASD groups. Similar results were obtained in the other HRV measurement phases. A similar age effect on AHR was observed in the NDD group, but the time domain and the frequency domain parameters did not show a significant age effect in this group.
Figure 3.
The (a) average heart rate, (b) SDNN and (c) HFN obtained at different ages in the TD and ASD groups measured during the HRV measurement phase 1 (before PLR test). Similar results were obtained in other HRV measurement phases. The error bars indicate the standard error.
Medication effect
A significant medication effect was observed on average heart rate and HRV parameters, but not on PLR parameters.
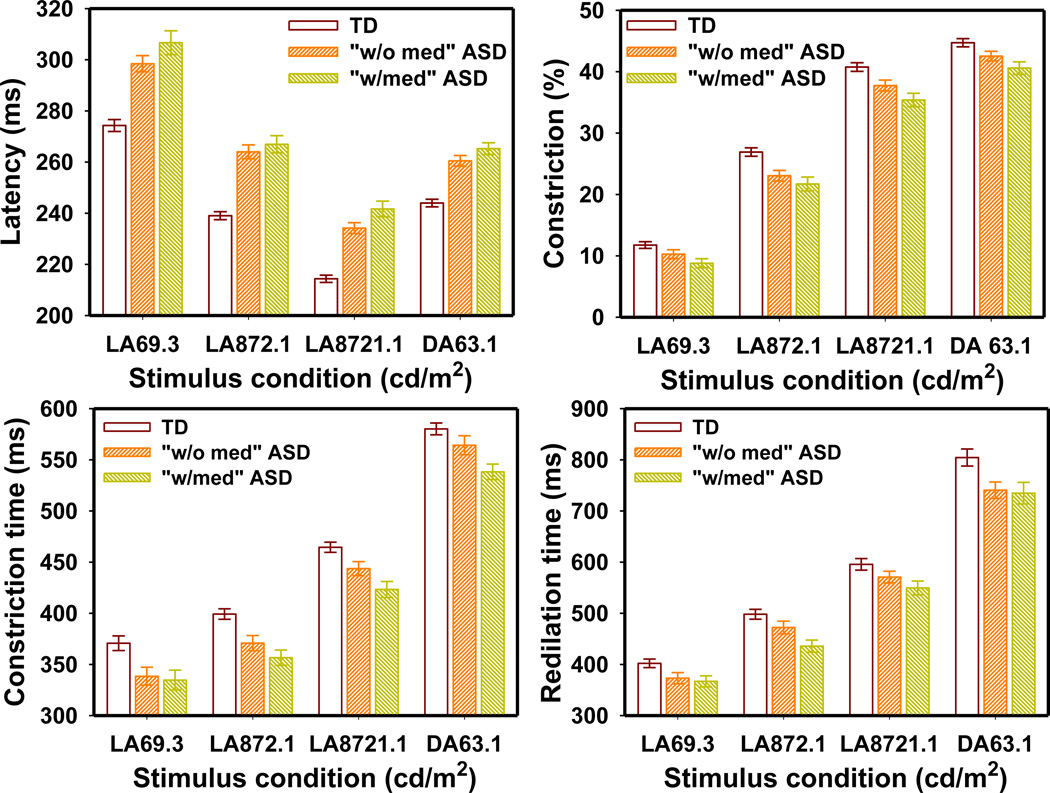
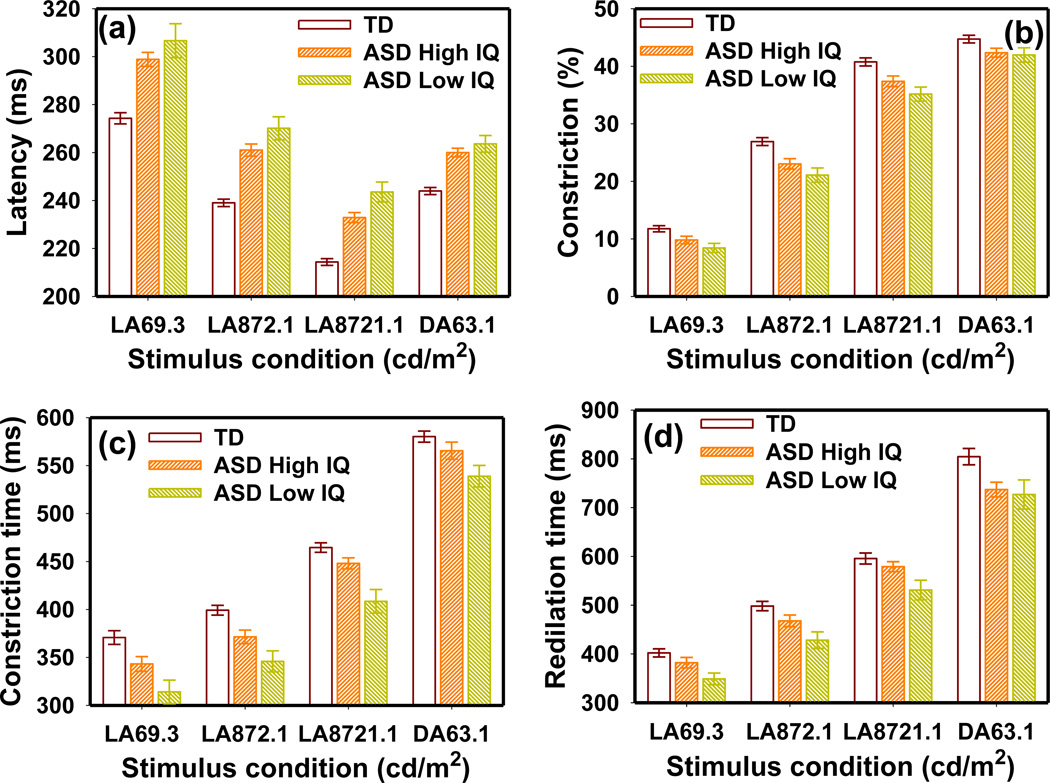
The PLR latency in the TD group was significantly different from that in both the “w/med” ASD group (F4,159 = 20.35 p < 0.0001) and the “w/o med” ASD group (F4,171 = 15.80 p < 0.0001). The TD group also had significantly larger PLR constriction than both the “w/med” ASD group (F4,160 = 3.84 p = 0.005) and the “w/o med” ASD group (F4,172 = 2.90 p = 0.023). Similarly, the PLR constriction time was significantly longer in the TD group than in both the “w/med” ASD group (F4,159 = 5.56 p = 0.0003) and the “w/o med” ASD group (F4,170 = 2.77 p = 0.029). Though the “w/med” ASD group appeared to have a slightly greater PLR latency, lesser constriction amplitude, and shorter constriction time than those of the “w/o med” ASD group (Fig. 4), the MANOVA indicated that these differences were not significant (F4,123 = 0.92 p = 0.45; F4,125 = 0.64 p = 0.64; and F4,122 = 1.25 p = 0.29 for latency, constriction amplitude, and constriction time respectively). The redilation time was different only between the TD and “w/med” ASD groups (F4,158 = 3.63 p = 0.007) but not between the TD and “w/o med” ASD group (F4,168 = 1.87 p = 0.11) or between the “w/med” and “w/o med” ASD groups (F4,119 = 0.96 p = 0.43).
Figure 4.
PLR latency, constriction amplitude, constriction time and redilation time in the TD, “w/med” ASD, and “w/o med” ASD groups measured at different stimulus conditions. The error bars indicate the standard error.
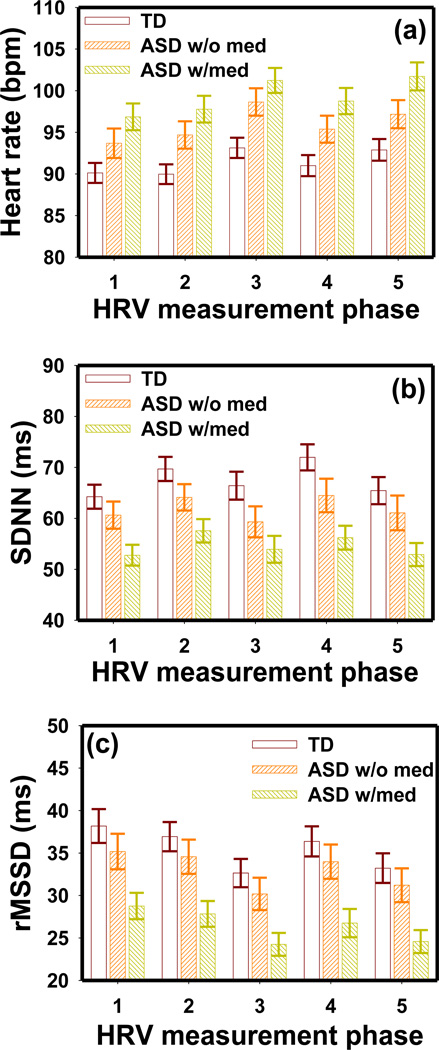
The ASD “w/med” group had faster AHR and lesser SDNN and rMSSD than those of the ASD “w/o med” group (Fig. 5). The MANOVA test indicated significant group differences between the TD and ASD “w/med” group with respect to average heart rate (F5,157 = 3.75 p = 0.003), SDNN (F5,156 = 2.23 p = 0.006) and rMSSD (F5,156 = 2.53 p = 0.031). However, these parameters were not significantly different between the TD and ASD “w/o med” groups or between “w/med” and “w/o med” ASD groups. Similar results between the “w/med” and “w/o med” groups were obtained in the NDD group.
Figure 5.
The (a) average heart rate, (b) SDNN and (c) rMSSD in the TD, “w/med” ASD and “w/o med” ASD groups obtained in the five HRV measurement phases. The HRV measurement phases are numbered as 1: before PLR test, 2: during LA PLR, 3: during dark adaptation, 4: during DA PLR, and 5: after PLR test. The error bars indicate the standard error.
IQ effect
No significant IQ effect was observed on any PLR or HRV parameters in the ASD group. Children with ASD and a “Low IQ” had a slightly longer latency, lesser constriction amplitude, shorter constriction/redilation times, and smaller pupil diameter than those with a “High IQ” (Fig. 6). However, the MANOVA model indicated that the differences between the “High IQ” and “Low IQ” groups were only marginally significant with respect to PLR latency (F4,98 = 2.28 p = 0.066) and not significant for constriction amplitude (F4,100 = 0.37 p = 0.83), constriction time (F4,97 = 1.84 p = 0.13), and redilation time (F4,95 = 0.86 p = 0.49). The TD group had significantly longer latency, lesser constriction amplitude, and shorter constriction time than both the “High IQ” and “Low IQ” ASD groups.
Figure 6.
The IQ effects on (a) PLR latency, (b) constriction amplitude, (c) constriction time and (d) redilation time in the ASD group. The error bars indicate the standard error.
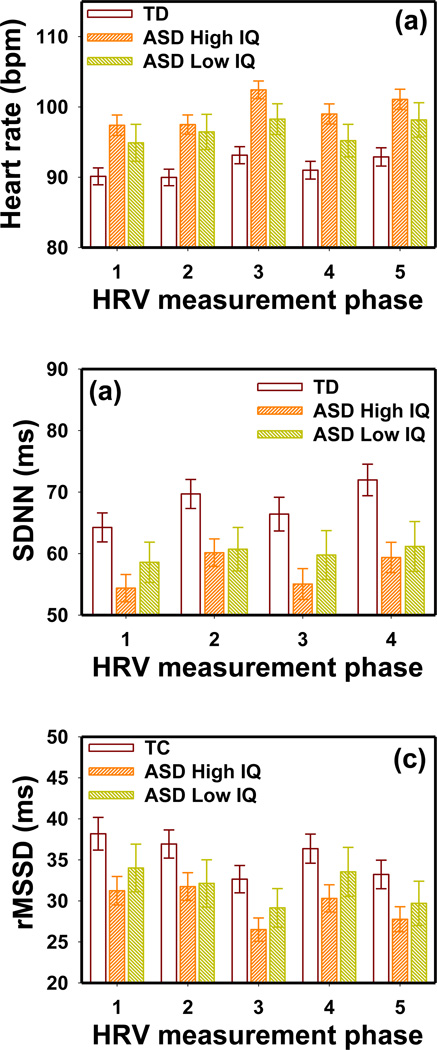
Children with ASD and a “Low IQ” had a slower mean AHR, larger SDNN and rMSSD than those with a “High IQ” (Fig. 7). However, the MANOVA model indicated that the differences between the “High IQ” and “Low IQ” groups were insignificant (F5,88 = 0.93 p = 0.47 for AHR; F5,88 = 0.51 p = 0.77 for SDNN; and F5,88 = 0.66 p = 0.66 for rMSSD). The TD group had significantly slower AHR than the “High IQ” ASD group (F5,167 = 4.21 p = 0.001), but not the “Low IQ” ASD group (F5,137 = 1.72 p = 0.13). An IQ effect was not found for any other PLR and HRV parameters in the ASD group. Similar results were observed in the NDD group.
Figure 7.
The IQ effects on (a) AHR, (b) SDNN and (c) rMSSD in the ASD group obtained in all five HRV measurement phases. The error bars indicate the standard error.
Interaction between IQ and medication
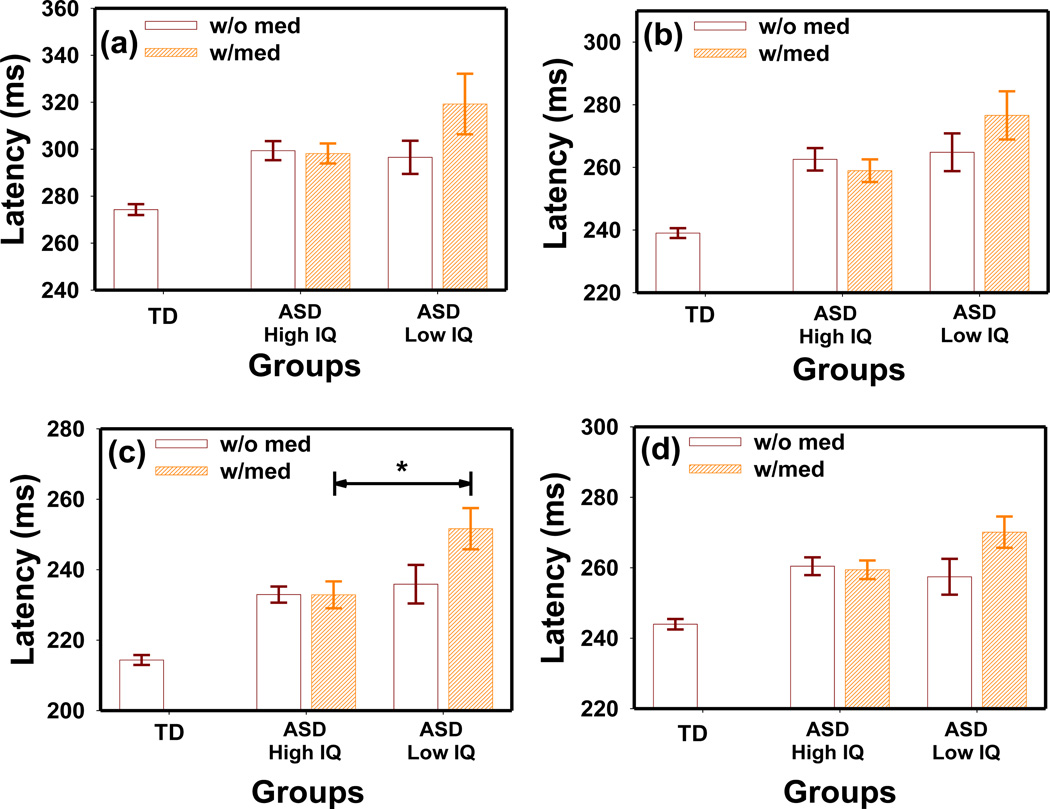
The interaction between IQ and medication appeared to have a significant effect on PLR latency in the ASD group as revealed by ANOVA (F1,453 = 12.74 p = 0.0004) (Fig. 8). Children in the “High IQ” group did not show a difference with medication (MANOVA F4,87 = 0.34 p = 0.85). In the “Low IQ” group, those using medication appeared to have a longer latency than those who were not using medication. However, this difference did not reach statistical significance in the MANOVA test (F4,43 = 1.40 p = 0.25).
Figure 8.
The effect of IQ and medication interaction on PLR latency at stimulation intensities of (a) LA69.3 cd/m2, (b) LA872.1 cd/m2 (c) LA8721.1 cd/m2, and (d) DA63.1 cd/m2 in the ASD group. *t-test p = 0.03, Bonferroni corrected.
Further analysis in the “w/o med” subgroups indicated that the “High IQ” group had a similar latency as the “Low IQ” group (MANOVA F4,53 = 0.87 p = 0.5). However, the IQ effect was significant in the “w/med” group at the highest stimulus intensity of LA 8721.1 cd/m2 (t-test p = 0.03, Bonferroni corrected) with the “Low IQ” showing a longer latency than the “High IQ” group.
The above interaction effect was not significant on other PLR parameters or on any HRV parameters in the ASD group. In addition, the above interactions were not significant in the NDD group.
Effects of PLR test on HRV
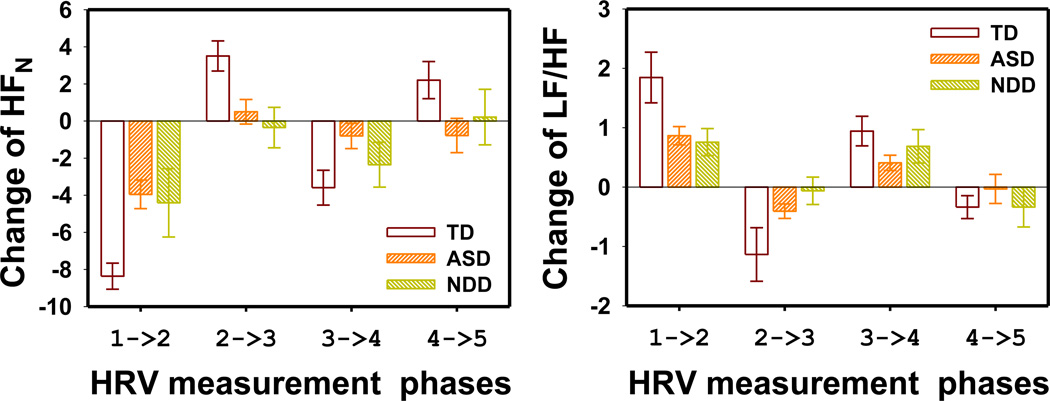
The HFN and LF/HF parameters changed significantly when transiting between resting periods and PLR testing periods in all 3 groups. Such changes were smaller in the ASD and NDD groups than the TD group.
The ANCOVA model indicated that the HRV measurement phase had a statistically significant effect on AHR, SDNN, rMSSD, LF/HF, and normalized HF power (F4,1343 = 6.29 p < 0.0001; F4,1340 = 3.29 p = 0.01; F4,1340 = 4.89 p = 0.0006; F4,1340 = 8.84 p < 0.0001; and F4,1320 = 18.91 p < 0.0001, respectively). The interaction between group and HRV measurement phase was not significant. However, post-hoc one-way ANOVA indicated that the HRV measurement phase effect was significant only for the LF/HF (p < 0.013) and HFN (p < 0.005) in all 3 subject groups.
The changes of the 2 frequency domain parameters between 2 adjacent HRV measurement phases are shown in Fig. 9. HFN decreased when transiting from resting phases to test phases (phase 1 to 2 and phase 3 to 4) and increased when transiting from test phases to resting phases (phase 2 to 3 and phase 4 to 5). The changes in the LF/HF parameters were opposite of those observed in HFN. The HFN changes were significantly larger in the TD group than in the ASD groups (MANOVA F4,226 = 4.81 p = 0.001). However, the LF/HF ratio changes between the TD group and the ASD group was not significantly different (MANOVA F4,231 = 1.73 p = 0.14). The above changes were not significantly different between the ASD and NDD groups (MANOVA F4,157 = 0.81 p = 0.52; and F4,160 = 0.99 p = 0.42 for HFN changes and LF/HF ratio changes, respectively).
Figure 9.
The change of frequency domain HRV parameters between consecutive HRV measurement phases. (a) HF normalized power and (b) LF/HF ratio. The error bars indicate the standard error. The HRV measurement phases are numbered as 1: before PLR test, 2: during LA PLR, 3: during dark adaptation, 4: during DA PLR and 5: after PLR test.
Correlation between PLR and HRV
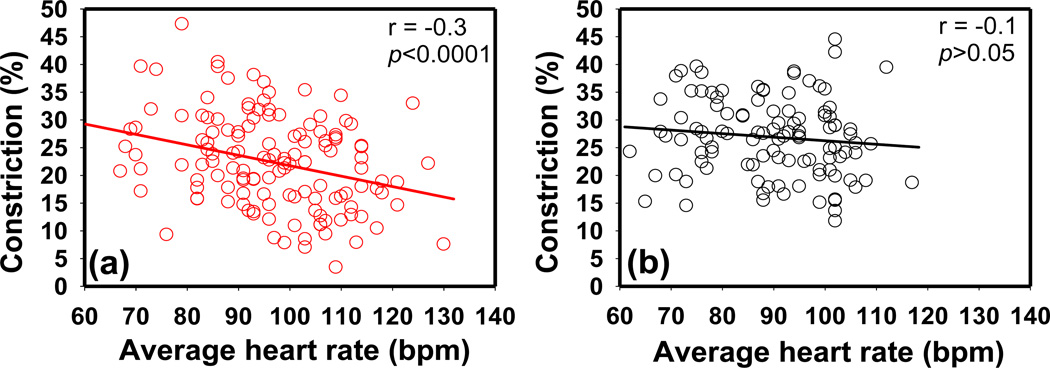
PLR constriction amplitude was significantly correlated with average heart rate in the ASD group in all LA tests (r = −0.3, p < 0.01) (Fig. 10). This correlation was observed in both the “w/o med” ASD and ‘w/med” ASD groups. However, this correlation was not observed in typically developing children (p > 0.05). This correlation was significant in the NDD group only at the highest stimulus intensity of LA 872.1 cd/m2. Correlations were not found between other PLR and HRV parameters.
Figure 10.
The correlation between average heart rate and relative constricition amplitude in (a) children with ASD and (b) typical controls. The data shown were measured at stimulus intensity of LA 872.1 cd/m2. (Pearson's r = −0.3*, −0.3**, −0.3**, −0.1 a in the ASD group and r = −0.06 a, −0.1a, −0.1a, −0.02a in the TD group at stimulus LA 69.3 cd/m2, LA 872.1 cd/m2, LA 8721.1 cd/m2, and DA 63.1 cd/m2, respectively. **p<0.001, *p<0.01, a p>0.05).
Subject group discrimination
Using the DISCRIM procedure in SAS, a step-wise (PROC STEPDISC) variable selection procedure was used to identify the best candidate parameters to discriminate between the ASD and TD groups. With a significance level of p = 0.15, the procedure selected following measurements for the discrimination model: latency at LA 69.3 cd/m2 and LA 8721.1 cd/m2, constriction amplitude at LA 69.3 cd/m2 and LA 8721.1 cd/m2, constriction time at LA 69.3 cd/m2 and LA 872.1 cd/m2, and resting pupil diameter at DA. The discriminant analysis results were significant (χ2(28) = 85.5, p < 0.0001) with 81.5% subjects successfully classified (23.6% false negatives and 12.3% false positives). When the NDD group was included in the test data set, 72.4% of them were classified into the ASD group and 27.6% were classified into the TD group. Notably, the majority (53.8%) of the misclassified children with typical development were female although females comprised only a small portion of the overall sample. A slightly higher successful discrimination rate (83.4%) was obtained when the DISCRIM procedure was applied to the dataset after removing all female participants, with a 21.7% false-negative rate and a 9.0% false-positive rate. Examination of autism specific variables revealed that 9.3% children with classic autism were misclassified, along with 25% with Asperger’s and 26.5% with PDDNOS. Of the children with ASD who were misclassified, 76.7% were in the “High IQ” group.
Discussion
The current results confirmed the previous observation byFan et al. (2009a) that children with an ASD had longer latency and less relative constriction than children with typical development. Furthermore, we found that the constriction time and redilation time were shorter in children with an ASD compared to children with typical development. Due to the predominance of male participants in this study, we also analyzed the data with only the male participants, and all group differences remained the same. Our analyses did not show a significant difference between the PLR and HRV measurements obtained in the mornings and those obtained in the afternoons. We did not find any ASD diagnosis (classic autism, Asperger’s Syndrome, and PDD-NOS) effects on PLR and HRV measurements.
It is interesting that the age trend of PLR latency observed in typically developing children was not observed in the ASD group. It is important to note that this trend (Fig. 2) is in sharp contrast to the age profiles of AHR and HRV (Fig. 3) which are similar in both TD and ASD groups. As an additional comparison, the age trend of PLR latency in typical controls is different from the maturation of the visual system characterized by pattern visual evoked potential (VEP), which stabilizes after 6 months of life (McCulloch and Skarf 1991), but is similar to the trend observed in flash VEP (Dockstader et al. 2012). In addition, this age trend is coincident with the white matter maturation trend revealed in diffuse-tensor MRI studies (Bashat et al. 2007). It has been reported that children with an ASD have accelerated white matter maturation before 4 years of age (Bashat et al. 2007; Weinstein et al. 2011), but this trend is reversed after 4 years of age (Vissers et al. 2012). This appears to be consistent with our observation on PLR latency (Fig. 2).
We also observed a significant age effect on HRV parameters which has been widely reported previously (Massin and von Bernuth 1997; Silvetti et al. 2001). The average heart rate is known to decrease with age, and time-domain HRVs (SDNN and rMSSD) were reported to increase with age (Silvetti et al. 2001). Massin and von Bernuth (1997) showed that HRV parameters changed rapidly during the first few years of life and eventually stabilized at older ages (6–15 years). Such age effects on HRV were generally attributed to the progressive maturation of the ANS (Silvetti et al. 2001). Our results suggested that the age effect on HRV was similar in the TD and ASD groups (Fig. 3), which is in sharp contrast to the different age profiles observed in PLR latency (Fig. 2).
The ASD group showed a faster average heart rate than that of the typically developing controls, which is similar to previous findings (Palkovitz and Wiesenfeld 1980; Kootz and Cohen 1981; Ming et al. 2005; Bal et al. 2010). The faster average heart rate suggests an increased sympathetic tone or/and impaired parasympathetic control in children with an ASD. The study by Levy (1990) suggested that resting heart rate is predominantly controlled by vagal modulation. The ASD group also had smaller PLR constriction amplitude, indicating lower parasympathetic modulation (Barbur 2003; Clarke 2007). A previous cardiovascular study showed that children with an ASD had lower parasympathetic activity (Ming et al. 2005). Interestingly, a statistically significant negative correlation existed between PLR constriction and average heart rate in the ASD group but not in the typically developing children. This observed correlation may indicate possible parasympathetic dysregulation associated with ASD. Significant correlations between PLR and HRV parameters were also previously reported in adults with acute schizophrenia (Bär et al. 2008), but an unequivocal correlation was not found in healthy adults (Bär et al. 2009) or healthy children (Daluwatte et al. 2012).
Frequency-domain HRV parameters appeared to change significantly when transiting between the rest and test phases in both the ASD and TD groups. Specifically, the HFN decreased during transition from a resting phase to a PLR test phase (1 to 2 and 3 to 4) and increased during transition from a testing phase to a resting phase (2 to 3 and 4 to 5). The LF/HF showed a reversed trend. This observation is similar to the previously reported posture-induced HRV changes associated with orthostatic stress (Mukai and Hayano 1995; Montano et al. 1994; Yeragani et al. 1993). The PLR test requires the participant to incline slightly forward (~15°), and this posture change can cause elevation in sympathetic tone due to muscle stress. Delaney and Brodie (2000) reported that psychological stress can increase low-frequency HRV while decreasing high-frequency HRV. Nevertheless, the observation of significantly smaller PLR test-related HRV changes in the ASD group suggested less variability in vagal and sympathetic modulation in this population. This is similar to the results reported by Toichi and Kamio (2003), who found that typical controls showed a significant decrease in cardiac autonomic function during a mental arithmetic task while the ASD group did not show significant changes. The observation in the ASD group was not caused by medication because the conclusion remained the same with only the “w/o med” ASD group used in the data analysis.
The current results did not support a significant IQ effect on PLR parameters. The apparent IQ effect on PLR latency was complicated by the medication effects. The analysis of the interaction between IQ and medication supported the notion that IQ alone does not have a significant effect on PLR latency. In the “w/o med” ASD group, where the medication effect was excluded, those in the “High IQ” group showed similar latencies as those in the “Low IQ” group. Medication effect was not observed in the “High IQ” group; however, in the “Low IQ” ASD group, latency tended to be greater in children using medication than in those not using medication. Children in the “Low IQ” group may have required medications for their severe symptoms. In other words, the observed longer PLR latency in this group of participants (“Low IQ” and “w/med”) may have been associated with their symptoms rather than with medication. Similar effect of IQ and medication interaction was not observed in other PLR and HRV parameters. A trend of medication effects was observed in the results especially on average heart rate and time-domain HRV parameters. However, the difference between “w/o med” and “w/med” ASD groups did not reach statistical significance. Most of the children in the “w/med group” were taking multiple medications, which made it difficult to clarify the effect of individual medication. This observation requires further investigation.
The discrimination analysis results reported herein were not as robust as those reported byFan et al. (2009a); this was mostly likely due to the increased sample size and the heterogeneity therein. The different age trends in the ASD and TD groups strongly suggested that age should be considered when interpreting PLR measurements. Despite the low number of participants in the non-ASD NDD group, our results indicated that the NDD group had similar PLR and HRV parameters as those of the ASD group. Therefore, the observed atypical PLR parameters were not specific to ASD. In other words, the same dysfunctions involved in the PLR pathway are mostly likely implicated in both ASD and other neurodevelopmental disorders.
Conclusion
We measured PLR and HRV simultaneously in a large heterogeneous group of children with an ASD, age-matched typically developing children, and children with an NDD other than an ASD. Children with an ASD or NDD showed atypical PLR, including greater latency, less constriction amplitude, and shorter constriction/redilation times. We also found a significant age effect in children with typical development that was not observed in children with an ASD; this may be due to altered brain development associated with ASD. Furthermore, we found a correlation between PLR and HRV parameters in the ASD group; this correlation was absent in children with typical development. These findings, in addition to atypical PLR profiles, suggest that an abnormality in the ANS is associated with ASD. The similar atypical PLR observed in ASD and NDD indicates that PLR differences are implicated in a wide range of neurodevelopmental disorders. As a simple and economic neurological test, PLR may be potentially useful for early screening of neurodevelopmental disorders in children.
Acknowledgments
This study was made possible by research grant support from National Institute of Neurological Disorders and Stroke (1R21NS070299-01) for tests in 200 participants and U. S. Army Medical Research Materiel Command (DoD W81XWH-10-1-0474) for tests in 100 additional participants. We thank Jill Akers, Andrew Lofgreen and Nathan Berliner for their help in participant recruitment and image processing. We also thank all the study participants and their families for their support of this research project.
References
- American Psychiatric Association. Diagnostic and statistical manual of mental disorders 4th Edition Text Revision. Washington, DC: American Psychiatric Association; 2000. [Google Scholar]
- Anderson CJ, Colombo J. Larger tonic pupil size in young children with autism spectrum disorder. Developmental Psychobiology. 2009;51:207–211. doi: 10.1002/dev.20352. [DOI] [PMC free article] [PubMed] [Google Scholar]
- Anderson C, Colombo J, Shaddy DJ. Visual scanning and pupillary responses in young children with Autism Spectrum Disorder. Journal of Clinical and Experimental Neuropsychology. 2006;28:1238–1256. doi: 10.1080/13803390500376790. [DOI] [PubMed] [Google Scholar]
- Anderson C, Colombo J, Shaddy DJ. Pupil and salivary indicators of autonomic dysfunction in autism spectrum disorder. Developmental Psychobiology. doi: 10.1002/dev.21051. (in press) [DOI] [PMC free article] [PubMed] [Google Scholar]
- Appenzeller O. The Autonomic Nervous System Part I. Normal Functions. Elsevier; 1999. [Google Scholar]
- Bal E, Harden E, Lamb D, Vaughan Van Hecke A, Denver JW, Porges SW. Emotion recognition in children with autism spectrum disorders: Relations to eye gaze and autonomic state. Journal of Autism and Developmental Disorders. 2010;40:358–370. doi: 10.1007/s10803-009-0884-3. [DOI] [PubMed] [Google Scholar]
- Bär KJ, Boettger MK, Koschke M, Schulz S, Chokka P, Yeragani VK, Voss A. Non-linear complexity measures of heart rate variability in acute schizophrenia. Clinical Neurophysiology. 2007;118:2009–2015. doi: 10.1016/j.clinph.2007.06.012. [DOI] [PubMed] [Google Scholar]
- Bär KJ, Boettger MK, Schulz S, Harzendorf C, Agelink MW, Yeragani VK, Chokka P, Voss A. The interaction between pupil function and cardiovascular regulation in patients with acute schizophrenia. Clinical Neurophysiology. 2008;119:2209–2213. doi: 10.1016/j.clinph.2008.06.012. [DOI] [PubMed] [Google Scholar]
- Bär KJ, Schulz S, Koschke M, Harzendorf C, Gayde S, Berg W, Voss A, Yeragani VK, Boettger MK. Correlations between the autonomic modulation of heart rate, blood pressure and the pupillary light reflex in healthy subjects. Journal of the Neurological Sciences. 2009;279:9–13. doi: 10.1016/j.jns.2009.01.010. [DOI] [PubMed] [Google Scholar]
- Barbur JL. Learning from the pupil. In: Werner LM, C JS, editors. The Visual Neurosciences. Cambridge, MA: MIT Press; 2003. [Google Scholar]
- Bashat DB, Kronfeld-Duenias V, Zachor DA, Ekstein PM, Hendler T, Tarrasch R, Even A, Levy Y, Ben Sira L. Accelerated maturation of white matter in young children with autism: A high b value DWI study. NeuroImage. 2007;37:40–47. doi: 10.1016/j.neuroimage.2007.04.060. [DOI] [PubMed] [Google Scholar]
- Berntson GG, Thomas Bigger J, Jr, Eckberg DL, Grossman P, Kaufmann PG, Malik M, Nagaraja HN, Porges SW, Saul JP, Stone PH, Van Der Molen MW. Heart rate variability: Origins methods, and interpretive caveats. Psychophysiology. 1997;34:623–648. doi: 10.1111/j.1469-8986.1997.tb02140.x. [DOI] [PubMed] [Google Scholar]
- Bonnet MH, Arand DL. Heart rate variability in insomniacs and matched normal sleepers. Psychosomatic Medicine. 1998;60:610–615. doi: 10.1097/00006842-199809000-00017. [DOI] [PubMed] [Google Scholar]
- Bremner F. Pupil evaluation as a test for autonomic disorders. Clinical Autonomic Research. 2009;19:88–101. doi: 10.1007/s10286-009-0515-2. [DOI] [PubMed] [Google Scholar]
- Clarke RJ. Shaping the pupil's response to light in the hooded rat. Experimental Brain Research. 2007;176:641–651. doi: 10.1007/s00221-006-0649-6. [DOI] [PubMed] [Google Scholar]
- Constantino JN, Gruber CP. The social responsiveness scale (SRS) manual. Los Angeles: Western Psychological Services; 2005. [Google Scholar]
- Daluwatte C, Miles JH, Yao G. Simultaneously measured pupillary light reflex and heart rate variability in healthy children. Physiological Measurement. 2012;33:1043–1052. doi: 10.1088/0967-3334/33/6/1043. [DOI] [PMC free article] [PubMed] [Google Scholar]
- Delaney JPA, Brodie DA. Effects of short-term psychological stress on the time and frequency domains of heart-rate variability. Perceptual and Motor Skills. 2000;91:515–524. doi: 10.2466/pms.2000.91.2.515. [DOI] [PubMed] [Google Scholar]
- Dockstader C, Gaetz W, Rockel C, Mabbott DJ. White matter maturation in visual and motor areas predicts the latency of visual activation in children. Human Brain Mapping. 2012;33:179–191. doi: 10.1002/hbm.21203. [DOI] [PMC free article] [PubMed] [Google Scholar]
- Eaves LC, Wingert HD, Ho HH, Mickelson ECR. Screening for autism spectrum disorders with the social communication questionnaire. Journal of Developmental and Behavioral Pediatrics. 2006;27:S95–S103. doi: 10.1097/00004703-200604002-00007. [DOI] [PubMed] [Google Scholar]
- Fan X, Miles JH, Takahashi N, Yao G. Abnormal transient pupillary light reflex in individuals with autism spectrum disorders. Journal of Autism and Developmental Disorders. 2009a;39:1499–1508. doi: 10.1007/s10803-009-0767-7. [DOI] [PubMed] [Google Scholar]
- Fan X, Miles JH, Takahashi N, Yao G. Sex-specific lateralization of contraction anisocoria in transient pupillary light reflex. Investigative Ophthalmology and Visual Science. 2009b;50:1137–1144. doi: 10.1167/iovs.08-2329. [DOI] [PubMed] [Google Scholar]
- Gamelin FX, Baquet G, Berthoin S, Bosquet L. Validity of the polar S810 to measure R-R intervals in children. International Journal of Sports Medicine. 2008;29:134–138. doi: 10.1055/s-2007-964995. [DOI] [PubMed] [Google Scholar]
- Geschwind DH, Levitt P. Autism spectrum disorders: developmental disconnection syndromes. Current Opinion in Neurobiology. 2007;17:103–111. doi: 10.1016/j.conb.2007.01.009. [DOI] [PubMed] [Google Scholar]
- Goodie JL, Larkin KT, Schauss S. Validation of the Polar heart rate monitor for assessing heart rate during physical and mental stress. Journal of Psychophysiology. 2000;14:159–164. [Google Scholar]
- Kamath MV, Fallen EL. Power spectral analysis of heart rate variability: A noninvasive signature of cardiac autonomic function. Critical Reviews in Biomedical Engineering. 1993;21:245–311. [PubMed] [Google Scholar]
- Kootz JP, Cohen DJ. Modulation of sensory intake in autistic children: cardiovascular and behavioral indices. Journal of the American Academy of Child Psychiatry. 1981;20:692–701. doi: 10.1097/00004583-198102000-00002. [DOI] [PubMed] [Google Scholar]
- Laeng B, Sirois S, Gredeback G. Pupillometry: A Window to the Preconscious? Perspective on Psychological Science. 2012;7:18–27. doi: 10.1177/1745691611427305. [DOI] [PubMed] [Google Scholar]
- Levy MN. Autonomic interactions in cardiac control. Annals of the New York Academy of Sciences. 1990;601:209–221. doi: 10.1111/j.1749-6632.1990.tb37302.x. [DOI] [PubMed] [Google Scholar]
- Lord C, Rutter M, Goode S, Heemsbergen J, Jordan H, Mawhood L, Schopler E. Autism diagnostic observation schedule: A standardized observation of communicative and social behavior. Journal of Autism and Developmental Disorders. 1989;19:185–212. doi: 10.1007/BF02211841. [DOI] [PubMed] [Google Scholar]
- Lord C, Rutter M, Couteur AL. Autism diagnostic interview-revised: A revised version of a diagnostic interview for caregivers of individuals with possible pervasive developmental disorders. Journal of Autism and Developmental Disorders. 1994;24:659–685. doi: 10.1007/BF02172145. [DOI] [PubMed] [Google Scholar]
- Loewenfeld IE. The pupil: anatomy, physiology, and clinical applications. Detroit: Wayne State University Press; 1999. [Google Scholar]
- Lowenstein O, Loewenfeld IE. Mutual role of sympathetic and parasympathetic in shaping of the pupillary reflex to light; pupillographic studies. Archives of neurology and psychiatry. 1950;64:341–377. doi: 10.1001/archneurpsyc.1950.02310270030002. [DOI] [PubMed] [Google Scholar]
- Malik M. Heart rate variability: Standards of measurement, physiological interpretation, and clinical use. Circulation. 1996;93:1043–1065. [PubMed] [Google Scholar]
- Martineau J, Hernandeza N, Hiebelb L, Rochéa L, Metzgerb A, Bonnet-Brilhaulta F. Can pupil size and pupil responses during visual scanning contribute to the diagnosis of autism spectrum disorder in children? Journal of Psychiatric Research. 2011;45:1077–1082. doi: 10.1016/j.jpsychires.2011.01.008. [DOI] [PubMed] [Google Scholar]
- Massin M, von Bernuth G. Normal ranges of heart rate variability during infancy and childhood. Pediatric Cardiology. 1997;18:297–302. doi: 10.1007/s002469900178. [DOI] [PubMed] [Google Scholar]
- Mathewson KJ, Drmic IE, Jetha MK, Bryson SE, Goldberg JO, Hall GB, Santesso DL, Segalowitz SJ, Schmidt LA. Behavioral and cardiac responses to emotional stroop in adults with autism spectrum disorders: Influence of medication. Autism Research. 2011;4:98–108. doi: 10.1002/aur.176. [DOI] [PubMed] [Google Scholar]
- McCulloch DL, Skarf B. Development of the human visual system: Monocular and binocular pattern VEP latency. Investigative Ophthalmology and Visual Science. 1991;32:2372–2381. [PubMed] [Google Scholar]
- Ming X, Bain JM, Smith D, Brimacombe M, Gold Von-Simson G, Axelrod FB. Assessing autonomic dysfunction symptoms in children: A pilot study. Journal of Child Neurology. 2011;26:420–427. doi: 10.1177/0883073810381921. [DOI] [PubMed] [Google Scholar]
- Ming X, Julu POO, Brimacombe M, Connor S, Daniels ML. Reduced cardiac parasympathetic activity in children with autism. Brain and Development. 2005;27:509–516. doi: 10.1016/j.braindev.2005.01.003. [DOI] [PubMed] [Google Scholar]
- Montano N, Ruscone T, Porta A, Lombardi F, Pagani M, Malliani A. Power spectrum analysis of heart rate variability to assess the changes in sympathovagal balance during graded orthostatic tilt. Circulation. 1994;90:1826–1831. doi: 10.1161/01.cir.90.4.1826. [DOI] [PubMed] [Google Scholar]
- Mukai S, Hayano J. Heart rate and blood pressure variabilities during graded head-up tilt. Journal of Applied Physiology. 1995;78:212–216. doi: 10.1152/jappl.1995.78.1.212. [DOI] [PubMed] [Google Scholar]
- Neuhuber W, Schrödl F. Autonomic control of the eye and the iris. Autonomic Neuroscience: Basic and Clinical. 2011;165:67–79. doi: 10.1016/j.autneu.2010.10.004. [DOI] [PubMed] [Google Scholar]
- Nunan D, Gay D, Jakovljevic DG, Hodges LD, Sandercock GRH, Brodie DA. Validity and reliability of short-term heart-rate variability from the Polar S810. Medicine and Science in Sports and Exercise. 2009;41:243–250. doi: 10.1249/MSS.0b013e318184a4b1. [DOI] [PubMed] [Google Scholar]
- Palkovitz RJ, Wiesenfeld AR. Differential autonomic responses of autistic and normal children. Journal of Autism and Developmental Disorders. 1980;10:347–360. doi: 10.1007/BF02408294. [DOI] [PubMed] [Google Scholar]
- Porto LGG, Junqueira LF., Jr Comparison of time-domain short-term heart interval variability analysis using a wrist-worn heart rate monitor and the conventional electrocardiogram. PACE - Pacing and Clinical Electrophysiology. 2009;32:43–51. doi: 10.1111/j.1540-8159.2009.02175.x. [DOI] [PubMed] [Google Scholar]
- Raven J, Raven JC, Court JH. Manual for Raven's Progressive Matrices and Vocabulary Scales. Oxford: Oxford Psychologists Press; 1996. [Google Scholar]
- Rubin LS. Patterns of pupillary dilatation and constriction in psychotic adults and autistic children. The Journal of nervous and mental disease. 1961;133:130–142. doi: 10.1097/00005053-196108000-00009. [DOI] [PubMed] [Google Scholar]
- Silvetti MS, Drago F, Ragonese P. Heart rate variability in healthy children and adolescents is partially related to age and gender. International Journal of Cardiology. 2001;81:169–174. doi: 10.1016/s0167-5273(01)00537-x. [DOI] [PubMed] [Google Scholar]
- Steyn HS, Ellis SM. Estimating an effect size in one-way multivariate analysis of variance (MANOVA) Multivariate Behavioral Research. 2009;44:106–129. doi: 10.1080/00273170802620238. [DOI] [PubMed] [Google Scholar]
- Thayer JF, Sternberg E. Beyond heart rate variability: Vagal regulation of allostatic systems. Annals of the New York Academy of Sciences. 2006;1088:361–372. doi: 10.1196/annals.1366.014. [DOI] [PubMed] [Google Scholar]
- Toichi M, Kamio Y. Paradoxical autonomic response to mental tasks in autism. Journal of Autism and Developmental Disorders. 2003;33:417–426. doi: 10.1023/a:1025062812374. [DOI] [PubMed] [Google Scholar]
- van Engeland H, Roelofs JW, Verbaten MN, Slangen JL. Abnormal electrodermal reactivity to novel visual stimuli in autistic children. Psychiatry Research. 1991;38:27–38. doi: 10.1016/0165-1781(91)90050-y. [DOI] [PubMed] [Google Scholar]
- Vissers ME, X Cohen M, Geurts HM. Brain connectivity and high functioning autism: A promising path of research that needs refined models, methodological convergence, and stronger behavioral links. Neuroscience and Biobehavioral Reviews. 2012;36:604–625. doi: 10.1016/j.neubiorev.2011.09.003. [DOI] [PubMed] [Google Scholar]
- Wagner JB, Hirsch SB, Vogel-Farley VK, Redcay E, Nelson CA. Eyetracking, autonomic, and electrophysiological correlates of emotional face processing in adolescents with autism spectrum disorder. Journal of Autism and Developmental Disorders. doi: 10.1007/s10803-012-1565-1. (in press) [DOI] [PMC free article] [PubMed] [Google Scholar]
- Wechsler D. Wechsler Intelligence Scale for Children Third Edition Manual. New York: The Psychological Corporation; 1991. [Google Scholar]
- Weinstein M, Ben-Sira L, Levy Y, Zachor DA, Itzhak EB, Artzi M, Tarrasch R, Eksteine PM, Hendler T, Bashat DB. Abnormal white matter integrity in young children with autism. Human Brain Mapping. 2011;32:534–543. doi: 10.1002/hbm.21042. [DOI] [PMC free article] [PubMed] [Google Scholar]
- Yeragani VK, Pohl R, Berger R, Balon R, Ramesh C, Glitz D, Srinivasan K, Weinberg P. Decreased heart rate variability in panic disorder patients: A study of power-spectral analysis of heart rate. Psychiatry Research. 1993;46:89–103. doi: 10.1016/0165-1781(93)90011-5. [DOI] [PubMed] [Google Scholar]


