

Abstract
Recent genome-wide maps of nucleosome positions in different eukaryotes revealed patterns around transcription start sites featuring a nucleosome-free region flanked by a periodic modulation of the nucleosome density. For Saccharomyces cerevisiae, the average in vivo pattern was previously shown to be quantitatively described by a “nucleosome gas” model based on the statistical positioning mechanism. However, this simple physical description is challenged by the fact that the pattern differs quantitatively between species and by recent experiments that appear incompatible with statistical positioning, indicating important roles for chromatin remodelers. We undertake a data-driven search for a unified physical model to describe the nucleosome patterns of 12 yeast species and also consider an extension of the model to capture remodeling effects. We are led to a nucleosome gas that takes into account nucleosome breathing, i.e., transient unwrapping of nucleosomal DNA segments. This known biophysical property of nucleosomes rationalizes a “pressure”-induced dependence of the effective nucleosome size that is suggested by the data. By fitting this model to the data, we find an average energy cost for DNA unwrapping consistent with previous biophysical experiments. Although the available data are not sufficient to reconstruct chromatin remodeling mechanisms, a minimal model extension by one mechanism yields an “active nucleosome gas” that can rationalize the behavior of systems with reduced histone–DNA ratio and remodeler knockouts. We therefore establish a basis for a physical description of nucleosome patterns that can serve as a null model for sequence-specific effects at individual genes and in models of transcription regulation.
Keywords: nucleosome maps, chromatin structure, quantitative biology
Chromatin is a highly dynamic object and the substrate for molecular processes such as transcription, gene regulation, and DNA replication. Finding adequate model representations for chromatin is challenging, because static structural models are insufficient, and the data required to construct molecular-scale chromatin movies are not within reach. However, conformation-capturing techniques combining biochemical cross-linking and whole-genome mapping provide intriguing statistical information about chromatin conformations. Proximity-based cross-linking of different DNA loci probes the large-scale conformations of chromosomes (1), whereas histone–DNA cross-linking probes conformations on the scale of the 10-nm chromatin fiber (2–5). Such experiments collect a large number of molecular interactions from a population of cells, thereby taking samples from the underlying conformational probability distributions. Hence, these methods inherently lead to a statistical representation of chromatin, which does not explicitly describe the dynamics but instead describes the resulting conformational distribution. A key challenge then is to identify biophysical models that are consistent with the observed conformational distribution.
Here, we consider this question for the statistical distribution of nucleosomes along the DNA. Genome-wide nucleosome-mapping experiments yield a robust pattern upon averaging over a large set of genes aligned at the transcription start site (2–5). It displays a “nucleosome-free region” (NFR), roughly 200 bp wide, and an oscillatory flanking pattern in the direction of transcription. A pattern of this qualitative form has been identified in several multicellular organisms, but is best studied in yeasts (6). The NFRs are likely functionally important, because they affect the access to DNA target sites for factors that regulate and initiate transcription (3–5). Our focus here is on the flanking pattern, a periodic modulation of the nucleosome density, with each peak corresponding to a single nucleosome and an amplitude that decays with distance from the NFR. The average over genes removes gene-specific features and exposes generic physical properties of the 10-nm fiber (7, 8). For the yeast Saccharomyces cerevisiae, it was shown (8) that realignment of the genes by their +1 nucleosome (first nucleosome downstream of the NFR) yields a pattern that is quantitatively compatible with that of the barrier nucleosome model (9) based on the “statistical positioning” mechanism (10). Moreover, realigning the genes by their −1 nucleosome (first nucleosome upstream of the NFR) also revealed an upstream oscillatory pattern, which is compatible with that of the same quantitative model.
However, this simple physical interpretation of the pattern is challenged by two sets of experimental observations: First, the quantitative characteristics of the in vivo pattern vary considerably from species to species, even within a set of yeast species (6), raising the question of whether this variation can indeed be understood in simple physical terms. The general physical framework [within which the Kornberg–Stryer model (10) constitutes a special case] is that of one-dimensional (1D) gas systems, consisting of interacting particles confined to a line (11, 12). Within this framework, is there a single model that consistently explains all patterns? Second, recent experiments have shown in vitro (13) and in vivo (14) that the formation of the native nucleosome pattern requires the action of remodeling enzymes. Moreover, reduction of the histone–DNA ratio in vitro (13) or in vivo (15) does not lead to a concomitant increase in the typical nucleosome spacing, as would be expected for statistical positioning. Do these observations invalidate the entire 1D gas framework or just the specific Kornberg–Stryer model?
Here, we address these questions, using a data-driven approach, based on whole-genome nucleosome maps for 12 yeast species (6) (Fig. 1). We find that the species-to-species variation of the patterns cannot be naturally explained within the Kornberg–Stryer model. In particular, it cannot rationalize a conspicuous trend in the data: The effective width of the nucleosome core particle decreases as the mean nucleosome density increases. This observation leads us to an extension of the model that takes into account nucleosome breathing (16–20), the spontaneous transient unwrapping of nucleosomal DNA from either end of the fully wrapped nucleosome “ground state” represented by the crystal structure (21). This “soft-core” nucleosome gas model has a crucial new biophysical parameter, the mean energy ε per base pair required to unwrap nucleosomal DNA. It rationalizes the density dependence of the effective nucleosome width as pressure-induced transient unwrapping of nucleosomes. This explanation does not require rapid equilibration of nucleosome positions within single cells, because the data provide snapshots of independent configurations from many cells. Interestingly, the value for the unwrapping energy ε that we infer from the in vivo nucleosome maps agrees with the range of values obtained from biophysical experiments with single-nucleosome core particles. We also show that the soft-core nucleosome gas model can be reconciled with the recent experiments (13–15) probing the dependence on the histone–DNA ratio and the role of remodelers: Adding a dinucleosome-remodeling mechanism to the model does not significantly affect the native in vivo pattern, but renders the typical nucleosome spacing insensitive to the histone–DNA ratio.
Fig. 1.

Average nucleosome density patterns downstream from the +1 nucleosome for 12 yeast species, based on the data of ref. 6. To estimate the physical nucleosome density and enable direct comparison across species, the raw data are normalized by an estimated sequencing depth; see SI Appendix for details. To facilitate comparison, the patterns are smoothed by a running average over 11 bp.
Model
Our analysis is based on the working hypothesis that nucleosome arrangements in the 10-nm chromatin fiber can be appropriately described, on a coarse-grained physical level, within the theory of 1D interacting gas systems (12). This description projects the complex molecular interactions among DNA and histones in 3D onto a 1D configurational space. Here, we assume a free energy function of the form
 |
which assigns an energy value to a collection of nucleosome positions {xj}. Each xj is the position of a nucleosome dyad along the DNA and nucleosomes are indexed by order on the DNA (x1 < x2 < … <xN). The total number of nucleosomes, N, is not fixed, but may vary from cell to cell and in time. The potential u(x), which acts on each nucleosome individually, is a genomic free energy landscape subsuming cis and trans effects biasing nucleosome positions (3). The pair interaction v(x) describes the steric exclusion of nucleosomes as well as other mutual interactions. In Eq. 1, we have restricted v(x) to neighboring nucleosomes. (Additional longer-range interactions due to higher-order chromatin structure are likely, but their effect on the nucleosome patterns appears to be minor, because we find below that a nearest-neighbor–based interaction already describes the available data well.) The Kornberg–Stryer model, which corresponds to the Tonks gas in physics (11), is obtained when v(x) describes a perfect steric repulsion, i.e., v(x) = ∞ for x < b and v(x) = 0 otherwise (with b ∼ 147 bp), whereas the energy landscape is flat, u(x) = 0, except at isolated “barrier” positions on the genome where u(x) takes on large positive values.
Although the standard theory of 1D interacting gas systems deals with equilibrium systems (12), it is clear that due to the action of various active remodelers, chromatin is an active system. In general, a single energy function of the type Eq. 1 will therefore not suffice to correctly describe the nucleosome distribution at different histone-DNA ratios. Instead, active mechanisms, each characterized by a ‘move’ within the space of nucleosome configurations and an associated kinetic rate, then need to be added on top of the equilibrium model (22). For active and equilibrium systems alike, the experimentally relevant observable is the local nucleosome density
 |
i.e., the probability of finding a nucleosome positioned at x. For the experimental data, the angular brackets〈…〉denote an average over different cells, whereas the average is over the appropriate statistical ensemble in the theoretical model (the grand-canonical ensemble for equilibrium systems and the ensemble of steady-state configurations for active systems).
An important general property of dense 1D interacting gas systems is that local perturbations can produce longer-range effects. Specifically, a local peak in the potential landscape u(x), repulsive or attractive, can trigger an oscillation in ρ(x) over a range of many nucleosomes, due to a statistical “domino effect,” where the positioning of a nucleosome constrains its neighbor and the latter its neighbor in turn. In physical terms, oscillatory behavior of ρ(x) results from the interplay of entropy and steric repulsion: Because the same DNA position cannot simultaneously be incorporated into two nucleosomes, the nucleosome footprints on the DNA exclude each other, whereas a large gap between neighboring nucleosomes reduces the configurational space for the remaining nucleosomes and is therefore entropically unfavorable. For S. cerevisiae, a parsimonious explanation of the experimental ρ(x) in the vicinity of transcription start sites (TSS) assumes an asymmetrically shaped potential u(x), where the +1 nucleosome is directly positioned with a localized attractive peak (negative potential), whereas the −1 and upstream nucleosomes are statistically positioned by a repulsive potential within the NFR (8). Because the experimental pattern results from an alignment and average over a large set of genes, this shape of u(x) appears to be common to most genes. Additionally, there may well be other features in the genomic u(x) landscape, e.g., also within the coding regions, which vary from gene to gene such that they do not significantly affect the average pattern.
The precise form of the oscillatory pattern depends on the shape of the peak in u(x) that defines the boundary condition for the pattern (8). One can infer the most likely local shape of u(x) that positions the +1 nucleosome from the experimental shape of the +1 peak in the average density. [For simplicity, in our calculations reported below, we take this boundary effect into account via a convolution of the idealized theoretical pattern for a sharply peaked  with the shape of the experimental +1 peak (SI Appendix).] In the following, we use the term hard-core nucleosome gas (HNG) model to refer to the Kornberg–Stryer–Tonks model supplemented by this boundary condition (“HNG” is chosen in contrast to the soft-core model introduced in Soft-Core Nucleosome Gas Model below). By the logic of Occam’s razor, we seek to identify the simplest and most plausible combination of an energy function, Eq. 1, and active mechanism(s) that can rationalize the nucleosome patterns from different species and in vitro experiments.
Results
Quantitative Data Analysis.
Fig. 1 shows the average nucleosome pattern flanking the NFR on the downstream side, for each of the 12 different yeast species of ref. 6. Here, instead of aligning at the TSS, we used the most likely +1 nucleosome position at each gene as an alignment point (SI Appendix). In terms of the physical model, the +1 nucleosome is our reference particle, whereas the TSS cannot be mapped to a physical feature (8). All of the patterns in Fig. 1 have the same qualitative shape, a decaying oscillation, but the quantitative characteristics differ significantly (6). To test whether these differences are due to variation of gene expression level or gene length, we used the data of ref. 6 to compare, for each species, the patterns of genes with high and low expression levels and the pattern of the long genes with the average over all genes (SI Appendix, Figs. S1B–S12B). This reveals two trends: (i) Genes with high expression levels display a pattern that appears “compressed”; i.e., nucleosomes have a smaller spacing than for low expression levels. (ii) Longer genes display a more pronounced pattern, i.e., larger peak amplitudes at equal spacing. Although these trends are consistent with previous observations (3–5), both effects are relatively small compared with the species-to-species differences.
To test whether the HNG model can rationalize the different patterns, we fitted it using the average nucleosome density  as an adjustable parameter. Because
  controls the peak-to-peak distances in the pattern and it is well known that the average nucleosome spacing in coding regions is variable between yeast species (6, 23), a species-to-species variation in
  might already explain the observed patterns. We recovered the previous finding that the HNG model describes the S. cerevisiae pattern relatively well (8), as quantified by the mean-square deviation, δ2. However, the fit was poor for some of the other species, especially Kluyveromyces waltii, Kluyveromyces lactis, and Debaryomyces hansenii (SI Appendix, section IV and Figs. S1A –S12A and S13).
To elucidate this failure of the HNG model, we allowed the effective DNA footprint size of nucleosomes to be adjustable as well (b was previously fixed at 147 bp). With the additional parameter, we obtained good fits for all patterns; see Fig. 2A for an example and SI Appendix for complete results. As shown in Fig. 2B, these fits yield a range of parameter values, with average repeat lengths  between 163 and 182 bp and effective DNA footprint lengths b from 138 to 158 bp. Given that the nucleosome structure has a well-defined 146- to 147-bp length of nucleosomal DNA (21) and the histone sequences are highly conserved, the large spread in b indicates that the model does not fully capture the physical behavior of the 10-nm chromatin fiber. Indeed, Fig. 2B shows that the two fitted parameters are not independent (correlation coefficient r = 0.82), suggesting that the model misses an essential property of the system. Additional analysis (SI Appendix) confirms that this correlation is not an experimental or a computational artifact.
Fig. 2.

(A) Overlay of the C. albicans pattern (gray dots) with its best HNG model fit, where particle size b and mean density  are independently varied. (B) Parameter pairs
  of the best HNG model for each species (circles). The nucleosome width b displays a positive correlation with the average repeat length
  (Pearson’s correlation coefficient r = 0.82 for all species and 0.78 for all but K. lactis). The dashed line is a linear fit to all data. (C) Similar to A, but with the unified SNG model, where only
  is independently fitted for each species.
One biophysical property neglected by the HNG model is the dynamic nature of the nucleosome structure: It is well known that the ends of nucleosomal DNA transiently unwrap from the histone core driven by thermal fluctuations (16, 18–20), even in the chromatin context (17). This “nucleosome breathing” reduces the average histone-bound DNA length in a nucleosome below that in the crystal structure. Importantly, physical reasoning suggests that the size of this reduction should depend on the nucleosome density: A high density corresponds to a large effective “pressure” of the nucleosome “gas”, which induces more unwrapping. This intuitive picture is indeed applicable even when the dynamics of nucleosome sliding along the DNA are slow, because (i) the experimental patterns are generated from many “snapshots” of nucleosome configurations in different cells and (ii) the picture depends only on the equilibrium statistics, not the dynamics, of the system, with the unwrapping resulting from an energy–entropy trade-off (see below).
Soft-Core Nucleosome Gas Model.
To test whether this physical effect can quantitatively explain the data, we devised a “soft-core nucleosome gas” (SNG) model, which accounts for nucleosome breathing. In the SNG model, nucleosomes have two internal degrees of freedom corresponding to the amount of unwrapped DNA on each side of the dyad (Fig. 3A). Unwrapping has a free energy cost ε > 0. Consequently, two adjacent nucleosomes at a given distance Δx = xi+1 − xi between the dyads can be in a number of different internal states, as illustrated in Fig. 3B. Without any unwrapping, they cannot be closer than a certain minimal distance a. For Δx < a, at least a − Δx bp must unwrap, which can be split between the left and the right particle. A priori, we expect that a is larger than 147 bp, because a configuration without unbound (linker) DNA between two nucleosomes is difficult to achieve given the steric constraints of chromatin. After summing over the internal states, which are not observed in the experiments, we obtain an interaction free energy for neighboring nucleosomes at distance Δx ≤ a,
whereas v(Δx) remains 0 for Δx > a. The first term of this “soft-core potential” is enthalpic, whereas the second term is entropic, accounting for the different internal states. Eq. 3 is an approximate expression valid for Δx ≫ 1 bp (SI Appendix). Fig. 3C displays both the exact and the approximative v(Δx) with representative parameter values. Within the general theory of 1D gas models, our SNG model falls into the class of “Takahashi nearest-neighbor gases” (12). All of its statistical properties can be calculated exactly, using standard techniques from statistical physics. Conceptually similar models were considered by Chou (24) and Teif et al. (25). Lubliner and Segal showed that taking into account interactions between adjacent nucleosomes can improve DNA sequence-based prediction of nucleosome occupancy (26).
Fig. 3.

Soft-core nucleosome gas (SNG) model. (A) A single soft-core particle has a maximal footprint a. DNA can unwrap from both ends, up to a maximum of w on either side of the dyad (marked by a vertical line). These “breathing” dynamics lead to a reduced typical footprint size (illustrated by shading). (B) Illustration of the different internal states of a nucleosome pair that contribute to the effective nucleosome–nucleosome interaction free energy v(Δx) at a given distance Δx between the dyads. (C) This interaction is plotted for our consensus parameter values (w = 83 bp, ε = 0.1525kBT/bp). The approximation of Eq. 3 (gray line) matches the exact form (red line) in the relevant regime of small free energy.
We first fitted the SNG model separately to each species, with the average nucleosome density  , the unwrapping energy ε, and the interaction range a as adjustable model parameters. The best-fit parameters and the fit quality are indicated with orange bars in Fig. 4, and the individual patterns are shown in SI Appendix, Figs. S1A–S12A. SI Appendix, Fig. S13 compares the fit qualities of all of the models considered so far: As expected, the SNG model shows a dramatic improvement over the restricted HNG model (fixed b). It describes the experimental patterns about equally as well as the HNG model with adjustable b. Importantly, the SNG model appears to correctly capture the physical behavior of the system: (i) The average repeat lengths
  determined from the SNG model agree well with the peak-to-peak distances in the experimental patterns, whereas the repeat lengths determined from the HNG model are significantly longer (SI Appendix, Tables S2 and S3). (ii) The inferred unwrapping energies ε are in excellent agreement with biochemical measurements of DNA unwrapping, which indicate a free energy cost of about 1.5 kBT for the unwrapping of 10 bp (27). (iii) The inferred interaction ranges a = 2w + 1 are roughly 20 bp larger than the DNA length of the nucleosome core particle. In other words, already before the DNA footprints of neighboring nucleosomes overlap, they experience a weak repulsive interaction. Physically, such a repulsion arises, e.g., from the geometrical constraints that reduce the conformational space of a nucleosome pair at short distances.
Fig. 4.
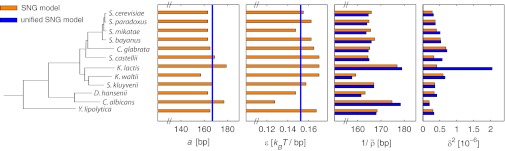
Bar graph of the parameter values for the species shown in the phylogeny as inferred from the independent (orange) and unified (blue) SNG models. The rightmost column shows the mean-square deviation δ2 between experimental and model patterns. For the unified SNG model, the interaction range a and binding energy ε are global parameters (inferred values indicated by vertical blue lines). The average repeat length  is a species-specific parameter in both cases. K. lactis is the only species displaying poor agreement with the unified model and was not included in the optimization of the global parameters.
So far, the SNG model appears to share with the HNG model the conceptual problem of species-specific histone properties despite the high degree of histone conservation: Not only the nucleosome spacings, but also the best-fit unwrapping energy and interaction range vary from species to species (Fig. 4). However, intuition suggests that larger particles with strong breathing can yield the same average particle size as smaller particles that breathe little; i.e., a decreased ε may be compensated for by an increased w. We therefore asked: Can the histone properties w and ε be constrained to be universal for all species without losing the quality of the description? This “unified SNG model” has a substantially reduced number of adjustable parameters for the description of all data compared with the SNG model or the HNG model with variable particle width, because only the average nucleosome density  remains as a species-specific physical parameter. When performing this constrained and simultaneous optimization, we found that the unified SNG model can describe the data almost equally as well as the SNG model itself, except for the case of K. lactis, which we excluded in this analysis (discussed below). We find a unified binding energy of ε = 0.1525 kBT/bp and a maximum wrapping length of w = 83 bp corresponding to a unified interaction range of a = 167 bp. The resulting
  -values and fit qualities δ2 are shown in Fig. 4 (blue bars) and the individual patterns as well as the comparison with the HNG models are in SI Appendix.
As speculated above, when moving from the SNG to the unified SNG model, an increase in ε is typically accompanied by a decrease in a and vice versa without a severe drop in fit quality. This trend is particularly clear in the case of K. waltii and Candida albicans. In contrast, K. lactis is abnormal in this respect, because the individually estimated values for ε and a are both exceptionally high, suggesting that nucleosomes in K. lactis breathe less or interact over a larger range than in other yeast species. Accordingly, the unified SNG model for the other 11 yeast species describes the K. lactis data poorly (Fig. 4 and SI Appendix). The abnormal behavior of K. lactis could have various mechanistic origins, as discussed below. Because the average nucleosome spacing generally shows a (weak) dependence on gene expression level, one possible origin could be related to gene expression. SI Appendix, Fig. S14 separately compares the patterns of genes with high and low expression levels between K. lactis and S. cerevisiae. Because K. lactis displays a larger spacing than S. cerevisiae at high and low expression levels alike, the abnormal behavior of K. lactis is unlikely related to gene expression.
Does the unified SNG model indeed display the pressure-induced unwrapping effect postulated above? To address this question, SI Appendix, Fig. S15 shows the effective footprint size aeff (ensemble average over all configurations) as a function of the inverse density  (average repeat length). Over the relevant range of
  , from 158 to 178 bp for the 11 species included in the unified model, aeff varies between 144 and 151 bp. Hence, we find pressure-induced unwrapping to be a relevant effect. As an aside, we note that spontaneous and pressure-induced unwrapping could also significantly contribute to the recently observed broad distribution of micrococcal nuclease-protected DNA sizes in paired-end sequencing studies (28) (in addition to the existence of other types of particles).
Although the SNG model yields a surprisingly accurate description of the different in vivo nucleosome patterns within the same physical model, it leaves open a number of important questions. An immediate question is why K. lactis does not fit into the unified model, especially because it is not at an extremity of the phylogenetic tree (Fig. 4). It was previously found that the nucleosome repeat length of K. lactis is 16 bp longer than that of S. cerevisiae (23), which was speculated to be due to an abundant use of the linker histone H1 in K. lactis. This would indeed explain a concomitant increase of average nucleosome spacing and apparent nucleosome width. Whereas the mRNA level of the H1 ortholog in K. lactis is similar to that of H1 in S. cerevisiae (6), a significant difference in H1 abundance could arise at the posttranscriptional level. Alternatively, the behavior of K. lactis could be rationalized by histone modifications that make DNA unwrapping energetically more costly and the apparent nucleosome width larger than in the other yeast species (Fig. 4).
Remodeling Enzymes.
We have seen that under in vivo conditions the nucleosomes effectively behave like a 1D gas of interacting particles, at least with respect to the observables considered so far. This does not imply that the 10-nm chromatin fiber actually is an equilibrium system with such simple interactions. The true mix of molecular mechanisms that produce the effective in vivo behavior is only beginning to be disentangled experimentally (29) and in physical models of nucleosome organization (22). An in vitro reconstitution of in vivo-like nucleosome patterns was shown to be dependent on ATP and on factors acting in trans (13). Moreover, a reduction of the histone–DNA ratio by 50% in vitro (13) and ∼30% in vivo (15) surprisingly left the typical nucleosome spacing close to TSSs largely unchanged. This finding is clearly at odds with pure statistical positioning, which predicts an increased spacing for reduced nucleosome counts. Instead, Zhang et al. (13) suggest an active packing mechanism mediated by remodeling enzymes, e.g., a dinucleosome packing mechanism of the type suggested for the imitation switch family remodeler ISW1a (30). We now explore the possibility that such a packing mechanism acts in addition to the mechanisms of the SNG model.
Active SNG model.
As a minimal extension of the SNG model, we introduce a remodeler that randomly binds, at rate kRM, to two adjacent nucleosomes and actively pulls one of them closer to the other (by 1 bp). This “active SNG model” is illustrated in Fig. 5A; see SI Appendix for details. We assume the remodeler has a maximal reach such that it can bind if the distance between the nucleosome dyads is up to 4w. Although it has no intrinsic directional bias, an apparent packing toward the +1 nucleosome can emerge indirectly: The dinucleosome mechanism mediates an attraction between nucleosomes, creating variable-sized nucleosome clusters anywhere on the DNA. A strongly positioned +1 nucleosome seeds such a cluster and effectively pins its position. To illustrate the model behavior, SI Appendix, Fig. S16 shows the time evolution of a typical simulation. The emerging average pattern downstream of a well-positioned (+1) nucleosome is shown in Fig. 5B for a normal histone–DNA ratio, whereas Fig. 5C shows the pattern obtained at a significantly reduced nucleosome count. To expose the effect of the remodeler, Fig. 5 B and C show not only the pattern with remodeling (dashed line, kRM = 0.08 in units of the intrinsic sliding rate of nucleosomes), but also that for kRM = 0 (solid line). Strikingly, the remodeler has virtually no effect on the nucleosome pattern at the normal histone–DNA ratio (whereas it is crucial at the reduced ratio to maintain the phasing). Intuitively, the compressing effect of the remodeler is weak compared with the gas pressure of the SNG model at high density. This behavior is not sensitive to the precise choice of kRM, because the nucleosome gas pressure rises steeply at high densities.
Fig. 5.

Active SNG model. (A) Illustration of the kinetic model for the coupled dynamics of passive nucleosome sliding and active remodeling. Sliding occurs in 1-bp steps and is constrained by the soft-core nucleosome interaction (relative rates set by the energetics of interaction with neighbors; larger arrows indicate faster processes). Active remodeling is mediated by remodelers acting on dinucleosomes (represented by “tweezer” symbols). A remodeling move brings two neighboring nucleosomes closer to each other by 1 bp, by randomly moving one of the two nucleosomes. (B and C) At physiological histone density (B) remodeling at moderate rates has no effect on the nucleosome pattern, whereas at low density (C) the pattern is maintained only with remodeling.
Discussion
The active SNG model is compatible with the preserved nucleosome spacing at reduced histone abundance (13, 15) and the seemingly contradictory finding that the normal in vivo nucleosome pattern is well described by the barrier nucleosome model without explicitly accounting for remodelers (7–9). The model predicts that a reduced histone abundance produces a slight downward slope in the average nucleosome pattern; i.e., the oscillatory density decays to the reduced average value at long distances from the reference nucleosome (SI Appendix, Fig. S17). Physically, this is a signature of the formation of nucleosome clusters, which have a statistically distributed cluster size, such that the likelihood of leaving the cluster of the reference nucleosome increases with distance. The in vivo data of Celona et al. indeed suggest this trend; compare figure 7B in ref. 15.
Further clues about the physical mechanisms underlying (yeast) nucleosome patterns are provided by the experimental findings that (i) in vitro reconstitution of an in vivo-like nucleosome pattern requires whole-cell extract and ATP (13) and (ii) a combined knockout of several remodelers shows a clear phenotype in the average nucleosome pattern, whereas individual knockouts have mild effects (14). Given that both observations are at a physiological histone–DNA ratio, they can be rationalized kinetically only within the active SNG model: As previously pointed out (22), the intrinsic dynamics of nucleosomes, i.e., fluctuation-induced unbinding and diffusion along DNA, are too slow to equilibrate their positions on the relevant timescales of cell division or in vitro experiments. The remodelers could significantly speed up these dynamics, such that even at the normal histone–DNA ratio an in vivo-like nucleosome pattern cannot be generated in time without active remodelers.
Conclusions
Our results support a physical interpretation of the statistical distribution of nucleosomes around TSSs, where nucleosomes are viewed as particles with a soft repulsive core in a 1D space. Although this description ignores higher-order interactions between nonadjacent nucleosomes, it captures in vivo patterns of different yeast species surprisingly well. The behavior of mutant and in vitro systems as well as the dynamic process of nucleosome pattern formation can be understood by introducing remodeling enzymes into the model, which constitute active components in the 1D nucleosome gas. We proposed one such active component that effectively leads to an attraction between nucleosomes. Interestingly, it can rationalize several key observations in mutant and in vitro systems while retaining the model behavior in the parameter regime corresponding to the in vivo situation. We note that an effective attraction can also be produced through molecular mechanisms other than dinucleosome remodeling. In particular, nucleosome interactions via higher-order chromatin structure could also contribute to this attraction (31–33). Taken together, we believe the active SNG model currently provides the most comprehensive physical description of nucleosome patterns in yeasts, although it is far from a truly mechanistic description of the system. We see several practical uses for the model, e.g., as a physical “null model” for future gene-by-gene analyses of nucleosome positioning and as a component in mechanistic models for transcription regulation in yeast.
Supplementary Material
Acknowledgments
We thank Philipp Korber for helpful suggestions. We are indebted to Jonathan Widom for enlightening discussions and greatly saddened by his untimely death. We would like to dedicate this work to him. This work was funded, in part, by the Bavarian Center for Molecular Biosystems, the German Excellence Initiative via the program “Nanosystems Initiative Munich” (NIM), and the Deutsche Forschungsgemeinschaft through SFB 1032. W.M. acknowledges funding by a Leopoldina Postdoctoral Scholarship. B.O. is grateful to the Center for NanoScience and the Elite Network of Bavaria (International Doctorate Program in NanoBioTechnology).
Footnotes
The authors declare no conflict of interest.
This article is a PNAS Direct Submission.
This article contains supporting information online at www.pnas.org/lookup/suppl/doi:10.1073/pnas.1214048110/-/DCSupplemental.
References
- 1.Dekker J, Rippe K, Dekker M, Kleckner N. Capturing chromosome conformation. Science. 2002;295(5558):1306–1311. doi: 10.1126/science.1067799. [DOI] [PubMed] [Google Scholar]
- 2.Yuan GC, et al. Genome-scale identification of nucleosome positions in S. cerevisiae. Science. 2005;309(5734):626–630. doi: 10.1126/science.1112178. [DOI] [PubMed] [Google Scholar]
- 3.Segal E, Widom J. What controls nucleosome positions? Trends Genet. 2009;25(8):335–343. doi: 10.1016/j.tig.2009.06.002. [DOI] [PMC free article] [PubMed] [Google Scholar]
- 4.Jiang C, Pugh BF. Nucleosome positioning and gene regulation: Advances through genomics. Nat Rev Genet. 2009;10(3):161–172. doi: 10.1038/nrg2522. [DOI] [PMC free article] [PubMed] [Google Scholar]
- 5.Radman-Livaja M, Rando OJ. Nucleosome positioning: How is it established, and why does it matter? Dev Biol. 2010;339(2):258–266. doi: 10.1016/j.ydbio.2009.06.012. [DOI] [PMC free article] [PubMed] [Google Scholar]
- 6.Tsankov AM, Thompson DA, Socha A, Regev A, Rando OJ. The role of nucleosome positioning in the evolution of gene regulation. PLoS Biol. 2010;8(7):e1000414. doi: 10.1371/journal.pbio.1000414. [DOI] [PMC free article] [PubMed] [Google Scholar]
- 7.Chevereau G, Palmeira L, Thermes C, Arneodo A, Vaillant C. Thermodynamics of intragenic nucleosome ordering. Phys Rev Lett. 2009;103(18):188103. doi: 10.1103/PhysRevLett.103.188103. [DOI] [PubMed] [Google Scholar]
- 8.Möbius W, Gerland U. Quantitative test of the barrier nucleosome model for statistical positioning of nucleosomes up- and downstream of transcription start sites. PLOS Comput Biol. 2010;6(8):e1000891. doi: 10.1371/journal.pcbi.1000891. [DOI] [PMC free article] [PubMed] [Google Scholar]
- 9.Mavrich TN, et al. A barrier nucleosome model for statistical positioning of nucleosomes throughout the yeast genome. Genome Res. 2008;18(7):1073–1083. doi: 10.1101/gr.078261.108. [DOI] [PMC free article] [PubMed] [Google Scholar]
- 10.Kornberg RD, Stryer L. Statistical distributions of nucleosomes: Nonrandom locations by a stochastic mechanism. Nucleic Acids Res. 1988;16(14A):6677–6690. doi: 10.1093/nar/16.14.6677. [DOI] [PMC free article] [PubMed] [Google Scholar]
- 11.Tonks L. The complete equation of state of one, two and three-dimensional gases of hard elastic spheres. Phys Rev. 1936;50:955–963. [Google Scholar]
- 12.Mattis DC, editor. The Many-Body Problem: An Encyclopedia of Exactly Solved Models in One Dimension. Singapore: World Scientific; 1993. [Google Scholar]
- 13.Zhang Z, et al. A packing mechanism for nucleosome organization reconstituted across a eukaryotic genome. Science. 2011;332(6032):977–980. doi: 10.1126/science.1200508. [DOI] [PMC free article] [PubMed] [Google Scholar]
- 14.Gkikopoulos T, et al. A role for Snf2-related nucleosome-spacing enzymes in genome-wide nucleosome organization. Science. 2011;333(6050):1758–1760. doi: 10.1126/science.1206097. [DOI] [PMC free article] [PubMed] [Google Scholar]
- 15.Celona B, et al. Substantial histone reduction modulates genomewide nucleosomal occupancy and global transcriptional output. PLoS Biol. 2011;9(6):e1001086. doi: 10.1371/journal.pbio.1001086. [DOI] [PMC free article] [PubMed] [Google Scholar]
- 16.Polach KJ, Widom J. Mechanism of protein access to specific DNA sequences in chromatin: A dynamic equilibrium model for gene regulation. J Mol Biol. 1995;254(2):130–149. doi: 10.1006/jmbi.1995.0606. [DOI] [PubMed] [Google Scholar]
- 17.Poirier MG, Bussiek M, Langowski J, Widom J. Spontaneous access to DNA target sites in folded chromatin fibers. J Mol Biol. 2008;379(4):772–786. doi: 10.1016/j.jmb.2008.04.025. [DOI] [PMC free article] [PubMed] [Google Scholar]
- 18.Tims HS, Gurunathan K, Levitus M, Widom J. Dynamics of nucleosome invasion by DNA binding proteins. J Mol Biol. 2011;411(2):430–448. doi: 10.1016/j.jmb.2011.05.044. [DOI] [PMC free article] [PubMed] [Google Scholar]
- 19.Möbius W, Neher RA, Gerland U. Kinetic accessibility of buried DNA sites in nucleosomes. Phys Rev Lett. 2006;97(20):208102. doi: 10.1103/PhysRevLett.97.208102. [DOI] [PubMed] [Google Scholar]
- 20.Koopmans WJA, Buning R, Schmidt T, van Noort J. spFRET using alternating excitation and FCS reveals progressive DNA unwrapping in nucleosomes. Biophys J. 2009;97(1):195–204. doi: 10.1016/j.bpj.2009.04.030. [DOI] [PMC free article] [PubMed] [Google Scholar]
- 21.Luger K, Mäder AW, Richmond RK, Sargent DF, Richmond TJ. Crystal structure of the nucleosome core particle at 2.8 Å resolution. Nature. 1997;389(6648):251–260. doi: 10.1038/38444. [DOI] [PubMed] [Google Scholar]
- 22.Padinhateeri R, Marko JF. Nucleosome positioning in a model of active chromatin remodeling enzymes. Proc Natl Acad Sci USA. 2011;108(19):7799–7803. doi: 10.1073/pnas.1015206108. [DOI] [PMC free article] [PubMed] [Google Scholar]
- 23.Heus JJ, Zonneveld BJ, Bloom KS, de Steensma HY, van den Berg JA. The nucleosome repeat length of Kluyveromyces lactis is 16 bp longer than that of Saccharomyces cerevisiae. Nucleic Acids Res. 1993;21(9):2247–2248. doi: 10.1093/nar/21.9.2247. [DOI] [PMC free article] [PubMed] [Google Scholar]
- 24.Chou T. An exact theory of histone-DNA adsorption and wrapping. Europhys Lett. 2003;62:753–759. [Google Scholar]
- 25.Teif VB, Ettig R, Rippe K. A lattice model for transcription factor access to nucleosomal DNA. Biophys J. 2010;99(8):2597–2607. doi: 10.1016/j.bpj.2010.08.019. [DOI] [PMC free article] [PubMed] [Google Scholar]
- 26.Lubliner S, Segal E. Modeling interactions between adjacent nucleosomes improves genome-wide predictions of nucleosome occupancy. Bioinformatics. 2009;25(12):i348–i355. doi: 10.1093/bioinformatics/btp216. [DOI] [PMC free article] [PubMed] [Google Scholar]
- 27.Anderson JD, Widom J. Sequence and position-dependence of the equilibrium accessibility of nucleosomal DNA target sites. J Mol Biol. 2000;296(4):979–987. doi: 10.1006/jmbi.2000.3531. [DOI] [PubMed] [Google Scholar]
- 28.Henikoff JG, Belsky JA, Krassovsky K, MacAlpine DM, Henikoff S. Epigenome characterization at single base-pair resolution. Proc Natl Acad Sci USA. 2011;108(45):18318–18323. doi: 10.1073/pnas.1110731108. [DOI] [PMC free article] [PubMed] [Google Scholar]
- 29.Clapier CR, Cairns BR. The biology of chromatin remodeling complexes. Annu Rev Biochem. 2009;78:273–304. doi: 10.1146/annurev.biochem.77.062706.153223. [DOI] [PubMed] [Google Scholar]
- 30.Yamada K, et al. Structure and mechanism of the chromatin remodelling factor ISW1a. Nature. 2011;472(7344):448–453. doi: 10.1038/nature09947. [DOI] [PubMed] [Google Scholar]
- 31.Blank TA, Becker PB. Electrostatic mechanism of nucleosome spacing. J Mol Biol. 1995;252(3):305–313. doi: 10.1006/jmbi.1995.0498. [DOI] [PubMed] [Google Scholar]
- 32.Emanuel M, Radja NH, Henriksson A, Schiessel H. The physics behind the larger scale organization of DNA in eukaryotes. Phys Biol. 2009;6(2):025008. doi: 10.1088/1478-3975/6/2/025008. [DOI] [PubMed] [Google Scholar]
- 33.Chereji RV, Morozov AV. Statistical mechanics of nucleosomes constrained by higher-order chromatin structure. J Stat Phys. 2011;144(2):379–404. doi: 10.1007/s10955-011-0214-y. [DOI] [PMC free article] [PubMed] [Google Scholar]
Associated Data
This section collects any data citations, data availability statements, or supplementary materials included in this article.