Abstract
Sediment and nutrients yields especially from farmlands were studied in a watershed in Ishigaki island, Okinawa, Japan. The transport processes of these materials in rivers, mangrove, lagoon and coastal zones were studied by using various observation methods including stable isotope analysis. They were simulated by using a WEPP model which was modified to be applicable to such small islands by identifying several factors from the observations. The model predicts that a proper combination of civil engineering countermeasure and change of farming method can reduce the sediment yield from the watershed by 74%. Observations of water quality and coral recruitment test in Nagura bay indicate that the water is eutrophicated and the corals cannot grow for a long time. Based on these observations, a quantitative target of the reduction of sediment and nutrients yield in watershed can be decided rationally.
Keywords: sediment, nutrients, watershed, corals, field measurement, WEPP simulation
1. Introduction
Sediment transport has long been studied in view of such as river channel formation, coastal morphology, deposition in reservoirs, etc. Transport of nutrients, typically nitrogen and phosphorous, has also been treated in association with eutrophication in closed water environment and their effects on water quality. If we look at corals, they have been extensively studied in view of the effects of climate change, habitat-area decrease, or artificial cultivation of corals in clean water environments. Each subject has been treated separately in each scientific area.
However, in recent years, environmental problems are becoming complicated, interactive and wide in space and time. For example, decline of corals in Japan cannot be understood without considering human activities on lands, which have continuously increased sediment and nutrients supply. They are transported through rivers and deposit in estuarine and coastal zones to affect ecosystem. The decline of ecosystem, in turn, is reflected to the natural environment on which human beings depend. To solve such complicated and interactive problems, a new approach of research is required to integrate various areas of science and technology. In the present paper, a new approach to this kind of research is introduced.
The objective of this study is to quantify the movement of materials such as sediment & nutrients in watershed including coastal zones, and is to understand its impact on environment and propose rational countermeasures to reduce the impact.
2. Outline of field study
The richest corals in Japan are seen in Sekisei coral sea which locates between Ishigaki island and Iriomote island in Ryukyu island arcs, where more than 360 species of corals are found to exist. Nagura river watershed and Nagura bay in Ishigaki island was selected for the field site, because it locates facing to the Sekisei coral sea, and therefore, coral eggs spawned there are observed to migrate and settle in the bay (see Fig. 1).
Fig. 1.
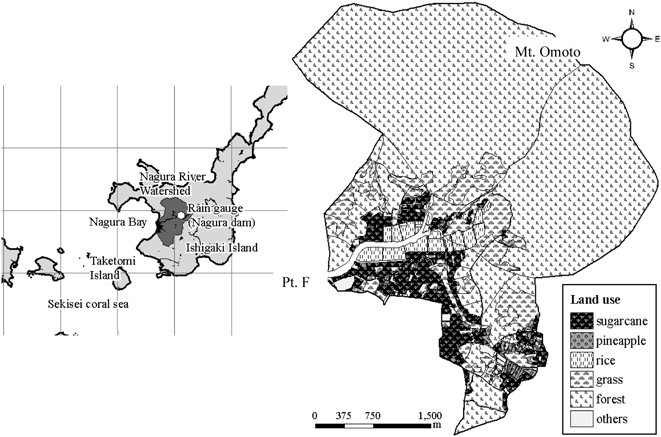
Location of the site, Nagura basin and its land use.
Nagura river has its origin in Mt. Omoto, the height of which is 526 m, and it has a length of 4.6 km of the main stem and a catchment area of 16.1 km2. The area belongs to semi-tropical zone with mean temperature of 25.4 degree in Celsius, and the mean annual precipitation is 2061 mm. About 70% of the watershed is covered with natural forests. Fairly flat area has been developed in the last three decades for agricultural purpose, such as sugarcane and pineapple, which occupies 20% of the watershed. The remained 10% of land are used for traditional rice field, grass field and fairly small residential area (Fig. 1). The river has fairly wide mangrove forests of 16 ha and there is a lagoon at the river mouth. The tidal zone extends to the point F (Kanda bridge) as seen in Fig. 2, which situates at about 600 m from the river mouth, and it is almost the upstream end of mangrove forests. River water discharges from Nagura bridge to Nagura bay, which had rich corals in the past. However, they have been declined, as the sugarcane and pineapple fields have increased in the last three decades.
Fig. 2.
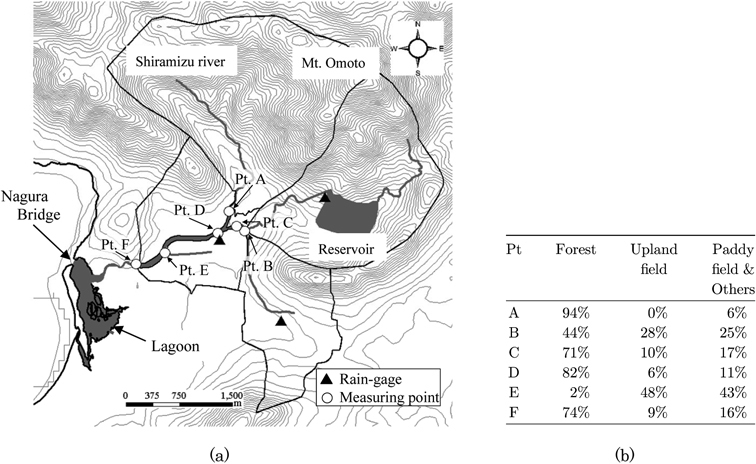
Location of the observation points, and (b) The upstream land use. Kanda bridge locates at Pt. F.
The field observation has been made continuously since 2000 in this study, the major observations of which are summarized in Table 1.
Table 1.
Summary of observations
| Precipitation and wind speed & direction |
| Sediment and nutrient yields from various types of land use |
| Sediment and nutrient transports in agricultural watercourses and rivers |
| Transport of dissolved nitrogen through ground water |
| Behavior of sediment and nutrient movement in mangrove |
| Sediment and nutrients in Nagura bay |
| Land-originated nitrogen contained in sea grass |
| Artificial cultivation of corals in Nagura bay and Sekisei coral sea |
3. Movement of sediment and nutrients in watershed: overall estimation
The movement of sediment and nutrients have been observed continuously since the beginning of field measurements. Herein, the measurement in 2005 are described, as an example. Fig. 2 shows the location of observation points from A to F along river and artificial channel courses. The point A locates at Shiramizu river, the largest tributary of Nagura river, which flows from Mt. Omoto and 98% of the watershed are covered with natural forests. In the upstream of the confluence, we placed point B. In the upstream of point B, there is a dam reservoir to provide water for farmland and domestic use. Just downstream of the confluence, there is a weir for water intake. We placed point D at the weir, where flow discharge can be measured accurately. Point F locates at the upstream end of the tidal area, where Kanda bridge exists, at which we measured continuously the flow velocity and sediment & nutrients concentrations. There is Nagura bridge at the boundary of lagoon and Nagura bay, where water discharge to Nagura bay was observed. Between point F and Nagura bridge, there are thick mangrove forests and lagoon as described before.
The results of measurement for sediment and nutrients movement along the river course at a flood on June 12, 2005, as an example, are described in Table 2. The total amount of precipitation and the maximum rainfall per hour were 152 mm and 57 mm/h, respectively. By using both the observations at points A, B, C and the upstream land use in Fig. 2(b), we can identify crudely the averaged-sediment and nutrients yields per unit area from upstream forest, upland field (sugarcane and pineapple) and paddy field & other land use (grass field in major), as depicted in Fig. 1.
Table 2.
Sediment and nutrients yields from three sub-basins at a heavy rain on June 12, 2005
| Sediment | Nitrogen | Phosphorous | |
|---|---|---|---|
| Pt. A | 14 t | 179 kg | 7 kg |
| Pt. B | 17 t | 95 kg | 9 kg |
| Pt. C | 18 t | 58 kg | 6 kg |
| Forests | Farmland (sugarcane and pineapple) | Rice field, grass field | |
|---|---|---|---|
| Sediment | 125 (kg/ha) | 474 | −434 |
| Nitrogen | 0.143 | 0.465 | 0.758 |
| Phosphorous | 0.041 | 0.166 | −0.115 |
The results are also summarized in Table 2, in which sediment yield from farmland is almost 4 times of that from forest. The remarkable result is paddy field, which shows a negative sediment yield, indicating that such kind of land use can work as retarding and settling basin. Compared to the sediment yield, nitrogen production is large in paddy field and grass fields, the reason for which is that grass field is used as pasture for cows. The present estimation is crude due to a reason that sediment transport and deposition in river courses are not included. However, the result suggests that sediment and nutrients yields are significantly affected by the types of land use. Further measurements for various land use are, therefore, needed as described in the following.
Dissolved nitrogen is also transported through ground water in addition to transport by surface water, and it enhances the growth of sea algae in coastal zone, because the term for ordinary low-water is very long compared with the short term durated flood. Corals are much affected by sea algae, and the increase of nitrogen decreases the corals, defeated by competition with sea algae. Thus, the nutrient transport, typically nitrogen, as well as sediment is also an important factor for corals to live. The mechanisms of transport of sediment and nutrients are different at floods and low-water ordinary term. For example, major part of nitrogen is transported as particulate material at floods. On the contrary to flood events, dissolved nitrogen is dominant for long duration of runoff after rainfall. Fig. 3 is an example of a rainfall in Nov. 2007, and the subsequent effluent of dissolved NO3-N measured at point F (Kanda bridge). It is revealed that the concentration of NO3-N gradually increases after the rainfall, which indicates that the concentration of dissolved NO3-N is much affected by the subsequent intermediate groundwater runoff. To measure the spatial distribution of NO3-N contained in ground water, wells which exist in this basin are used for observation. The distribution in 2007 is depicted in Fig. 4, from which it is shown that the concentration is generally large at areas where agricultural and cattle breeding activities are high.
Fig. 3.
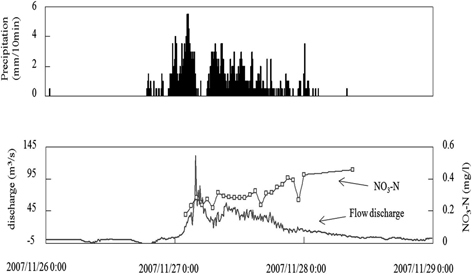
Variation of dissolved NO3-N in river water at Pt. F (Kanda bridge) after a heavy rain on Nov. 27, 2007.
Fig. 4.
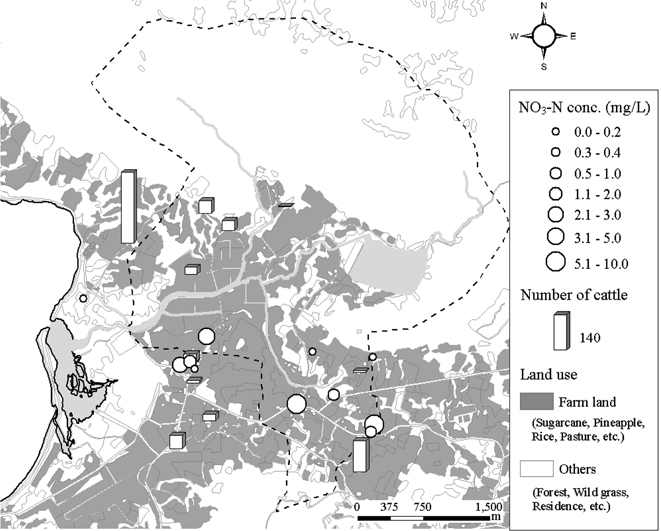
Spatial distribution of NO3-N contained in ground water in 2007.
To estimate the balance of nitrogen in this basin, the following calculation and measurement were conducted. The total amount of nitrogen artificially put in this area was estimated by the following unit method. Since the amount of standard use of nitrogen-chemical fertilizer per year & unit area for various types of farmland and the effluent of nitrogen from a cattle per year are known, we can estimate total amount of nitrogen used in this catchment area. In addition to this, effluent from domestic use is also estimated. From these evaluations, it is estimated that the total amount of nitrogen used in this basin was 46,310 kg in 2007, among which 70% are occupied by farmland, 25% originate from cattle breeding and 5% are effluent from domestic use.
Discharge of nitrogen from the basin was observed at Kanda bridge. The flow discharge and the concentrations of total nitrogen and NO3-N have been measured at this point. From the former estimation and the observations at Kanda bridge, it is calculated that the amount of nitrogen passes through Kanda bridge is about 43.8% of the nitrogen used in this catchment area. However, it should be noted that natural production of nitrogen such as that in forest is not included in this estimation.
4. Detailed observation of sediment yield for various types of land use
As described before, detailed measurements on sediment and nutrients productions from various land use are necessary, especially for sugarcane, pineapple fields, and grass fields.
Sediment yield is affected by many factors, e.g., strength and amount of rain fall, type of soils, land use, slope and length of agricultural land area, land surface cover such as by vegetation or mulch, way of cultivation, etc. Most of existing papers have dealt with sediment yields associated with rain fall, soils and land slope. Therefore, the effects of land use and coverage on sediment yield are measured extensively herein.
In Okinawa, several types of sugarcane farming are used. The spring sugarcane is conventional-tillage farming, for which sugarcane is planted in February to March, and it is harvested in the next year January or February. Sugarcane farming with grass strip (green-belt) at the end of farmland is sometimes used for the purpose of reducing sediment erosion. As the grass strip, lawn is planted. As a traditional way of farming, the perennial sugarcane is used as no-tillage farming. The perennial sugarcane is grown by using remaining roots after the harvest.
In a series of field experiments, rain fall, rates of water and sediment yields from various types of land use, are observed (For details, refer to Ref.1)) The discharge of water was measured by Parshall flume equipped at the end of each slope (Fig. 5). Since the soils eroded in this field are very fine, the typical median size of which is 5 μm, they are transported as suspended load or wash load. The concentration was measured by infrared back-scattering type turbidity meter placed in the Parshall flume.
Fig. 5.
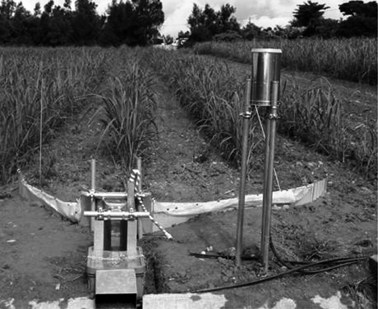
Parshall flume equipped at the downstream end of sugar-cane field. A rain gage is also placed at the site, as seen in the right hand side of the flume.
As an example, an observation performed during June 8 and September 15, 2004 is employed herein. Fig. 6 shows field observations for 3 precipitations during the period, for which discharge of water and sediment concentration were measured continuously for various methods of sugarcane farming. The total amounts of sediment yields during the term according to the types of farming are summarized in Fig. 7. Bare-land without vegetation (St-1) yielded almost 2 kg/m2 during the observation. Grass strip equipped at the downstream end of the farmland shows little effect on the suppression of the sediment yield, though local government has long recommended it as an effective countermeasure to reduce erosion. The reduction was the largest for no-tillage farming, and the amount of the reduction is about 94% compared with that of bare field. It can be reduced by 85% compared with conventional farming of spring planting. No-tillage farming is traditional way of planting sugarcane, practiced in this area before the introduction of cultivation machine. Pasture (grass field) yields fairly small amount of sediment, which is about 16% of bare-land use.
Fig. 6.
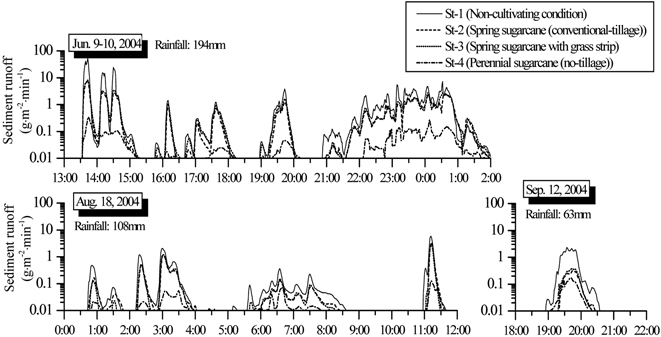
Time series of sediment yields for various ways of sugar-cane farming by 3 rains in 2004.
Fig. 7.
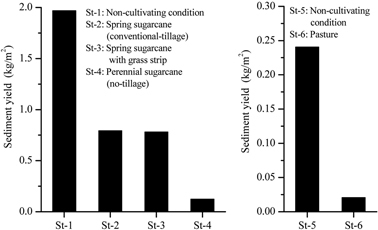
Sediment yield by various ways of farming observed for rains from June to Sept., 2004.
Particulate nitrogen and phosphorous attached to the fine sediment were also measured at Parshall flume as depicted in Fig. 8, which shows linear relationships on the particulate nutrients concentration and that of suspended sediment. The reason is that the sediment is very fine as described previously, and therefore particulate nutrients attach extensively to the sediment. Thus, the suppression of sediment production is also effective to reduce the nutrients yields from farmlands.
Fig. 8.
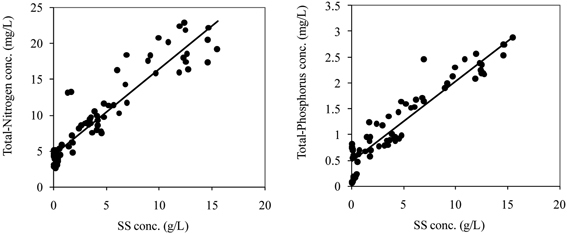
Relations between suspended sediment concentration (SS) and those of nutrients. Solid lines show the empirical regressions.
5. Behavior of sediment and nutrients in mangrove forests
Riparian mangrove forests are expected to retard the movement of estuarine water and sediment, and supply nutrients to the adjacent coastal zones. Since particulate nutrients attach to fine sediment, mangrove forests possibly control the movement of such materials derived from the upstream catchment area. Thus, this kind of forests work as a buffering interface between land and sea.
The main channel and the mangrove swamps usually constitute a two-stage channel, and the difference in elevation is typically 1 m in this area.2) At neap tide, water enters only through small creeks in swamps, and the mangrove swamps are inundated completely only at spring tide (see Fig. 9). The topography of river bed and swamps were measured by using ordinary optical level and a differential GPS, which was used for numerical simulation of flow and sediment movement.
Fig. 9.
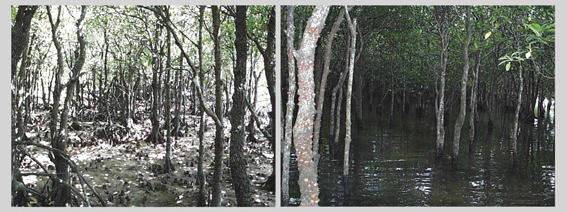
(a) Mangrove swamp, and (b) Inundation at spring tide.
To observe the flow and the associated trap of several substances in swamps, such as soils, nitrogen, phosphorous, carbon and salinity, 12 sections were selected along the main river course from Kanda bridge to the outlet to the lagoon. The measured parameters and the methods used are summarized in Table 3.
Table 3.
Measured parameters and applied methods for observation
| Items | Date | Method | |
|---|---|---|---|
| Water qualities | SM,PO4-P,T-P NH4-H,NO2-N T-N, NO3-N,DOC Salinity, DO |
January 11 to 13, 2000 June 28 to July 4, 2000 |
SM: Filtration Nutrients: Colormetric method DOC: TOC-control Salinity, DO: Portable water-quality meter |
| Vegetation | Number of trees BDH Litter fall |
July 2 to August 18, 2000 | |
| Soil | Sediment size distribution T-N, T-P IL |
June 28 to July 4, 2000 | Size distribution: Sieves, Laser diffraction particle size analyzer Nutrients: Colorimetric method |
| Flow | Velocity Water level |
January 11 to 13, 2000 June 28 to July 4, 2000 December 17 to 23, 2000 July 20 to 22, 2001 |
Velocity: Electromagnetic velocimeters Water level: Water level meter |
Organic materials (measured by ignition loss, IL) and nutrients (total nitrogen, T-N, and total phosphorous, T-P) contained in the surface soils are depicted in Fig. 10. Swamp is a major source of organic materials supplied from fallen leaves and fruits, which are used as foods of crabs, shellfish, insects and bacteria living in mangrove forests and lagoon. They are therefore useful in maintaining mangrove ecosystem. The fraction of IL contained in the surface soils, which represents the amount of organic carbon, is very large especially in mangrove swamps, and it exceeds 10% at the right bank. The sampling of soils was also conducted at small creeks and dry area during low tide. There are higher concentrations of T-P and T-N in the swamps than those in the river bed. In addition, more organic materials and nutrients are included in the surface soils of creeks than in the dry area. This suggests that these materials move from swamps to small creeks, and they deposited and accumulated in the creeks.
Fig. 10.
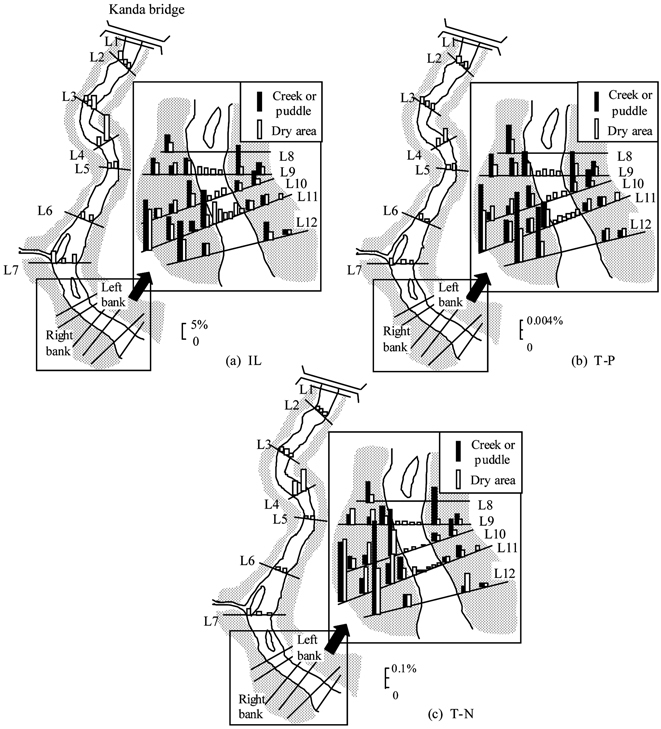
Observed substances contained in surface soils; (a) IL, (b) T-P, (c) T-N, in which L1 locates just downstream of Kanda bridge and L12 locates at near-exit to lagoon.
To treat this phenomenon, a numerical simulation was conducted by using depth-averaged two dimensional unsteady zero-equation turbulence model, coupled with a suspended sediment transport equation. 2) During Sept. 1 and Nov. 5, 2000, there were two precipitations for which the condition of tide was different. For a rainfall event occurred on Oct. 8, 2000, the discharge of flood was fairly small and the tidal range was also small. Another rainfall on Oct. 19, 2000 caused fairly large flow discharge, and the tidal range was also large. The numerical simulation was performed for the two events. The temporal variations of the longitudinal flow velocity and the free surface elevation at the exit to the lagoon are described in Fig. 11 (a) and (b) to test the applicability of the present model. The figures show good agreement between the numerical simulation and the observation to support the applicability of the present model. The temporal variation of longitudinal flow velocity is not completely sinusoidal but skewed due to the nonlinear drag force induced mainly by mangrove forests.
Fig. 11.
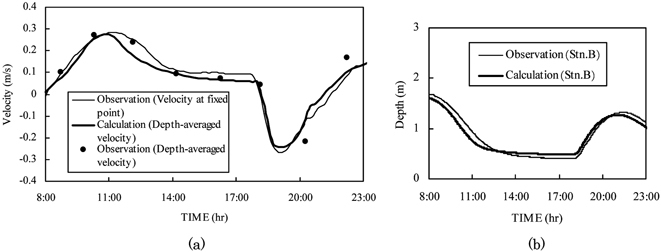
(a) Temporal variations of the longitudinal flow velocity, (b) Free surface elevation, at L12 (termed Stn. B in this figure) for flood on Oct. 8, 2000.
Transports of suspended sediment (SS) were measured at two floods during October 8 to 12 and October 18 to 21, 2000. In the first flood, when the concentration of SS increases, the tide was low. The SS was therefore immediately flushed to Nagura bay through the lagoon. On the contrary to this, the second flood occurred at high tide, which has yielded retardation of high SS concentration of water in mangrove area. Suspended sediment deposition in the swamps therefore occurred in this flood. Thus, the tidal condition has a large influence on the transport and deposition of SS during flood in mangrove area.
The temporal variation of suspended solids during the two floods were also calculated, from which the temporal variations of concentration of suspended solids at right bank (R-B) and at left bank (L-B) at the exit are depicted in Fig. 12 (a) and (b). The figures indicate that the timing with tide is very important for suspended sediment to be transported toward mangrove swamps. From these numerical simulations, the deposition of suspended sediment was estimated for the two floods, and the followings were found: The rate of trap depends significantly on timing between flood and tide, i.e., when a flood occurs at high tide, the flow with suspended sediment is retarded in mangrove swamp, and the deposition of fine sediment is enhanced. However, the trap of sediment for flood by mangrove forest is at least between 2.3% and 12.5% for the two cases, and therefore, the function of settling fine sediment and the nutrients in mangrove forests cannot be expected much.
Fig. 12.
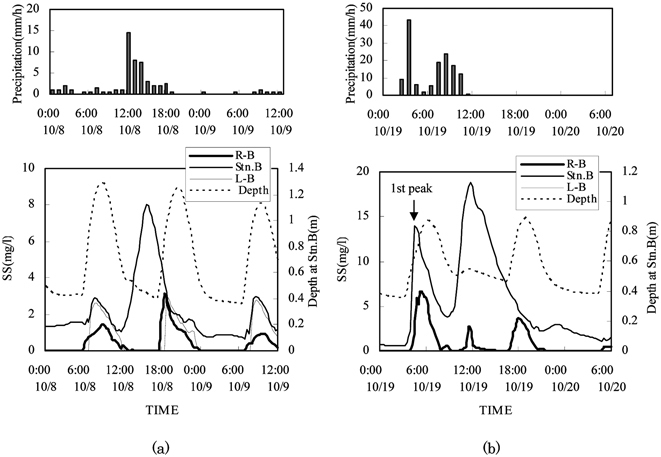
Calculated temporal variation of suspended solids during floods in Oct. 2000 (a) Flood occurred during low tide, (b) The 1st peak of flood occurred at high tide for which the sediment concentration at R-B is large.
6. Sediment transport in watershed simulated by WEPP
In the present numerical simulation for sediment transport in watershed, a model termed WEPP (Water Erosion Prediction Project,3) is employed. The model is composed of three parts; erosion process in slopes, transport process in channels and rivers, and transport and deposition in retarding basins such as sediment settling ponds. The model for erosion process is typically useful for agricultural lands, for which several factors such as weather, slopes, soils, surface flow, growth of crops, management of lands, etc are included. They are prepared and listed as GIS data in this study. Based on the estimation of effective rainfall by Green-Ampt model, and surface run-off of water from slopes is calculated by using kinematic wave model. Numerical parameters included in WEPP are determined by using the data obtained from various types of land use described previously. The details are written by Osawa and Ikeda.4)
In Fig. 13, the results of application to rainfall events are depicted, in which predictions by WEPP and observation are compared for total sediment run-off at a watershed for successive rainfall events, in which the result by a traditional USLE model (Universal Soil Loss Equation) are also shown for comparison. The results indicate that WEPP model is better than USLE model to predict the erosion rate in this area, and it is used herein for further calculation. Another reason for the unemployment of USLE is that the model predicts zero sediment yield for flat farmlands, which is hardly realistic. The WEPP model is herein applied to various land uses for slope length of 100 m and the inclination of 0.03 (which are typical values in this area), in which all successive rainfall events from 1994 to 2005 are employed to estimate the land erosion rate. This means that the calculation was performed for more than 10 years data. Fig. 14 is the result for the mean annual erosion rate for each type of farmland use as depicted in Figs. 5 and 7. The numerical results of the erosion rate for each type of farming agree quantitatively with the observations shown in Fig. 7. The reduction of sediment yield by various types of farming is reasonably reproduced by WEPP, indicating that the model can be used for simulating movement of sediment in this watershed.
Fig. 13.

Observed and calculated sediment runoff during May 2002 and April 2003.
Fig. 14.
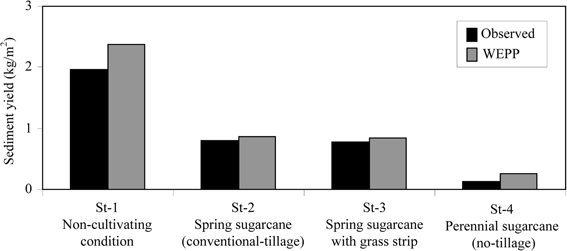
Observed and predicted mean annual erosion rate for various types of sugar-cane farming.
The WEPP model was applied to a rain fall on June 12, 2005, as an example, as shown in Fig. 15, in which the maximum rain fall for 10 minutes interval was 13 mm. The flow discharge and sediment transport were measured at point F (Kanda bridge). The calculations of flow discharge and the sediment transport agree reasonably well with the observations, indicating that the model can predict watershed runoff of water and sediment. The total amount of sediment transported at this point by the rain fall was calculated to be 40 tons.
Fig. 15.
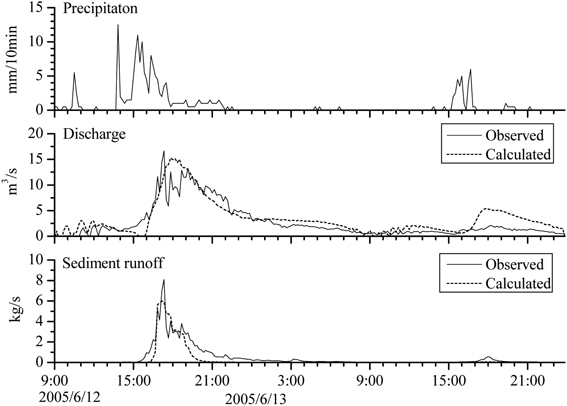
Application of WEPP model to a rain on June 13, 2005, and calculated discharges of flow and sediment are compared with the measurements.
By using WEPP, the effects of various countermeasures to reduce the sediment transport were estimated. The countermeasure to reduce the sediment yield consists of two parts; one is civil engineering method to reduce the length and the slope of farmlands, and the second is the change of farming method to employ such as no-tillage farming, coverage by vegetation and mulch. The result of simulation indicates that the former method by employing civil engineering technique can reduce the sediment transport only by 12% (Fig. 16(a)). Comparing to this, tandem use of civil engineering method and the change of farming is very effective to reduce the sediment yield by 74% (Fig. 16(b)).
Fig. 16.
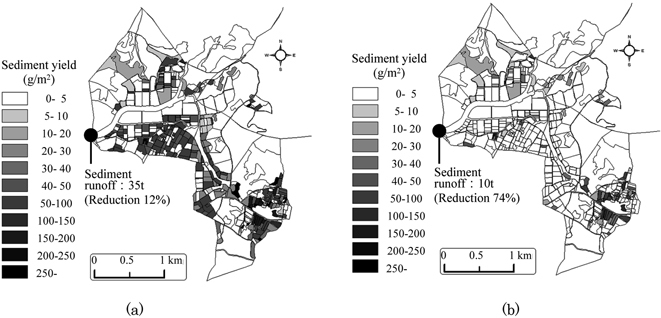
(a) Reduction of sediment yield just by civil engineering method, and (b) Reduction by tandem use of civil engineering method and change of farming predicted by WEPP.
The numerical simulation has revealed that if a proper combination of countermeasures is adopted, the sediment yield and the impact to coastal zone can be reduced drastically. A rational amount of the reduction should therefore be decided based on the impact on coastal environment induced by sediment and nutrients yields from land.
7. Coastal environment
Fine sediments transported from agricultural lands, the typical sediment size is a few μm, has long been deposited in coastal zones. The coast looks red by the deposition of fine sediment, which has destroyed the corals, as seen in Fig. 17 (a) and (b).
Fig. 17.
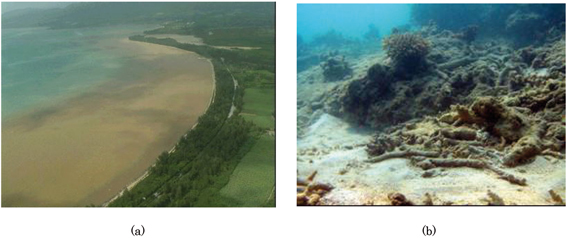
(a) Red soil deposition along the coast of Nagura bay (Photo taken on Sept. 12, 2001). On the top-right of the figure, lagoon is seen. (b) Endangered corals in Nagura bay by sediment deposition.
Measurement has been performed for sediment concentration included in sea water at no precipitation of Feb. 7, 2007 and rainy day of Dec. 14, 2006. Fine suspended sediment discharged from Nagura river through Nagura bridge spread throughout the bay, and the maximum concentration was observed to reach almost 50 ppm.
The amount of silt included in the bottom sediment of the bay was measured as depicted in Fig. 18. The rate of silt included in bottom sediment is important, because this kind of silt is easily suspended at strong wind such as at typhoon and fine sediments contain a large amount of nutrients. The fine sediment suspended again deposits on corals. At many places of Nagura bay the ratio of silt is high, which exceeds the criterion of Rank 5 for corals can survive.
Fig. 18.
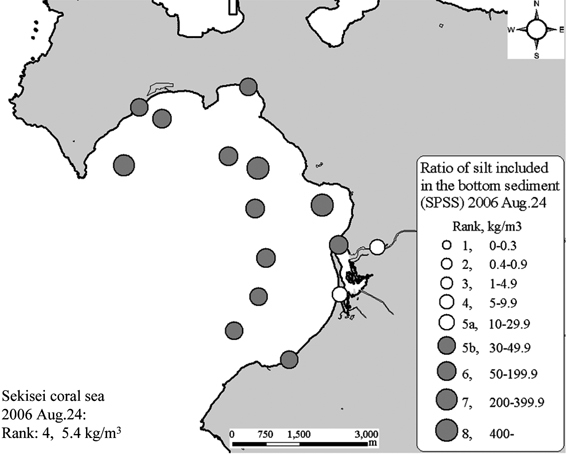
The ratio of silt included in the bottom sediment.
Another problem is nutrients. At the same time with the sediment measurement, the concentrations of NO3-N and PO4-P included in the sea water were measured. Herein, only distribution of NO3-N is depicted in Fig. 19. The high concentration of NO3-N along sea coast affects seriously the growth of corals. The NO3-N concentration near the coast reaches 10 to 100 times of that in Sekisei coral sea where the water is almost free of pollution. This can produce a large impact on corals, because corals can grow in environment with clear water and poor nutrients. If water becomes eutrophicated, corals are usually defeated by sea algae and sea grasses which grow in nitrogen-rich environment.
Fig. 19.
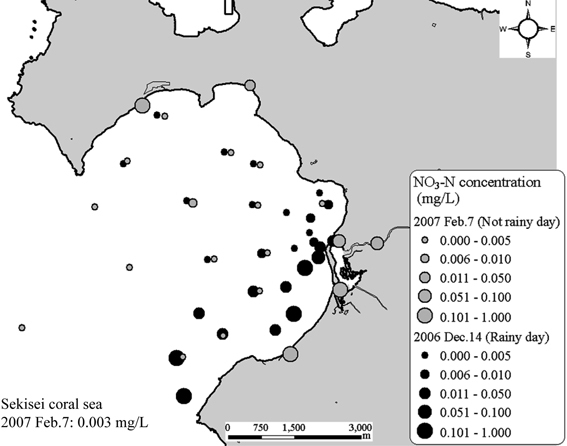
NO3-N concentration in sea water. It should be noted that the concentrations near the coast take 10 to 100 times of that in Sekisei coral sea.
To identify the effects of nutrients originated from lands, nitrogen included in sea glasses growing on sand bedded sea bottom was measured by employing the method of stable isotope analysis. Stable isotopes are seen for materials such as carbon, nitrogen, oxygen, hydrogen, etc.5) The ratio becomes changed from the standard value by the history of the material encountered in chemical and physical processes. Therefore, by measuring the change of the ratio between stable isotopes included in the specimen, possibility arises to identify the origin of the material. For example, by measuring the ratio of stable isotope of nitrogen included in the sea grasses, it is possible to assess that the nitrogen is land origin or sea water origin. The following is the basics of stable isotope analysis:
The change is described by the following equations, as exemplified for nitrogen:
in which RN denotes rate between 15N and 14N, δ 15N is the deviation from the standard value, and the subscripts s and x denote the value of standard and specimen, respectively. Herein, the standard value of RN is employed by using the nitrogen gas of the atmosphere, which is known to be 0.0037.
In the present observation performed in 2008, 5 lines were selected from the shoreline to offshore, and sea grasses growing on sand beds were sampled along the lines. They were sent to the Hydraulics Laboratory of Tokyo Institute of Technology, and the stable isotope analysis was performed. The result is shown in Fig. 20, for which it is clear that the deviation becomes large as approaching to the shoreline. It indicates that the included nitrogen originated from land becomes small as the distance from the shoreline increases, and it decreases almost exponentially with distance from the shore. It reveals that near-coast environment is much affected by human activity in land.
Fig. 20.
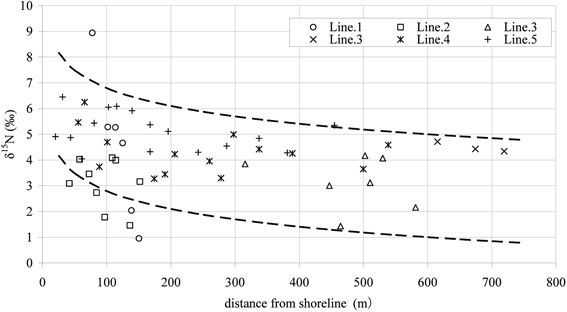
The change of stable isotope composition for nitrogen included in bottom sea grasses along the distance from the shoreline. In line 3, two types of sea grasses were sampled. Broken lines indicate crude upper & lower values of the measurements.
8. Coral recruitment test
To identify the effects of nutrients on the growth of corals quantitatively, an experiment for the growing of corals is under conducting from 2006.6) To catch eggs of corals spawned in the Sekisei coral sea and to provide the bed for growing, facilities depicted in Fig. 21 are settled at 4 places where the water environment is much polluted by land, weakly polluted places in Nagura bay, and pollution free places in Sekisei coral sea. Nutrients included in sea water and growth of algae are also observed in the same locations. It is found that eggs spawned in Sekisei coral sea actively migrate to Nagura bay to settle on the facilities and grows for a short time. However, they are covered with fine sediment and sea algae, and they cannot grow for a long time of the order of one year. The present purpose is to find the criteria of eutrophication and the amount of fine sediment for which corals can grow. If such criterion is known by the experiment, we can decide a quantitative target to reduce the amount of fine sediment and the associated nutrients originated from land based on science. In the estimation, the WEPP model is useful to identify the countermeasure for the reduction.
Fig. 21.
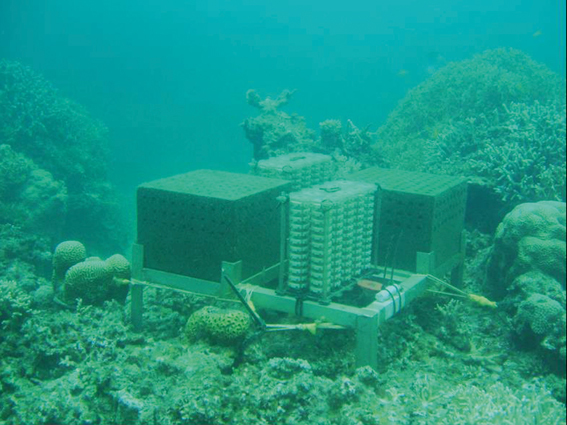
Coral eggs settling and growing units placed in Nagura bay (Photo taken by M. Okamoto).
9. Conclusions
The major objective of the present study is to estimate scientifically the proper reduction of sediment and nutrients yields from lands by employing numerical simulation and field observations. Through the researches performed herein, the followings can be concluded:
The coastal pollution and environment is much correlated with the state of land use, and the improvement of land use is essential in maintaining sound ecosystem, typically for corals in Okinawa.
The sediment yield can be reduced drastically by changing ways of farming, especially coverage of bare land by mulching or by vegetation can reduce soil erosion. The traditional no-tillage farming in sugarcane field also can reduce the sediment yield by 93% compared with that of spring planting of sugarcane, which is the reason why corals were very rich in Nagura bay before the introduction of modern method of planting sugarcane by using cultivating machine.
Concentrations of nutrients such as particulate nitrogen and phosphorous are closely correlated with fine suspended sediment, and the reduction of sediment yield can also reduce the nutrient yield from land. Dissolved nitrogen is also transported through ground water at low discharge of flow, for which an adequate use of chemical fertilizer is recommended.
WEPP model can predict the sediment yield, transport and deposition, which is useful in estimating the effect of several countermeasures to reduce the sediment yield and transport. It is predicted the amount of sediment yield can be reduced by at most 74% by proper combination of civil engineering works and the farming methods.
Mangrove forests work as an interface between land and sea, and the retardation of flood in the area can reduce the impact of land on the coastal environment. However, the removal of fine sediment yielded in land is at most an order of 10%, and cannot be used as an effective settling place for fine sediment and nutrients.
Corals cannot grow in sediment-rich and eutrophicated water environment. Coral eggs spawned in Sekisei coral sea migrate to Nagura Bay and settle there. However, they cannot grow in the present environment. By using the stable isotope analysis, the ratio of land originated nitrogen included in sea bottom grasses is found to increase as approaching to the coastline.
Acknowledgments
The present study has been continuously supported by JSPS Research Supports A (Grant No. 14205070) & S (Grant No. 17106006) and Kajima Foundation, which are gratefully acknowledged. Thanks are also extended to Dr. Y. Toda of Nagoya University for field observations and many students of Tokyo Institute of Technology engaged in this study for finishing graduation and master’s thesis. A collaborative work with Dr. M. Okamoto for coral recruitment is also acknowledged.
Profile
Syunsuke Ikeda was born in Kagawa, Japan, in 1945, and received his Dr. of Engineering from the University of Tokyo in 1975 under the direction of Professor Kiyoshi Horikawa. He worked at Tokyo Institute of Technology as research associate during 1971 and 1976, and moved to Saitama University as associate professor. He moved again to Tokyo Institute of Technology as professor from 1990. He stayed in the University of Iowa as invited professor in 1989. He was appointed as a member of the Science Council of Japan in 2003, and is serving as vice president of the Japan Federation of Engineering Societies from 2007. He became member of the Engineering Academy of Japan in 2004. One of his major research areas is sediment transport and river morphodynamics for which he was awarded the Karl Emil Hilgard Prize of the American Society of Civil Engineers in 1984 and the Best Paper Prize of the Japan Society of Civil Engineers in 1987. He is also working on engineer’s ethics & qualification, and served as the president of CPD consortium of Construction Engineering for the development of civil engineer’s competence.

References
- 1).Osawa, K. and Ikeda, S. (2007) Soil erosion in farmlands and sediment, nutrient movements in watershed–measurement and estimation techniques for red-soil runoff in Okinawa–(I). Water Science 51–2, 1–15 [Google Scholar]
- 2).Ikeda, S., Toda, Y. and Akamatsu, Y. (2004) Flow, sediment, and nutrient transport in a riparian mangrove. Water Science and Application 8, American Geophysical Union, Washington DC, pp. 171–185 [Google Scholar]
- 3).Ascough J.C. II, Baffaut, M.A. and Nearing, B.Y. (1997) The WEPP watershed model. Transaction of ASAE 40–4, 921–933 [Google Scholar]
- 4).Osawa, K. and Ikeda, S. (2007) Soil erosion in farmlands and sediment, nutrient movements in watershed–measurement and estimation techniques for red-soil runoff in Okinawa–(II). Water Science 51–3, 1–24 [Google Scholar]
- 5).Sakai, H. and Matsuhisa, Y. (1996) Stable isotope in earth science. University of Tokyo Press, Tokyo, p. 5 [Google Scholar]
- 6).Roeroe, K., A., Yap, R. and Okamoto, M. (2009) Development of a coastal environment assessment system using coral recruitment. Fish Science 75, 215–224 [Google Scholar]


