

Abstract
Calmodulin (CaM) is most recognized for its role in activating Ca2+–CaM-dependent enzymes following increased intracellular Ca2+. However, CaM’s high intracellular concentration indicates CaM has the potential to play a significant role as a Ca2+ buffer. Neurogranin (Ng) is a small neuronal IQ-motif–containing protein that accelerates Ca2+ dissociation from CaM. In cells that contain high concentrations of both Ng and CaM, like CA1 pyramidal neurons, we hypothesize that the accelerated Ca2+ dissociation from CaM by Ng decreases the buffering capacity of CaM and thereby shapes the transient dynamics of intracellular free Ca2+. We examined this hypothesis using a mathematical model constructed on the known biochemistry of Ng and confirmed the simulation results with Ca2+ imaging data in the literature. In a single-compartment model that contains no Ca2+ extrusion mechanism, Ng increased the steady-state free Ca2+. However, in the presence of a Ca2+ extrusion mechanism, Ng accelerated the decay rate of free Ca2+ through its ability to increase the Ca2+ dissociation from CaM, which in turn becomes subject to Ca2+ extrusion. Interestingly, PEP-19, another neuronal IQ-motif protein that accelerates both Ca2+ association and dissociation from CaM, appears to have the opposite impact than that of Ng on free Ca2+. As such, Ng may regulate, in addition to the Ca2+–CaM-dependent process, Ca2+-sensitive enzymes by influencing the buffering capacity of CaM and subsequently free Ca2+ levels. We examined the relative impact of these Ng-induced effects in the induction of synaptic plasticity.
INTRODUCTION
Synaptic spines are small compartments (~1 μm in diameter) connected to the dendrites of a neuron through a thin shaft (~0.1 μM) (Nimchinsky et al. 2002). One proposed functional role of spine architecture is to biochemically isolate the compartment from the dendrite and vice versa, permitting each spine to serve as independent functional units relative to intracellular Ca2+ (Majewska et al. 2000; Nimchinsky et al. 2002; Sabatini et al. 2002; Yang et al. 1999). In hippocampal CA1 pyramidal neurons, the elevation of Ca2+ in the postsynaptic spine results in the induction of synaptic plasticity, e.g., long-term potentiation (LTP) and long-term depression (LTD). More specifically, the amplitude, duration, and temporal profile of local Ca2+ signals in the spine are important determinants of the selective induction of either LTP or LTD (Yang et al. 1999). However, the factors that control local Ca2+ in the spine under physiological conditions, such as Ca2+ influx dynamics (by ion channels), Ca2+ buffers, and Ca2+ extrusion mechanism, are largely unknown (Majewska et al. 2000; Sabatini et al. 2002; Scheuss et al. 2006).
Calmodulin (CaM) is a key regulator of the Ca2+ signaling system of the postsynaptic spine important for LTP and LTD induction (Malenka et al. 1989; Xia and Storm 2005). Besides its role as a signal transduction molecule, CaM also functions as a ubiquitous endogenous Ca2+ buffer in neurons (Baimbridge et al. 1992). Interestingly, most CA1 pyramidal neurons contain CaM but not other EF-hand Ca2+-binding proteins (e.g., parvalbumin and calretinin; reviewed in Bainbridge et al. 1992). An exception is calbindin-D28K, which is expressed in a subpopulation of CA1 pyramidal neurons but only in rat (Guadano-Ferraz et al. 2005; Singec et al. 2004). The function of CaM as a buffer is frequently overlooked but a review of experimental evidence reinforces that CaM is a primary Ca2+ buffer in CA1 pyramidal neurons. The concentration of total (soluble and membrane bound) CaM in hippocampal neurons is 0.25–0.67% of the total protein (Kakiuchi et al. 1982; Klee and Vanaman 1982; Popov et al. 1988). This corresponds to about 37–100 μM of CaM (assuming the protein content is 0.25 g/ml cell volume as in Huang et al. 2004). CaM binds four Ca2+ ions: two Ca2+ ions bind in a cooperative fashion to each lobe (Babu et al. 1985; Gaertner et al. 2004; Putkey et al. 2003). Therefore CaM equips hippocampal neurons with about 148–400 μM of Ca2+-binding sites. Using this information, one can calculate a Ca2+ buffering capacity (κE) of about 32–87 (see Ca2+ buffering capacity and Ng in METHODS). This value exceeds the (endogenous) Ca2+ buffering capacity estimated in the small dendrites and spine (κE ~ 20) (Sabatini et al. 2002) and is close to or slightly lower than the buffering capacity in the proximal apical dendrite (κE ~ 44–80) of CA1 pyramidal neurons (Helmchen et al. 1996; Lee et al. 2000a; Maravall et al. 2000). Furthermore, the diffusion coefficient of CaM in neurites is about 2–20 μm2/s (Kim et al. 2006), which is close to the estimated diffusion coefficients (~10–50 μm2/s) of the dominant endogenous Ca2+ buffer at excitatory hippocampal synapses (Murthy et al. 2000). These data strongly suggest that CaM is a primary, albeit not the only, endogenous Ca2+ buffer in dendritic spines of CA1 pyramidal neurons.
If CaM plays a significant role as an endogenous Ca2+ buffer, then proteins that bind CaM and tune CaM’s Ca2+-binding kinetics must have an impact on the local Ca2+ dynamics. Neurogranin (Ng) is such a protein and its effect on the Ca2+-binding kinetics of CaM was recently identified (Gaertner 2004; Gaertner et al. 2004; Putkey et al. 2003). Neurogranin (Ng) and a related protein, PEP-19, are members of the IQ-motif family of CaM-binding proteins that interact with apo-CaM and Ca2+–CaM. Both proteins appear to specifically affect Ca2+ binding to the C-terminal lobe of CaM, with no apparent effect on Ca2+ binding to the N-terminal lobe. Ng is a 78 amino acid neuronal protein highly enriched in the postsynaptic spines of CA1 pyramidal neurons (minimally ~65 μM) (Huang et al. 2004). On binding, Ng accelerates the dissociation of Ca2+ from the C-lobe of CaM (Gaertner et al. 2004). Ng may well play a significant role in the local Ca2+ handling in the spine by controlling the Ca2+-binding capacity of CaM (Gerendasy 1999; Gerendasy et al. 1994; Huang et al. 2004; Krucker et al. 2002; van Dalen et al. 2003). As mentioned, calbindin-D28K, another major EF-hand family Ca2+-binding protein, is not expressed in most excitatory neurons in the hippocampal CA1 region (Guadano-Ferraz et al. 2005; Singec et al. 2004) and Ng and calbindin-D28K do not colocalize in CA1 pyramidal cells (Guadano-Ferraz et al. 2005). Because Ng’s only known biochemical function is binding CaM, this observation leads to the core hypothesis of the present work: Ng will control the Ca2+ buffering capacity and Ca2+ transient dynamics by its interactions with CaM in CA1 pyramidal neurons.
Here we use a simple but realistic mathematical model constructed on experimental data of Ca2+–CaM–Ng and Ca2+–CaM–PEP-19 interactions and investigate kinetic mechanisms through which these IQ-motif proteins regulate the steady-state level and the temporal profiles of intracellular free Ca2+. The paper is organized as follows. We first describe an experimentally constrained mathematical model of Ca2+–CaM–Ng interactions (see Mathematical model in METHODS, Fig. 1, and Table 1). We also introduce a simple single-compartment model of Ca2+ dynamics with or without Ca2+ injection and extrusion mechanisms (see Compartment model of spine Ca2+ dynamics in METHODS and Fig. 2). In Ca2+ buffering capacity and Ng (METHODS) and Fig. 3, we calculate the buffering capacity of CaM and explain the mechanistic principle through which Ng influences the Ca2+ buffering capacity. We then use a kinetic model to dissect the mechanism by which IQ-motif proteins control the steady-state level of free Ca2+ concentration (Fig. 4 and Table 1 for the parameter values). Using the simple single-compartment model with Ca2+ injection and extrusion mechanisms, we study how Ng regulates the temporal profile of free Ca2+ during oscillatory Ca2+ stimulations (Fig. 5). We also include results using a mutant Ng (PEP-19–like protein) to understand the kinetic mechanism by which Ng controls the free Ca2+ transient. These simulation results demonstrate that both association and dissociation pathways of Ca2+ from CaM influence the temporal dynamics of free Ca2+. In particular, the model shows that PEP-19–like protein produces an impact that is significantly different from that of Ng on the intracellular free Ca2+ dynamics (Fig. 6). Our analysis indicates Ng has the potential to shape the intracellular Ca2+ profile in neurons through its effects on the Ca2+-binding properties of CaM.
FIG. 1.

Mathematical model. A: reaction scheme of the neurogranin–calmodulin (Ng–CaM) interactions. C-terminal lobe and N-terminal lobe of CaM bind 2 Ca2+ ions (horizontal arrows). We assume the binding of Ca2+ to each lobe is relatively independent (C-lobe: top; N-lobe: bottom). Ng interacts with and binds the C-domain of CaM and accelerates Ca2+ dissociation from it (thick horizontal arrow in top panel). There is presently no experimental result indicating that Ng binds to or affects Ca2+-binding to the N-lobe of CaM. Therefore we assume no binding of Ng to the N-terminal lobe (i.e., no vertical arrows in bottom panel). Each arrow in the figure is marked by symbols, k1, k−1, k2, k−2, k3, k−3, k4, k−4, k5, k−5, k6, k−6, k7, k−7, k8, k−8, k9, and k−9, which we also use to indicate the corresponding reaction rate. Positive number subscript indicates a binding reaction, whereas the negative number subscript is for a dissociation reaction (Table 1). Units of reaction rates are μM−1 · s−1 for association and s−1 for dissociation rate constants, respectively. B: parameter optimization of the model for Ng-induced Ca2+ dissociation from CaM shown in A. Experimental data shown were accomplished by rapidly mixing CaM (2 μM) and Ca2+ (100 μM) with (black open circles) or without (black plus signs) 50 μM of Ng, with 5 mM EGTA and the Tyr fluorescence signal from CaM was measured as an indication of Ca2+ dissociation specifically from the C-terminal lobe. See Gaertner et al. (2004) for more details. Results shown are from the ordinary differential equation (ODE) model using the parameter values listed in Table 1. Solid and dotted lines are simulations with 50 and 0 μM of Ng, respectively. Note, data shown from each experiment are from 5 stopped-flow injections, averaged, and then fit with single- or double-exponential curves. Relative error of the final model as compared with the “fitted curve” is <0.5% and they are virtually indistinguishable. For this reason, we chose to plot the “fitted curve” as circle/crosses (at discrete time points) and overlay them with the simulation results (solid/dotted lines). Ca2+-binding kinetics of EGTA used in the simulation were as follows: EGTA binds Ca2+ with a 1:1 stoichiometry and the Ca2+ association and dissociation rates are 55.8 μM−1 × s−1 and 2.12 s−1, respectively (Schuhmeier et al. 2003).
TABLE 1.
Parameters used in the model for Ng and PEP-19–like protein
| Parameter | Symbol | Ng | PEP-19 | Unit |
|---|---|---|---|---|
| C-lobe of CaM | ||||
| Ca2+ binding to CaM | k1 | 426 | 426 | μM−1 · s−1 |
| k2 | 21 | 21 | μM−1 · s−1 | |
| Ca2+ binding to CaM–Ng | k8 | 426 | 426 | μM−1 · s−1 |
| k9 | 21.5 | 630 | μM−1 · s−1 | |
| Ca2+ dissociation from CaM | k −1 | 5,115 | 5,115 | s−1 |
| k −2 | 8.5 | 8.5 | s−1 | |
| Ca2+ dissociation from CaM–Ng | k −8 | 5,830 | 5,115 | s−1 |
| k −9 | 418 | 255 | s−1 | |
| Ng binding to apo-CaM | k5 | 28 | 28 | μM−1 · s−1 |
| Ng binding to (Ca2+)-CaM | k6 | 23 | 28 | μM−1 · s−1 |
| Ng binding to (Ca2+)2-CaM | k7 | 2 | 28 | μM−1 · s−1 |
| Ng dissociation from apo-CaM | k −5 | 36 | 36 | s−1 |
| Ng dissociation from (Ca2+)-CaM | k −6 | 35 | 36 | s−1 |
| Ng dissociation from (Ca2+)2-CaM | k −7 | 136 | 36 | s−1 |
| N-lobe of CaM | ||||
| Ca2+ binding to CaM | k3 | 500 | 500 | μM−1 · s−1 |
| k4 | 500 | 500 | μM−1 · s−1 | |
| Ca2+ dissociation from CaM | k −3 | 16,000 | 16,000 | s−1 |
| k −4 | 2,000 | 2,000 | s−1 | |
N-terminal kinetic rates are not affected by IQ-motif proteins. Symbols for each kinetic rate are indicated in Fig. 1A.
FIG. 2.

Single-compartment model of the Ca2+, CaM, and Ng system. A: closed system has no Ca2+ injection or extrusion pathways. B: open system with Ca2+ injection and extrusion mechanisms. Ca2+ injection was modeled by an N-methyl-D-aspartate (NMDA) receptor like Ca2+ channel found in the postsynaptic spine of hippocampal CA1 pyramidal neurons. We model extrusion as a simple Ca2+ decay term.
FIG. 3.
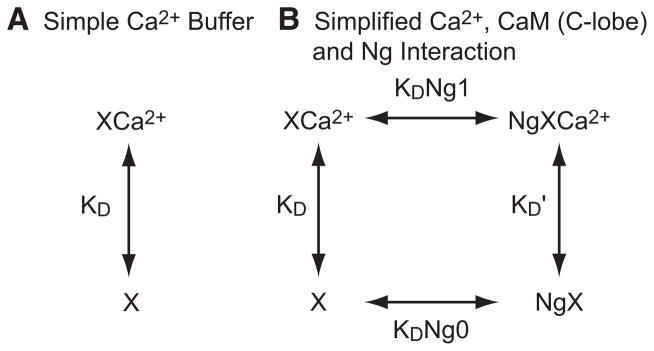
Modulation of Ca2+ buffering by Ng. A: Ca2+-binding protein X alone or (B) with interacting Ng. B: XCa2+, Ng · X, and Ng · XCa2+ represent Ca2+-bound buffer X, Ng–X complex (Ca2+ free), and Ng–Ca2+–X complex, respectively. Ng binds both apo- and Ca2+-bound buffer X with different dissociation constants KDNg1 and KDNg0 (μ M), respectively. Ca2+ dissociation constant of X and Ng· X are KD and K′D (μM), respectively. Free Ca2+ and free Ng are omitted for the purpose of illustration.
FIG. 4.

Ng increases the steady-state level of free Ca2+ concentration. 20 μM CaM and 0 μM (dots), 20 μM (crosses) and 100 μM (open circles) of Ng were mixed in the presence of varying concentrations of Ca2+ (x-axis, 0.1–100 μM). Steady-state level of free Ca2+ was plotted against the total Ca2+ in the simulation (CaM bound or free). Accelerated Ca2+ dissociation from CaM induced by Ng resulted in an increased steady-state level of free Ca2+. Increasing Ng concentration led to increased amounts of free Ca2+. This effect of Ng, however, becomes saturated for Ng ≳ 100 μM (data not shown).
FIG. 5.

Free Ca2+ and CaM-bound Ca2+ dynamics driven by oscillatory Ca2+ injections of different frequencies. 20 μM of CaM and 100 μM (solid line) or 0 μM (dotted line) of wild-type Ng were included in the single-compartment model of postsynaptic spine Ca2+ dynamics (see Compartment model of spine Ca2+ dynamics in METHODS; see Fig. 2B). Ca2+ ions were introduced to the compartment by NMDA-receptor–like current injections at the identified frequencies [1 Hz (A and B), 5 Hz (C and D), and 100 Hz (E and F)]. Temporal evolutions of the CaM-bound Ca2+ (A, C, and E) and free Ca2+ (B, D, and F) are shown. CaM-bound Ca2+ here also includes the CaM–Ng–Ca2+ triple complex.
FIG. 6.

Free Ca2+ and CaM-bound Ca2+ dynamics driven by oscillatory Ca2+ injections of different frequencies in the presence of PEP-19 (like protein). 20 μM of apo-CaM and 100 μM (solid line) or 0 μM (dotted line) of PEP-19 (like protein) were included in the single-compartment model of postsynaptic spine Ca2+ dynamics (Fig. 2B). Ca2+ ions were introduced to the compartment by NMDA-receptor–like current injections at 1 Hz (A and B), 5 Hz (C and D), and 100 Hz (E and F). Temporal evolutions of the CaM-bound Ca2+ (A, C, and E) and free Ca2+ (B, D, and F) are shown. CaM-bound Ca2+ here also includes CaM–PEP-19 (like protein)–Ca2+ triple complex. Note the dotted lines in Fig. 6 are identical to those of Fig. 5 (without Ng).
Finally, we compare the model predictions with two genetic knockout studies of Ng (Gerendasy et al. 1994; Huang et al. 2004; Krucker et al. 2002; van Dalen et al. 2003). The free Ca2+ dynamics measured in neurons from these two genetic strains of mice and the model predictions from our work are all in agreement. The present modeling work indicates Ng increases the peak or rising phase of free Ca2+ concentrations, whereas it reduces the peak of Ca2+–CaM activation (Fig. 5). We evaluate the outcome of these seemingly opposite impacts of Ng on the induction of synaptic plasticity and the results identify that Ng may function as a key regulator of synaptic metaplasticity.
METHODS
Mathematical model
CaM is a bilobed molecule that has two Ca2+-binding sites within each lobe and Ng interaction with CaM was shown experimentally to increase the rate of Ca2+ dissociation from the sites in the C-terminal lobe (Gaertner et al. 2004). Figure 1A shows how this kinetic mechanism is modeled. Each lobe of Ng-free CaM has three different states dependent on the number of bound Ca2+ ions: (apo)-CaM, (Ca2+)-CaM, and (Ca2+)2-CaM (horizontal arrows in Fig. 1A). Ng binds each of these three states of the C-lobe of CaM with different affinities (vertical arrows in the top diagram of Fig. 1A). Ng changes CaM’s affinity toward Ca2+ by increasing the dissociation rate (k−9, the thick horizontal arrow in the C-lobe kinetic pathway; Fig. 1A) but it does not change the Ca2+ association rate (Gaertner et al. 2004). We assume Ng affects only the C-lobe of CaM, as supported by present experimental evidence (Gaertner et al. 2004; Putkey et al. 2003). Thus each CaM molecule undergoes transitions between 18 (6 × 3) activation states involving association and dissociation of Ca2+ and Ng (6 different states for the C-terminal lobe and 3 for N-lobe). We constructed an ordinary differential equation (ODE)–type model based on this kinetic scheme.
The parameter values were optimized for experimental data in a systematic manner. The kinetic parameters for Ca2+–CaM interaction (k1, k−1, k2, k−2, k3, k−3, k4 and k−4 in Fig. 1A) were determined from experimental data (Gaertner et al. 2004). For Ng, the following data are available: the forward and backward reaction rates of 1) apo-CaM binding to Ng and 2) Ca2+ association to and dissociation from CaM in the presence of Ng. All parameter values are constrained by microscopic reversibility and this thermodynamic principle helped reduce the number of unknown parameters. Because Ng did not change the Ca2+ association rates, we were left with four unknown parameters (k−8, k−9, k6, and k7 in Fig. 1A). The rates k−6 and k−7 were calculated from microscopic reversibility. We used a brute force stochastic parameter search from a slate of 108 different parameter sets followed by nonlinear least-square methods (e.g., Levenberg–Marquardt and trust region method implemented in the MATLAB Optimization Toolbox, The MathWorks). The final 100 candidate parameter values were tested against experimental data and the best parameter set was chosen (Table 1). Figure 1B illustrates the goodness of fit of the model (solid and dashed line) with experimental data of EGTA-induced Ca2+ dissociation from CaM (circles and squares) with or without Ng. Note that the experimental data shown in Fig. 1B generate the double-exponential curve fit to the average of five stopped-flow injections collected at room temperature (see Gaertner et al. 2004). All parameter optimizations were accomplished by using “fitted curves” from the raw data.
Compartment model of spine Ca2+ dynamics
The resultant ODE model from the previous section is a closed system. There is no Ca2+ injection or Ca2+ extrusion mechanism (Fig. 2A). Ca2+ is removed from the free Ca2+ pool by the association reaction (i.e., CaM binding) and increased through the dissociation reaction. Note the total amount of Ca2+ in the system remains constant. The ODE equation for the free Ca2+ is
| (1) |
in which Ca2+ association reaction removes free Ca2+ and the free Ca2+ increases when Ca2+ dissociates from proteins.
On the other hand, the Ca2+–CaM–Ng dynamics in a postsynaptic spine (=nonequilibrium system), may be significantly different from that in a closed system. A model of Ca2+–CaM–Ng interaction that contains Ca2+ injection and Ca2+ extrusion mechanisms is required. However, the spine Ca2+ dynamics is a dauntingly complex process involving a large number of channels, pumps, and signaling molecules and we do not intend to model all of these processes. In particular, CaM interacts with channels and pumps and modulates their function (Liang et al. 2003; Penniston and Enyedi 1998). How and to what extent Ng influences CaM–pump and CaM–channel interaction is still unknown. For these reasons, we constructed a simple model of spine Ca2+ dynamics for the purposes of this study (Fig. 2B) similar to that used previously (Cai et al. 2006; Shouval et al. 2002). In this model, a single compartment of homogeneous spine Ca2+ dynamics was formulated under two assumptions. First, the primary Ca2+ source is through N-methyl-D-aspartate (NMDA) receptors. The kinetics of NMDA current is characterized by a double exponential of the form
| (2) |
where t is time and V ≡ V(t) is the (time-varying) postsynaptic membrane potential. The voltage dependence of NMDA channels is described by B(V) (Jahr and Stevens 1990; Shouval et al. 2002), and parameters used are If = 0.7, τf = 0.032 s, and τs = 0.16 s (fast and slow time constants) (Cai et al. 2006), with approximate calcium reversal potential Vr = 130 mV and a conductance GNMDA that was defined in Shouval et al. (2002). θ(t) = 1 when t ≥ 0; otherwise θ(t) = 0. Second, the Ca2+ dynamics is modeled by a single first-order ODE
| (3) |
with the time constant τCa = 0.02–0.05 s (Majewska et al. 2000; Sabatini et al. 2002; Scheuss et al. 2006). In Fig. 2B, we use a modified version of this single-compartment model. First, we use the same Ca2+ injection mechanism (Eq. 2) as Shouval et al. (2002). As stated, Shouval et al. (2002) collapsed all Ca2+ extrusion processes, which include Ca2+ buffers, Ca2+ pumps, and diffusion-dependent escape of Ca2+ ions, into a single empirical decay term (the second term on the right-hand side of Eq. 3). Combining this single-compartment model with our Ca2+–CaM–Ng ODE model requires a careful adjustment of the Ca2+ decay term because CaM is a major endogenous Ca2+ buffer of the spine. We decided to use τCa = 0.015 s as our decay time constant so that the overall Ca2+ decay profile of the model becomes consistent with experimental measurement (Majewska et al. 2000; Sabatini et al. 2002; Scheuss et al. 2006). The resultant equation for the free Ca2+ is
| (4) |
The first and second terms on the right side of Eq. 4 correspond to Ca2+ injection and Ca2+ extrusion, respectively (vertical arrows, Fig. 2B). Once fixed, these parameter values were unchanged throughout all simulation experiments. The steady-state free Ca2+ concentration (Fig. 3) was calculated by running a long simulation and/or by numerical bifurcation analysis (e.g., XPP-Auto and MATCONT) (Dhooge et al. 2003; Ermentrout 2002). All methods converge to the same steady-state value.
Ca2+ buffering capacity and Ng
How does the Ca2+ buffering capacity of CaM influence transient dynamics of free Ca2+ and to what extent does Ng modulate free Ca2+ transients through interacting with CaM? Numerical simulation is the most accurate way to address these questions; however, simple mathematical formulas will be useful to gain insight and understand the qualitative influence that Ng and CaM have on free Ca2+ transients. As in the classical theory of Ca2+ buffering (Neher and Augustine 1992), we assume Ca2+ equilibrates with an endogenous Ca2+-binding protein X much faster than the rest of the Ca2+ dynamics, such as Ca2+ extrusion. Here we introduce the Ca2+ buffering capacity (κE, unitless) of endogenous buffer X (Neher and Augustine 1992)
| (5) |
where [XT] is the total concentration (μM) of endogenous buffer, [XCa2+] is the concentration of Ca2+ bound buffer (μM) and KD is the dissociation constant (μM) and [XCa2+] ≡ [XT] · [Ca2+]/([Ca2+] + KD) (Fig. 3A). In other words, the buffering capacity (kE) is the ratio of the change in [XCa2+] and the change in free Ca2+ concentration
| (6) |
If X is the only Ca2+-binding protein in the system, we replace the last two terms in Eq. 4 [i.e., − (association reaction) + (dissociation reaction)] with [−(d[XCa2+]/dt)] and rearrange the equation to obtain
| (7) |
Here we approximate the buffering capacity as a constant within the dynamic range of Ca2+ signals. If we have more than one, say N number of, Ca2+ buffers (or Ca2+-binding sites), we replace β = 1 + κE with in Eq. 7, a linear sum of buffering capacity for all Ca2+-binding proteins (or binding sites) (see Eq. 13 for cooperative Ca2+ binding).
Equation 7 can be solved and we have
| (8) |
where [Ca2+]0 is the basal Ca2+ concentration (at time t = 0). Equation 8 is a key formula describing the effect of buffering capacity (κE in β =1 + κE) on the Ca2+ transient for a given Ca2+ injection [e.g.,INMDA(t)]. For the simplicity of the theory, the NMDA current defined in Eq. 2 can be approximated by a double-exponential function
| (9) |
where Qf and Qs represent the amplitude of the fast and slow components of NMDA currents and τf and τs are the corresponding time constants, respectively. By plugging this equation in Eq. 9, the [Ca2+] transient is
| (10) |
The resultant Ca2+ transient has three decay time constants, one of which depends linearly on the buffering capacity (κE) as β = 1 + κE. The peak amplitude of the Ca2+ transient is inversely proportional to the linear function of the buffering capacity as well. This equation suggests higher buffering capacity leads to lower peak amplitude and slower decay rate of the free Ca2+ transient.
What is the effect of Ng? What will Eq. 8 or Eq. 10 look like if we add Ng? As explained in Fig. 1, the interaction of Ng and CaM (C-lobe) is complicated. Intuitively, the decrease in Ca2+ affinity of CaM in the presence of Ng implies Ng also decreases the Ca2+ buffering capacity of CaM. To explain this mechanism, we use a simplified kinetic scheme to derive a mathematical formula (Fig. 3B). Here we can think of Ca2+ buffer X as the Ca2+-binding sites in the C-lobe of CaM. Ng binds this buffer X in the presence and absence of Ca2+ but with dissociation constants KDNg1 and KDNg0 (μM), respectively (the horizontal arrows in Fig. 3B). The Ca2+ dissociation constants of Ng free and Ng-bound buffer X are KD and K′D (μM), respectively (the vertical arrows in Fig. 3B). Applying microscopic reversibility (KD · KDNg1 = K′D · KDNg0) and simple steady-state analysis, we have
| (11) |
where [Ng] and [Ng · XCa2+] represent the concentration (μM) of (free) Ng and Ng–X–Ca2+ complex, respectively. In other words, the “bulk” Ca2+ dissociation constant K of CaM in the presence of Ng is
| (12) |
which is usually larger than KD because apo-CaM has a higher affinity toward Ng than Ca2+ bound CaM (K DNg0 < KDNg1). Plugging Eq. 12 in Eq. 5 gives an approximate buffering capacity of CaM in the presence of Ng and explains why Ng reduces the buffering capacity. Going back to Eq. 10, this simple theory indicates that Ng will increase the peak amplitude and Ca2+ decay rate for a single NMDA stimulation. We will subsequently test this prediction (see, for example, 1-Hz stimulation in Fig. 5B).
So far, we have derived the buffering capacity (κE) for single or multiple independent Ca2+-binding sites. We have not considered the case where the binding of first Ca2+ ion increases the affinity for the second Ca2+ as in CaM. This process is modeled as a sequential Ca2+ binding to each lobe (see the horizontal arrows without Ng in Fig. 1B). The extension of Eq. 5 is straightforward from the steady-state analysis of this kinetic scheme. The new formula for the buffering capacity (κE) of the C- or N-terminal lobe of CaM (represented by X) is
| (13) |
where [XT] is the total concentration (μM) of C-terminal or N-terminal lobe of CaM and KD1 and KD2 are the two macroscopic dissociation constants (μM) of each lobe (KD1 = k−1/k 1 and KD2 = k−2/k2 for C-terminal lobe and KD1 = k−3 /k3 and KD2 = k−4/k4 for N-terminal lobe; see Fig. 1). Using the estimated CaM concentrations in CA1 pyramidal neurons (~37–100 μM; see INTRODUCTION) and Eq. 5, we estimate the buffering capacity due to CaM is about 32–87 ([Ca] = 0.1 μM). If we use Eq. 13, the buffering capacity is about 12–33. The former is higher than and the latter is close to the experimentally measured buffering capacity in the dendrites of CA1 neuron (κE = 20) (Sabatini et al. 2002).
Synaptic weight function
In the present work, we use the “synaptic weight function” developed in Shouval et al. (2002) to assess the impact that Ng might have on the induction of synaptic plasticity. This is a simple mathematical formalism that was shown to explain the relation between synaptic Ca2+ (or Ca2+–CaM) input and bidirectional synaptic plasticity. This formalism is based on the Ca2+ control hypothesis: the elevation of Ca2+ is the primary signal for synaptic plasticity. The validity of this formalism has been tested with diverse induction protocols (Cai et al. 2006; Shouval et al. 2002). In this formalism, a new variable W (synaptic weight, unitless) is introduced that obeys a first-order ODE
| (14) |
where η determines a Ca2+-dependent “learning rate” (i.e., speed at which the synaptic weight W approaches the steady state), which in turn is determined by a nonlinear function of Ca2+ (Ω). These Ca2+-dependent functions are defined as follows
| (15) |
and
| (16) |
where sig (x, β) = exp(βx)/[1 + exp(βx)], α0 = 0.333, α1 = 0.8, α1 =1.2, β1 = 32, β2 = 16, p1 = 1, p2 = 2.8, p3 = 3, and p4 = 0.00001 (partially modified from Cai et al. 2006 and used for Fig. 7A). In the present work, we use the free Ca2+ transient (Fig. 7A) or CaM-bound Ca2+ (Fig. 7B) as an input to Eq. 14 and calculate the ratio of the weight function W before [i.e., W(0) = 1] and after the Ca2+ stimulations (900 pulses for 0.5, 1, 2, 5, and 10 Hz; 100 pulses for 100 Hz). In Fig. 7B, we set α0 = 0.333, α1 = 2.5, α2 = 4, β1 = 2, β2 = 1, p1 = 1, p2 = 10, p3 = 3, and p4 = 0.00001 as we change the input from free Ca2+ to CaM-bound Ca2+. The parameters α1 and α2 can be determined by the peak value of free Ca2+ (Fig. 7A) or CaM-bound Ca2+ (Fig. 7B) at 1 Hz (Fig. 5, A and B): α1 is set lower than the peak values with or without Ng and α2 is higher than both of these peak values. The parameters β1 and β2 determine the sharpness of the Ω function (Eq. 15). The higher the β1 (and β2), the sharper the curve of the omega function (i.e., the deeper the depression). If β1 and β2 are too small, the omega function becomes shallow and there would be no LTD induction (Shouval et al. 2002). This defines the lower limit for beta parameters (β1 and β2). For each value of β1 and β2, we needed to calibrate the p2 value to avoid undesirable rapid declines and oscillations of the synaptic weight function (Shouval et al. 2002). The remaining parameter values are the same as in Cai et al. (2006). We also impose that β1 = 2β2 as in Cai et al. (2006). As long as α1, α2, β1, β2, and p2 obey these constraints (α1 = 0.8, α2 = 1.2, 2.5 < β2 [< 40, and 1 < β2 = 3.5 for Fig. 7A and α1 = 2.5, α2 = 4, 0.7 < β2 < 40, and 1 < p2 < 11 for Fig. 7B), the qualitative results presented in Fig. 7, A and B are robust.
FIG. 7.

Frequency-dependent induction of synaptic plasticity simulated with and without Ng. y-axis represents normalized synaptic weight (final/initial) at the end of the induction protocol used in the simulated gene knockout experiments. Values <1 are indicative of depression, whereas those >1 are indicative of potentiation. Synaptic strength function (W) was calculated either from the free Ca2+ transient (A) or Ca2+-saturated CaM (B) as inputs. Single-compartment model that contains 100 μM of Ng (circles and solid line) was compared with a model without Ng (crosses and dashed line). Former model is analogous to data examining the induction of synaptic plasticity in wild-type mice and the latter represents data from the Ng knockout mice. Synaptic strength was calculated for 0.5, 1, 2, 5, 10, and 100 Hz. Low-frequency induction protocol (0.5–10 Hz) was simulated for 900 pulses, whereas 100 pulses were applied at 100 Hz.
RESULTS
Steady-state analysis of the free Ca2+
Having established the kinetic pathway and the corresponding parameter values (see Mathematical model in METHODS), we investigated the influence of Ng on the equilibrium steady-state free Ca2+. In this series of numerical simulations, the model is a closed system and does not contain Ca2+ injection or extrusion mechanisms (Fig. 2A). In Fig. 4, we mixed 20 μM of CaM and a fixed (total) amount of Ca2+ (0–100 μM) in the presence of 0 μM (dots and line), 20 μM (crosses and line), and 100 μM (open circles and line) Ng at the beginning of the simulations. The final steady-state level of free Ca2+ (the vertical axis) was then plotted against the total amount of Ca2+ (the horizontal axis) injected at time = 0. The range of (total) Ca2+ concentrations used here spans the levels of Ca2+ transients measured in the dendritic spine (Majewska et al. 2000; Sabatini et al. 2002; Scheuss et al. 2006).
As shown in Fig. 4, Ng increases the steady-state level of free Ca2+ in an Ng-concentration–dependent manner. Even in the presence of 20 μM Ng, this effect is prominent for all total Ca2+ concentrations tested (0–100 μM). On the other hand, there is no further increase in the free Ca2+ even if we raise the Ng concentration beyond about 100–120 μM (data not shown). In other words, under these system parameters, the effect of Ng is saturated at about 100 μM. For perspective, the estimated concentration of Ng in the dendritic spine is ≳ 65 μM (Huang et al. 2004). Note, however, Ng is subject to various posttranslational modifications including oxidation and protein kinase C (PKC)–mediated phosphorylation, both of which reduce its interaction with CaM (Gerendasy et al. 1994; Huang et al. 2004; Krucker et al. 2002; van Dalen et al. 2003). These posttranslational modifications will influence the intracellular free Ca2+ by tuning Ng’s capacity to bind CaM.
What is the mechanism by which Ng controls the free Ca2+? We have indicated that Ng, on binding the C-lobe of CaM, increases the Ca2+ dissociation (thick leftward horizontal arrow in the top diagram, Fig. 1A). This leads to a reduced amount of Ca2+-bound CaM; as a result, it increases the free Ca2+. In other words, the change in Ca2+ dissociation constant at the C-lobe (=k−9/k9) will influence the free Ca2+ concentration. In fact, Gerendasy (1999) has already confirmed this view. An interesting example is PEP-19, another IQ-motif protein that has an impact on the Ca2+-binding properties of CaM different from that of Ng. PEP-19 increases (~30- to 40-fold) both the Ca2+ association rate (k9) and dissociation rate (k−9) of CaM to a similar degree (see Table 1) (Putkey et al. 2003). Because PEP-19 does not change the dissociation constant (k−9/k 9), the steady-state level of free Ca2+ will remain the same. The numerical simulation of PEP-19–like protein confirmed this conclusion as well (data not shown).
Ng accelerates the free Ca2+ decay dynamics
So far, we have analyzed the behavior of the Ca2+–CaM–Ng system in a closed compartment. The system has neither time-varying Ca2+ injection nor Ca2+ extrusion pathways (Fig. 2A). In addition, we have focused only on the steady state but not the transient dynamics of the system. In this section, we investigate the role of IQ-motif proteins (Ng and PEP-19) in regulating the level of free Ca2+ during oscillatory Ca2+ stimulations.
Figure 5A shows the temporal evolution of CaM-bound Ca2+ during 1-Hz NMDA-receptor–like Ca2+ stimulation with different concentrations of Ng: 0 μM (dotted line) and 100 μM (solid line). In these analyses, CaM-bound Ca2+ indicates all Ca2+ ions bound to CaM molecules irrespective of whether they are associated with Ng. As explained earlier, Ng increases the Ca2+ dissociation rate from the C-lobe of CaM. In this open system, once released from CaM, Ca2+ becomes available for the Ca2+ extrusion mechanism (Fig. 2B). Thus the peak amplitude of CaM-bound Ca2+ is lower and its decay dynamics is faster in the presence of Ng (see the downward arrow during the second Ca2+ pulse in Fig. 5A). On the other hand, Fig. 5B shows that the peak amplitude of the free Ca2+ is higher with Ng (100 μM, the solid line) than without Ng (the dotted line). The difference is indicated by the thick leftward horizontal arrow for 100 μM Ng and the thin rightward horizontal arrow for CaM alone. This result occurs because more Ca2+ ions remain CaM bound when Ng is absent (Fig. 5A). Equations 10 and 12 in METHODS also predicted the same outcome. Ng reduces the buffering capacity of CaM and thereby influences both the amplitude and decay rate of Ca2+ transients. Biochemical insight from Fig. 5A and the mathematical formula converge to the same free Ca2+ dynamics (Fig. 5B). Note that the total amount of CaM in the system is 20 μM, which binds 80 μM of Ca2+ and, at 1-Hz stimulation, the Ca2+-binding capacity of CaM was not saturated (see Fig. 5A). Note the binding capacity used here to quantify the total number of available Ca2+-binding sites on CaM is different from the “buffering capacity” defined in METHODS. Again, as predicted, the decay of the free Ca2+ is also faster in the presence of Ng: the decay starts from a higher level and reaches the basal level in a shorter time window (Fig. 5B).
What if we change the frequency of Ca2+ stimulation? In the mathematical formula presented in METHODS (Eq. 10), we have explored Ca2+-influx due to only a single NMDA current injection, which may be relevant during 1-Hz stimulation (Fig. 5, A and B) where temporal summation is not evident. In Fig. 5, C and D we examine the temporal dynamics of CaM-bound and free Ca2+ when 5-Hz stimulation is applied. Under this condition, the average level of CaM-bound Ca2+ transient is higher without Ng (dotted line in Fig. 5C) than with Ng (100 μM, solid line in Fig. 5C). The decay dynamics of CaM-bound Ca2+ is slightly faster in the presence of Ng, although not as prominent as that in Fig. 5A (1 Hz). The binding capacity of CaM for Ca2+ (total amount 20 μM, which binds 80 μM of Ca2+) is not saturated at this frequency. The free Ca2+ dynamics requires a careful inspection at 5 Hz (Fig. 5D). During the first four to five Ca2+ spikes, the peak value of the free Ca2+ in the presence of Ng exceeds that of CaM alone (see two thick rightward arrows for Ng plus CaM and two thin rightward arrows for CaM alone for the first two spikes, Fig. 5D). After this initial phase, the peak amplitudes of the free Ca2+ with or without Ng converge to the same value. However, the decay of the free Ca2+ is consistently faster with Ng; therefore the minimum level of the free Ca2+ concentration is lower with Ng (see leftward arrows in the figure; a thin leftward arrow for CaM alone and a thick leftward arrow for 100 μM Ng plus CaM).
The dynamics of the system under 100-Hz Ca2+ stimulation (for a total of 100 pulses) was next examined. As shown in Fig. 5E, the CaM-bound Ca2+ is lower in the presence of 100 μM (solid line) Ng than without Ng (dotted line). The total amount of Ca2+ injected during this higher-frequency stimulation is larger than that at lower frequencies (Fig. 5, A–D) but CaM’s Ca2+-binding capacity (total CaM concentration = 20 μM, which binds 80 μM Ca2+) has still not been exceeded (Fig. 5E). In fact, the plateau levels of CaM-bound Ca2+ and free Ca2+ are consistent with the bulk Ca2+ dissociation constant of CaM. The peak amplitudes of the free Ca2+ are the same with Ng (solid line in Fig. 5F) or CaM alone (dotted line in Fig. 5F). Again, the decay dynamics of the free Ca2+ is faster in the presence of Ng at the end of the 100-Hz stimulation noted by the small downward arrow between the dotted and solid lines during the declining phase of the free Ca2+.
In total, Ng increases the steady-state equilibrium level of free Ca2+ in a closed system (Fig. 2A). Ng accelerates the decay dynamics of the free Ca2+ in an open nonequilibrium system that contains a Ca2+ extrusion mechanism (Fig. 2B). As mentioned earlier, Ng increases the Ca2+ dissociation rate from the C-lobe of CaM. This kinetic mechanism of Ng–CaM interaction seems to underlie two opposite observations: one in a closed and the other in an open nonequilibrium system. Note that the total amount of Ca2+ influx is the same for 0 and 100 μM Ng in Fig. 5. In the absence of Ng, Ca2+ remains bound to CaM for a longer period of time, preventing its extrusion. Whereas the Ca2+ extrusion is significantly faster in the presence of 100 μM Ng (see the areas below dashed line and solid line in Fig. 5, A, C, and E; compare them with those in Fig. 5, B, D, and F).
PEP-19–like protein dampens the free Ca2+ response during low to intermediate frequencies of Ca2+ stimulation
What happens if we change both association and dissociation rates of Ca2+ binding to the C-lobe of the CaM–Ng complex while maintaining all other reaction rates the same? The PEP-19–like protein we discussed earlier represents such a simulated mutant molecule that interacts with CaM. PEP-19–like protein does not change the steady-state equilibrium of the free Ca2+. However, the accelerated Ca2+-binding rate of CaM–PEP-19–like protein (k9 = 630 μM−1 · s−1 in Table 1) may have a significant impact on the Ca2+ dynamics in a nonequilibrium system: it may increase the amount of Ca2+ absorbed by CaM during the rising phase of Ca2+ spike and thus reduce the free Ca2+ concentration.
Figure 6, A–F tests this possibility in the open system. All simulation conditions are otherwise the same as in Fig. 5. At 1-Hz Ca2+ stimulation, PEP-19–like protein increases the peak amplitude of CaM-bound Ca2+ (Fig. 6A; see the thick leftward and thin rightward horizontal arrows indicating the peak value with or without PEP-19–like protein, respectively). The CaM–Ca2+ decay dynamics is faster with PEP-19–like protein than without it: the decay starts from a higher level and reaches the basal level in a shorter time window (Fig. 6A). Consistent with an increased amount of CaM-bound Ca2+, PEP-19–like protein (100 μM) dampens the free Ca2+ response: the peak amplitude of the free Ca2+ is smaller than that without PEP-19–like protein (Fig. 6B).
This blunted response of the free Ca2+ becomes more prominent at 5-Hz Ca2+ stimulation (Fig. 6, C and D). For the first four to five spikes, the amount of CaM–Ca2+ with PEP-19–like protein (100 μM, solid line in Fig. 6C) exceeds that of CaM alone (dotted line in Fig. 5C; see two thick rightward arrows for PEP-19–like protein plus CaM and two thin right-ward arrows for CaM alone during the first two spikes). After this initial transient phase, the system reaches its asymptotic periodic dynamics and the peak CaM–Ca2+ values converge to the same level with or without PEP-19–like protein. Note this transient dynamics of CaM-bound Ca2+ is similar to the free Ca2+ dynamics in the presence of wild-type Ng (Fig. 5D). During the rising phase of the Ca2+ spike, PEP-19–like protein accelerates Ca2+ association to CaM (Fig. 6C), whereas wild-type Ng accelerates the accumulation of free Ca2+ (Fig. 5D) by increasing the Ca2+ dissociation from CaM. The dissociation of Ca2+ from the C-lobe of CaM is faster and the minimum level of CaM–Ca2+ is lower with PEP-19–like protein than with CaM alone (see two horizontal arrows in Fig. 6C: the thin leftward arrow for no PEP-19–like protein and the thick leftward arrow for 100 μM of PEP-19). Correspondingly, the peak of the free Ca2+ is lower and the minimum of the free Ca2+ is higher in the presence of PEP-19–like protein than with CaM alone (Fig. 6D). The response of free Ca2+ is “blunted” in the presence of PEP-19–like protein.
This effect of PEP-19–like protein is less significant at 100-Hz stimulation (100 pulses, Fig. 6, E and F). With a large influx of Ca2+ during this high-frequency stimulation, the system quickly approaches its steady-state level where PEP-19 (like protein) has no significant impact. Only the decay dynamics is faster with PEP-19 because the dissociation rate of Ca2+ from the C-lobe CaM–PEP-19 is increased approximately 30-fold (Fig. 6E). In summary, the effect of PEP-19–like protein is prominent at low (1 Hz) or intermediate (~5 Hz) Ca2+ stimulation and its effect is different from that of wild-type Ng.
Note that the PEP-19–like protein does not change the Ca2+ dissociation constant of CaM. The classical theory (see Ca2+ buffering capacity and Ng in METHODS) predicts no change in the buffering capacity of CaM in the presence of PEP-19–like protein (Eqs. 5 and 12). Equation 10 predicts no major change in Ca2+ transients. However, we have observed a significant impact of PEP-19–like protein in the numerical simulations. The peak amplitude of Ca2+ transients is decreased (Fig. 6B), which, according to the theory, looks as if PEP-19–like protein has increased the buffering capacity of CaM. The latter observation is not surprising because PEP-19 increases the association rate of Ca2+ to CaM. This accelerated Ca2+ binding results in a transient increase of CaM-bound (buffer-bound) Ca2+ before it relaxes to the equilibrium. In other words, the “rapid equilibrium” assumption (and/or subsequent approximation made in Eq. 6)—a critical prerequisite for the classical theory—is violated in the presence of PEP-19. This is why the classical theory fails to predict and is inconsistent with the numerical simulations.
Ng genetic knockout studies
Finally, we sought to compare the model predictions (Fig. 5) with experimental data. Two genetic knockout studies in mice (Huang et al. 2004; Krucker et al. 2002; van Dalen et al. 2003) confirmed that deletion of Ng reduced the free Ca2+ response. In one experiment (van Dalen et al. 2003), Ca2+ dynamics was measured in cultured neuron from wild-type and KO mice using fura-2–based microscopic imaging. The averaged peak amplitudes of Ca2+ during spontaneous and NMDA-receptor–activated stimulations were about 20% higher in the wild-type than in KO neurons. In Fig. 5B, we observed a similar (~20%) increase in the Ca2+ peak in the presence of Ng. Using independently produced Ng KO mice, Huang et al. (2004) measured fluorescence Ca2+ signals in the dendrites of hippocampal neurons. They found Ca2+ transients were about two- to threefold higher in wild-type than those of the mutants during both 100- and 5-Hz stimulations. Although the single-compartment model is oversimplified and the experimental conditions in these studies are different from our simulations, Fig. 5 qualitatively agrees with these Ca2+ imaging data.
DISCUSSION
In the present work, we have investigated several possible consequences of the biochemistry of IQ-motif–containing CaM-binding proteins. Ng and PEP-19 are the members of the IQ-motif protein family and these two proteins accelerate the Ca2+ dissociation from the C-terminal lobe of CaM (Gaertner et al. 2004; Putkey et al. 2003). We hypothesized these proteins may have a significant impact on the intracellular free Ca2+ by regulating the Ca2+ buffering capacity of CaM. The high concentration of CaM in hippocampal CA1 pyramidal neurons strongly suggests such a control mechanism may be important in these neurons. In a single-compartment closed model that has no Ca2+ extrusion mechanism, Ng increases the steady-state equilibrium free Ca2+ concentration (Fig. 4). With a Ca2+ extrusion mechanism present, Ng accelerates the decay dynamics of the free Ca2+ (Fig. 5). On the other hand, another IQ-motif binding protein, PEP-19, which does not change CaM affinity but speeds up both Ca2+ association and dissociation kinetics, leads to more efficient damping of the Ca2+ oscillations, but no changes in the steady-state Ca2+ levels.
The effect of Ca2+ buffer on the transient dynamics of free Ca2+ has important implications in cellular physiology and it has been a subject of numerous mathematical modeling studies (Franks and Sejnowski 2002; Gamble and Koch 1987; Gerendasy 1994; Gold and Bear 1994; Holcman et al. 2005; Holmes and Levy 1990; Lee et al. 2000b; Zador et al. 1990). Early modeling works (Gamble and Koch 1987; Gold and Bear 1994; Holcman et al. 2005; Holmes and Levy 1990; Zador et al. 1990) have suggested an impact that the endogenous buffer, especially CaM, may have on nonlinear Ca2+ dynamics in the dendritic spine. These modeling works, however, did not address a potential role of IQ-motif protein. On the other hand, Gerendasy (1999) explored the potential role of IQ-motif proteins and their impacts on the steady-state level of free Ca2+. This work suggested Ng might increase the free Ca2+ level, thereby activating Ca2+-dependent enzymes such as PKC. The present work extended the work by Gerendasy (1999) to a time-varying Ca2+ signal in a nonequilibrium system with the Ca2+ extrusion mechanism. Finally, the present work demonstrated a limitation of classical (linear) theory of Ca2+ buffering (PEP-19 in Fig. 6). The limitation of classical theory has been pointed out in several modeling works including that of Lee et al. (2000b) who investigated the influence that parvalbumin might have on Ca2+ decay dynamics in chromaffin cells. We have presented another example of a failure of classical theory caused by the CaM–IQ-motif protein interaction (Fig. 6).
The potential impact of Ng on the free Ca2+ concentration implicated by the modeling work is particularly intriguing. The free Ca2+ dynamics in the spine is the critical determinant of induction of either LTP or LTD (Yang et al. 1999). The impact of Ng on the Ca2+ dissociation rate from CaM strongly suggests that Ng plays an important role in synaptic plasticity. Interestingly, two knockout studies in mice confirmed that genetic disruption of Ng reduced the Ca2+ response to NMDA-receptor agonist (Huang et al. 2004; Krucker et al. 2002). In the simulations (Fig. 5, B, D and F), the removal of Ng attenuated the free Ca2+ response. Therefore with regard to the free Ca2+ dynamics, two knockout studies and the simulation results all agree.
What is the role that Ng plays in the induction of synaptic plasticity? The genetic knockout studies do not provide a clear answer to this question. One knockout study (Huang et al. 2004) showed a deficit in high-frequency–induced LTP, whereas the other knockout mice (Krucker et al. 2002) showed enhanced LTP induction. A brief discussion of the intertwined biochemical network that involves Ng might help illustrate the complexity of the problem. First and most important, Ng is phosphorylated by PKC (Huang et al. 2004; Xia and Storm 2005) and is dephosphorylated by PP2B and/or PP1 (Seki et al. 1995). Here we have a kinase–phosphatase system acting on the same substrate, Ng, and this system may exhibit zero-order ultrasensitivity (Goldbeter and Koshland 1981). Phosphorylation of Ng by PKC attenuates its interaction with CaM. Figure 5 suggests Ng increases free Ca2+ and decreases CaM-bound Ca2+ that would activate PKC and blunt the activation of PP2B, respectively. Ng occupies a key position of the nested signaling feedback loop in which CaM-dependent and CaM-independent Ca2+ signals intersect and influence each other. Thus Ng has a potential to shift the entire system dynamics toward LTP induction or to LTD induction through the CaM-dependent and CaM-independent signaling cascades.
Figure 7, A and B illustrates this point. Here we calculate the changes in synaptic strength using as input either free Ca2+ (Fig. 7A) or fully Ca2+ saturated CaM (Fig. 7B) during the induction protocol of plasticity. In other words, these simulations represent two extreme outcomes that Ng might have on the induction of plasticity. For this purpose, we used our current data (Fig. 5) and used an empirical mathematical formalism that has been tested with various induction protocols (Cai et al. 2006; Shouval et al. 2002) to estimate Ng’s impact on the induction of plasticity. This mathematical formalism (Eqs. 14–16, METHODS) was used to explain the relation between the input Ca2+ (or Ca2+–CaM) signal and bidirectional synaptic plasticity.
Figure 7A shows the ratio of synaptic strength before and after the induction of plasticity at different frequencies (0.5, 1, 2, 5, 10, and 100 Hz). In this figure, we calculate the synaptic weight function using the free Ca2+ transient as an input. A ratio >1 indicates LTP induction and <1 implies LTD induction. The crosses and dashed line indicate no Ng present (i.e., knockout animal), whereas the circles and solid line represent a model with 100 μM Ng (i.e., wild-type). In this simulation, Ng enhances LTP at higher frequencies (5, 10, 100 Hz). Ng does not influence LTD induction at lower frequencies. Figure 7A is reminiscent of the knockout study by Huang et al. (2004). On the other hand, Fig. 7B calculates the changes in the synaptic weight using CaM-bound Ca2+ as an input. In this case, LTP at high-input frequencies is attenuated by Ng. This result is reminiscent of that in Krucker et al. (2002), although their knockout mice show no change in low-frequency–induced LTD.
Note, in these simulations, we artificially uncoupled the CaM-dependent and CaM-independent Ca2+ signaling systems to independently assess each one’s potential role in modifying synaptic strength. This way, Fig. 7, A and B can represent two extreme impacts that Ng might have on LTP/LTD induction. If these two results were identical, we would be able to suggest a robust role of Ng in LTP/LTD induction despite the complex feedback network that involves Ng. However, these two simulations show almost opposite impacts on LTP induction. In other words, Ng could be a key (tunable) regulator of synaptic metaplasticity (Abraham and Bear 1996) and can differentially control the LTP/LTD threshold by potentially balancing the relative impact of two different Ca2+ signaling pathways: one CaM independent and one CaM dependent.
Finally, another implication of our modeling work is the difference between Ng and PEP-19. Ng is enriched in CA1 hippocampal pyramidal neurons, whereas PEP-19 is highly expressed in cerebellar Purkinje cells (Putkey et al. 2003; Xia and Storm 2005). In contrast to Ng, PEP-19 increases the dissociation rate as well as the association rate of Ca2+ to the same degree (Putkey et al. 2003). We found the impact of such a PEP-19–like protein is significantly different from that of Ng in both temporal and steady-state dynamics of free Ca2+, suggesting that Ng and PEP-19 may have distinctive effects on the intracellular metabolism of Ca2+ and that the physiological role of PEP-19 in cerebellar Purkinje cells (and other cells that contain PEP-19) may be different from that of Ng in hippocampal CA1 neurons. Purkinje cells contain large amounts of other Ca2+-binding proteins such as calbindin (Bainbridge et al. 1992) and simulation experiments with these Ca2+-binding proteins will be necessary to clarify their role in Purkinje cells. It would also be interesting to see how GAP43 (neuromodulin) (Xia and Storm 2005), another neuronal IQ-motif protein enriched in the presynaptic terminal, regulates the free Ca2+ dynamics.
Supplementary Material
Acknowledgments
We thank Dr. Ilyas Singec (Burnham Institute for Medical Research, La Jolla, CA) for insightful comments on the distribution of Ng and calbindin in hippocampal neurons.
GRANTS
This work was supported by National Institutes of Health Grants GM-069611 and NS-038310 and Institutional Training Grant on Neuroplasticity NS-041226 to Y. Kubota, during the early phase of this work.
References
- Abraham WC, Bear ME. Metaplasticity: the plasticity of synaptic plasticity. Trends Neurosci. 1996;19:126–130. doi: 10.1016/s0166-2236(96)80018-x. [DOI] [PubMed] [Google Scholar]
- Babu YS, Dack JS, Greenhough TJ, Bugg CE, Means AR, Cook WJ. Three-dimensional structure of calmodulin. Nature. 1985;315:37–40. doi: 10.1038/315037a0. [DOI] [PubMed] [Google Scholar]
- Bainbridge KG, Celio MR, Rogers JH. Calcium-binding proteins in the nervous system. Trends Neurosci. 1992;15:303–308. doi: 10.1016/0166-2236(92)90081-i. [DOI] [PubMed] [Google Scholar]
- Cai Y, Gavornik JP, Cooper LN, Yeung L, Shouval HZ. The effect of stochastic synaptic and dendritic dynamics on synaptic plasticity in visual cortex and hippocampus. J Neurophysiol. 2006;97:375–386. doi: 10.1152/jn.00895.2006. [DOI] [PubMed] [Google Scholar]
- Dhooge A, Govaerts W, Kuznetsov YA. MATCONT: a Matlab package for numerical bifurcation analysis of ODEs. ACM Trans Math Software. 2003;29:141–164. [Google Scholar]
- Ermentrout B. Simulating, Analyzing, and Animating Dynamical Systems: A Guide to XPP-Auto for Researchers and Students. Philadelphia, PA: Society for Industrial and Applied Mathematics; 2002. [Google Scholar]
- Franks KM, Sejnowski TJ. Complexity of calcium signaling in synaptic spines. Bioessays. 2002;24:1130–1144. doi: 10.1002/bies.10193. [DOI] [PMC free article] [PubMed] [Google Scholar]
- Gaertner TR. PhD thesis. Houston, TX: Univ. of Texas Houston Medical School; 2004. A Novel Mechanism for Regulation of Calmodulin Signaling by RC3. [Google Scholar]
- Gaertner TR, Putkey JA, Waxham MN. RC3/Neurogranin and Ca2+/calmodulin-dependent protein kinase II produce opposing effects on the affinity of calmodulin for calcium. J Biol Chem. 2004;279:39374–39382. doi: 10.1074/jbc.M405352200. [DOI] [PubMed] [Google Scholar]
- Gamble E, Koch C. The dynamics of free calcium in dendritic spines in response to repetitive synaptic input. Science. 1987;236:1311–1315. doi: 10.1126/science.3495885. [DOI] [PubMed] [Google Scholar]
- Gerendasy D. Homeostatic tuning of Ca2+ signal transduction by members of the calpacitin protein family. J Neurosci Res. 1999;58:107–119. [PubMed] [Google Scholar]
- Gerendasy DD, Herron SR, Watson JB, Sutcliffe JG. Mutational and biophysical studies suggest RC3/neurogranin regulates calmodulin availability. J Biol Chem. 1994;269:22420–22426. [PubMed] [Google Scholar]
- Gold JI, Bear MF. A model of dendritic spine Ca2+ concentration exploring possible bases for a sliding synaptic modification threshold. Proc Natl Acad Sci USA. 1994;91:3941–3945. doi: 10.1073/pnas.91.9.3941. [DOI] [PMC free article] [PubMed] [Google Scholar]
- Goldbeter A, Koshland DE. Sensitivity amplification in biochemical systems. Q Rev Biophys. 1981;15:555–591. doi: 10.1017/s0033583500003449. [DOI] [PubMed] [Google Scholar]
- Guadano-Ferraz A, Vinuela A, Oeding G, Bernal J, Rausell E. RC3/Neurogranin is expressed in pyramidal neurons of motor and somatosensory cortex in normal and denervated monkeys. J Comp Neurol. 2005;493:554–570. doi: 10.1002/cne.20774. [DOI] [PubMed] [Google Scholar]
- Helmchen F, Imoto K, Sakmann B. Ca2+ buffering and action potential-evoked Ca2+ signaling in dendrites of pyramidal neurons. Biophys J. 1996;70:1069–1081. doi: 10.1016/S0006-3495(96)79653-4. [DOI] [PMC free article] [PubMed] [Google Scholar]
- Holcman D, Korkotian E, Segal M. Calcium dynamics in dendritic spines, modeling and experiments. Cell Calcium. 2005;37:467–475. doi: 10.1016/j.ceca.2005.01.015. [DOI] [PubMed] [Google Scholar]
- Holmes WR, Levy WB. Insights into associative long-term potentiation from computational models of NMDA receptor-mediated calcium influx and intracellular calcium concentration changes. J Neurophysiol. 1990;63:1148–1168. doi: 10.1152/jn.1990.63.5.1148. [DOI] [PubMed] [Google Scholar]
- Huang K-P, Huang FL, Jager T, Li J, Reymann KG, Balschun D. Neurogranin/RC3 enhances long-term potentiation and learning by promoting calcium-mediated signaling. J Neurosci. 2004;24:10660–10669. doi: 10.1523/JNEUROSCI.2213-04.2004. [DOI] [PMC free article] [PubMed] [Google Scholar]
- Jahr CE, Stevens CF. Voltage dependence of NMDA-activated macroscopic conductances predicted by single-channel kinetics. J Neurosci. 1990;10:3178–3182. doi: 10.1523/JNEUROSCI.10-09-03178.1990. [DOI] [PMC free article] [PubMed] [Google Scholar]
- Kakiuchi S, Yasuda S, Yamazaki R, Teshima Y, Kanda K, Kakiuchi R, Sobue K. Quantitative determinations of calmodulin in the supernatant and particulate fractions of mammalian tissues. J Biochem. 1982;92:1041–1048. doi: 10.1093/oxfordjournals.jbchem.a134019. [DOI] [PubMed] [Google Scholar]
- Kim SA, Heinze KG, Waxham MN, Schwille P. Intracellular calmodulin availability accessed with two-photon cross-correlation. Proc Natl Acad Sci USA. 2006;101:105–110. doi: 10.1073/pnas.2436461100. [DOI] [PMC free article] [PubMed] [Google Scholar]
- Klee CB, Vanaman TC. Calmodulin. Adv Protein Chem. 1982;35:213–321. doi: 10.1016/s0065-3233(08)60470-2. [DOI] [PubMed] [Google Scholar]
- Krucker T, Siggins GR, McNamara RK, Lindsley KA, Dao A, Allison DW, de Lecea L, Lovenberg TW, Sutcliffe JG, Gerendasy DD. Targeted disruption of RC3 reveals a calmodulin-based mechanism for regulating metaplasticity in the hippocampus. J Neurosci. 2002;22:5525–5535. doi: 10.1523/JNEUROSCI.22-13-05525.2002. [DOI] [PMC free article] [PubMed] [Google Scholar]
- Lee SH, Rosenmund C, Schwaller B, Neher E. Differences in Ca2+ buffering properties between excitatory and inhibitory hippocampal neurons from the rat. J Physiol. 2000a;525:405–418. doi: 10.1111/j.1469-7793.2000.t01-3-00405.x. [DOI] [PMC free article] [PubMed] [Google Scholar]
- Lee SH, Schwaller B, Neher E. Kinetics of Ca2+ binding to parvalbumin in bovine chromaffin cells: implications for [Ca2+] transients of neuronal dendrites. J Physiol. 2000b;525:419–432. doi: 10.1111/j.1469-7793.2000.t01-2-00419.x. [DOI] [PMC free article] [PubMed] [Google Scholar]
- Liang H, DeMaria CD, Erickson MG, Mori MX, Alseikhan BA, Yue DT. Unified mechanisms of Ca2+ regulation across the Ca2+ channel family. Neuron. 2003;39:951–960. doi: 10.1016/s0896-6273(03)00560-9. [DOI] [PubMed] [Google Scholar]
- Majewska A, Brown E, Ross J, Yuste R. Mechanisms of calcium decay kinetics in hippocampal spines: role of spine calcium pumps and calcium diffusion through the spine neck in biochemical compartmentalization. J Neurosci. 2000;20:1722–1734. doi: 10.1523/JNEUROSCI.20-05-01722.2000. [DOI] [PMC free article] [PubMed] [Google Scholar]
- Malenka RC, Kauer JA, Perkel DJ, Mauk MD, Kelly PT, Nicoll RA, Waxham MN. An essential role for postsynaptic calmodulin and protein kinase activity in long-term potentiation. Nature. 1989;340:554–557. doi: 10.1038/340554a0. [DOI] [PubMed] [Google Scholar]
- Maravall M, Mainen ZF, Sabatini BL, Svoboda K. Estimating intracellular calcium concentrations and buffering without wavelength ratioing. Biophys J. 2000;78:2655–2667. doi: 10.1016/S0006-3495(00)76809-3. [DOI] [PMC free article] [PubMed] [Google Scholar]
- Murthy VN, Sejnowski TJ, Stevens CF. Dynamics of dendritic calcium transients evoked by quantal release at excitatory hippocampal synapses. Proc Natl Acad Sci USA. 2000;97:901–906. doi: 10.1073/pnas.97.2.901. [DOI] [PMC free article] [PubMed] [Google Scholar]
- Neher E, Augustine GJ. Calcium gradients and buffers in bovine chromaffin cells. J Physiol. 1992;450:273–301. doi: 10.1113/jphysiol.1992.sp019127. [DOI] [PMC free article] [PubMed] [Google Scholar]
- Nimchinsky EA, Sabatini BL, Svoboda K. Structure and function of dendritic spines. Annu Rev Physiol. 2002;64:313–353. doi: 10.1146/annurev.physiol.64.081501.160008. [DOI] [PubMed] [Google Scholar]
- Penniston JT, Enyedi A. Modulation of the plasma membrane Ca2+ pump. J Membr Biol. 1998;165:101–109. doi: 10.1007/s002329900424. [DOI] [PubMed] [Google Scholar]
- Popov N, Pohle W, Schulzeck S, Matthies H. A biochemical and immunohistological study of calmodulin in rat brain structures. J Hirnforsch. 1988;29:473–480. [PubMed] [Google Scholar]
- Putkey JA, Kleerekoper Q, Gaertner TR, Waxham MN. A new role for IQ motif protein in regulating calmodulin function. J Biol Chem. 2003;278:49667–49670. doi: 10.1074/jbc.C300372200. [DOI] [PubMed] [Google Scholar]
- Sabatini B, Oertner TG, Svoboda K. The life cycle of Ca2+ ions in dendritic spines. Neuron. 2002;33:439–452. doi: 10.1016/s0896-6273(02)00573-1. [DOI] [PubMed] [Google Scholar]
- Scheuss V, Yasuda R, Sobczyk A, Svoboda K. Nonlinear [Ca2+] signaling in dendrites and spines caused by activity-dependent depression of Ca2+ extrusion. J Neurosci. 2006;26:8183–8194. doi: 10.1523/JNEUROSCI.1962-06.2006. [DOI] [PMC free article] [PubMed] [Google Scholar]
- Schuhmeier RP, Dietze B, Ursu F, Lehmann-Horn F, Melzer W. Voltage-activated calcium signals in myotubes loaded with high concentrations of EGTA. Biophys J. 2003;84:1065–1078. doi: 10.1016/S0006-3495(03)74923-6. [DOI] [PMC free article] [PubMed] [Google Scholar]
- Seki K, Chen H-C, Huang K-P. Dephosphorylation of protein kinase C substrates, neurogranin, neuromodulin, and MARKCS, by calcineurin and protein phosphatases 1 and 2A. Arch Biochem Biophys. 1995;316:673–679. doi: 10.1006/abbi.1995.1090. [DOI] [PubMed] [Google Scholar]
- Shouval HZ, Bear MF, Cooper LN. A unified model of NMDA receptor-dependent bidirectional synaptic plasticity. Proc Natl Acad Sci USA. 2002;99:10831–10836. doi: 10.1073/pnas.152343099. [DOI] [PMC free article] [PubMed] [Google Scholar]
- Singec I, Knoth R, Ditter M, Volk B, Frotscher M. Neurogranin is expressed by principal cells but not interneurons in the rodent and monkey neocortex and hippocampus. J Comp Neurol. 2004;479:30–42. doi: 10.1002/cne.20302. [DOI] [PubMed] [Google Scholar]
- van Dalen JJW, Gerendasy DD, de Graan PNE, Schrama LH, Gruol DL. Calcium dynamics are altered in cortical neurons lacking the calmodulin-binding protein RC3. Eur J Neurosci. 2003;18:13–22. doi: 10.1046/j.1460-9568.2003.02720.x. [DOI] [PubMed] [Google Scholar]
- Xia Z, Storm DR. The role of calmodulin as a signal integrator for synaptic plasticity. Nat Rev Neurosci. 2005;6:267–276. doi: 10.1038/nrn1647. [DOI] [PubMed] [Google Scholar]
- Yang SN, Tang YG, Zucker RS. Selective induction of LTP and LTD by postsynaptic [Ca]i elevation. J Neurophysiol. 1999;81:781–787. doi: 10.1152/jn.1999.81.2.781. [DOI] [PubMed] [Google Scholar]
- Zador A, Koch C, Brown TH. Biophysical model of Hebbian synapse. Proc Natl Acad Sci USA. 1990;87:6718–6722. doi: 10.1073/pnas.87.17.6718. [DOI] [PMC free article] [PubMed] [Google Scholar]
Associated Data
This section collects any data citations, data availability statements, or supplementary materials included in this article.