Abstract
Changing the mechanical properties of the microbubble shell in response to a biochemical stimulus leads to vast changes in both ultrasound-induced bubble dynamics and contrast-enhanced ultrasound imaging. Here, DNA-coated microbubbles are shown to be a simple and highly versatile platform that can silence and re-activate contrast activity in response to the introduction and removal of biochemical stimuli.
Keywords: DNA recognition, Self-assembly, Sensors, Mechanical properties, Imaging agents
Imaging is a vital weapon in the clinician’s arsenal with uses at almost every stage of patient care, including routine screening, diagnostic testing, disease staging, surgical assistance, and post-treatment monitoring. Of the many imaging modalities available, ultrasound is one of the most widely employed. The incident sound waves are safe, penetrate deeply into most tissues, and provide millimeter resolution imaging, while multiple tests may be performed relatively cheaply and in real-time with equipment already present in most hospitals and clinics. The main drawback of ultrasound is poor sensitivity to abnormalities in tissue; as most tissues have similar densities and compressibilities only a small fraction of the incident sound is reflected back to the transducer.[1] To address this, colloids and particles with large differences in acoustic impedance, such as microbubbles,[2] emulsions,[3] and air-containing liposomes,[4] have been employed successfully as ultrasound contrast agents owing to their inherent ability to scatter sound more effectively. Gas-filled microbubbles in particular are especially effective for cardiovascular imaging, with success in applications such as determining the presence of thrombosis[5] or malignant prostate carcinomas.[6] Recent advances have included the addition of targeting ligands to the contrast agent to enhance their accumulation in a specific area.[2b, 3a, 7] However, a contrast agent that activates only in the presence of specific biomarker would relay a positive (bright) signal instead of a void (dark), reducing background and allowing a clinician to distinguish a growing area of inflammation from an imaging artifact or acoustic shadowing. For example, microbubbles that become active only in the presence of thrombin, a biomarker for the clotting cascade, would allow imaging of small but growing clots that are difficult to image by standard methods for early detection of malignant thrombosis.[8]
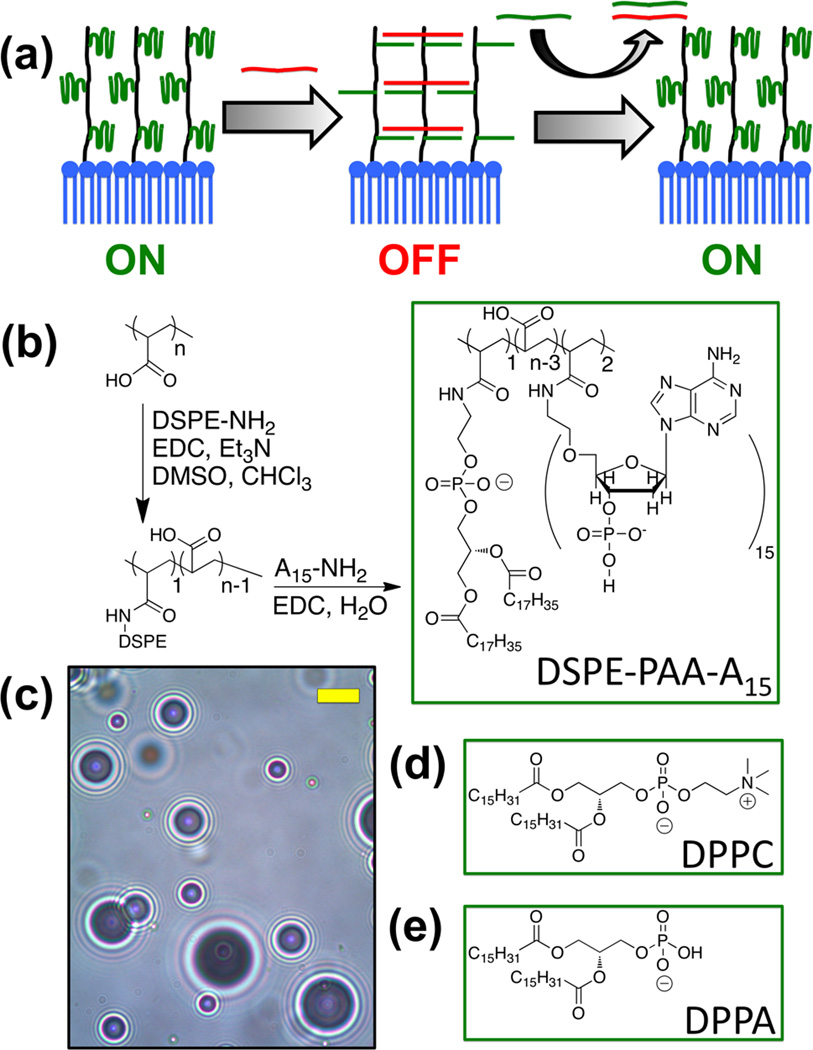
To reduce the potential for non-specific background signal, we have designed a strategy to create “smart” contrast agents that only enhance ultrasound signal in a specific chemical environment through modulation of nonlinear echoes. In response to the compression and rarefaction phases of an ultrasonic pressure wave, a microbubble will expand and contract, or oscillate, in a nonlinear fashion; this motion creates additional sound waves at different frequencies that can be detected selectively from the initial pulse.[9] Theoretical modeling and empirical studies have both shown that the microbubble’s response to ultrasound is partly related to the mechanical properties of the encapsulating shell, as stiffer shells do not deform as easily as their flexible counterparts.[10] To utilize this effect we created microbubbles with a network of crosslinkable oligonucleotides on their shell. Here, one DNA sequence is appended to the microbubble shell covalently, which allows free movement of the lipid membrane (Figure 1a, “ON”). Then a strand complementary to the shell DNA is added and the resultant hybridization of these oligonucleotides creates a crosslinked network surrounding the bubble (“OFF”). If, however, an analyte is added with preferential affinity for the crosslinking strand, the microbubble loses its crosslinks and becomes flexible again (“ON”). While similar strategies have been applied to complex hydrogels[11] and fluorescence-based sensing mechanisms,[12] such approaches have never been applied to ultrasound.
Figure 1. Microbubble design and synthesis.
(a) Schematic of microbubble crosslinking and reactivation. (b) Synthesis of DSPE-PAA-A15. (c) Bright field optical micrograph of synthesized microbubbles. Scale bar (yellow) = 5 µm. (d, e) 1,2-Dipalmitoyl-sn-glycero-3-phosphocholine and 1,2-dipalmitoyl-sn-glycero-3-phosphatic acid form the dominant portion of the shell.
Here, microbubbles were fabricated with a stabilizing shell containing DNA attached to a polymer-lipid conjugate. Poly(acrylic acid) (PAA) was coupled to the amine of 1.2-distearoylsn-glycero-3-phosphoethanolamine (DSPE) via carbodiimide-mediated amidation, followed by a similar reaction to attach an average of 2.1 amine-terminated A15 (polyadenine) per PAA-DSPE as determined by UV-Vis absorbance measurements (Figure 1b). DSPE-PAA-A15 was then mixed with 1,2-palmitoyl-sn-glycero-3-phosphocholine (DPPC) and 1,2-palmitoyl-sn-glycero-3-phosphatic acid (DPPA) in phosphate buffered saline (PBS) to create a suspension with a 153:17:1 DPPC:DPPA:DSPE-PAA-A15 molar ratio (Figure 1). Finally, the entire mixture was probe sonicated under a headspace of perfluorobutane gas to form the microbubbles (Figure 1d). After flotation for 15 min to remove the foam, microbubbles of mostly 1–5 µm were isolated in a yield of approximately 108 bubbles per millilter PBS (Supporting Figure 1). The bubble count and size dispersity were very similar to those generated from a suspension of DPPC:DPPA:DSPE-PAA without DNA attached.
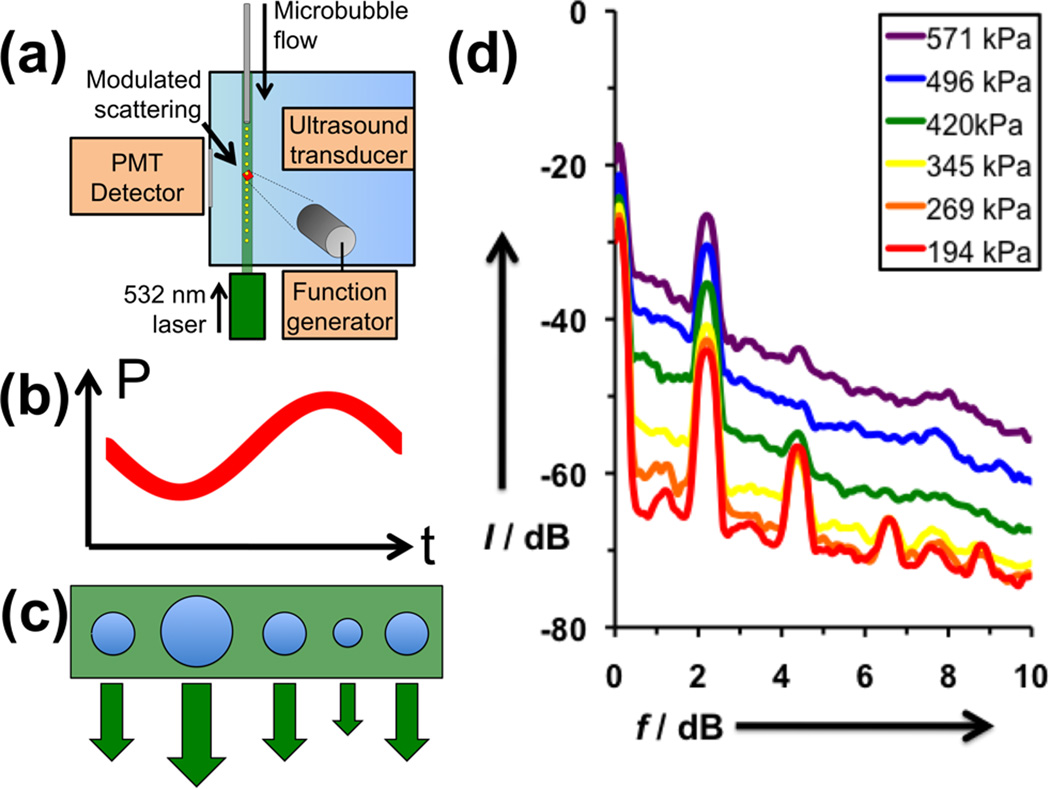
Since the generation of nonlinear echoes depends on the size oscillations of the microbubble under ultrasound, we employed a home-built modulated light scattering apparatus described previously to distinguish oscillating microbubbles from static ones (Figure 2a).[13] Briefly, a dilute flowing stream of microbubbles stabilized by DPPC:DPPA:DSPE-PAA-A15 was interrogated with a series of pulses containing 15 sine waves at 2.25 MHz while irradiated with a continuous wave laser. The ultrasound-induced changes in microbubble size were measured through the resultant changes in light scattering while gating for an AC variance above the noise floor (Figure 2b-c). At low peak pressure (194 kPa), the oscillation of the microbubble shows strong peaks corresponding not only to the fundamental frequency at 2.25 MHz, but also at harmonics 4.5, 6.75, and 9 MHz, as well as subharmonics at 1.12 MHz (Figure 2d). These peaks confirm the expected nonlinearity of oscillation of the microbubbles, which is necessary to obtain effective contrast enhanced imaging. At larger interrogation intensities, the peaks begin to lose their sharpness and a strong broadband contribution is observed. This broadband signal is most likely due to the cavitation of microbubbles, which occurs when the microbubble expands too rapidly and subsequently becomes unstable and collapses, producing a large broadband signal.
Figure 2. Analysis of uncrosslinked, DPPC:DPPA:DSPE-PAA-A15 microbubbles.
(a) Schematic of modulating light scattering apparatus. Microbubbles are flowed through a tube into a water tank, where they are simultaneously interrogated by a ultrasound pulse and a continuous wave laser. If the microbubble oscillates in response to the sine wave ultrasound pulse (b), the microbubble will expand and contract accordingly (c), changing the intensity of light scattering. (d) Fourier Transforms of received light scattering signal gated by AC variance, averaged over 100 oscillating bubbles each.
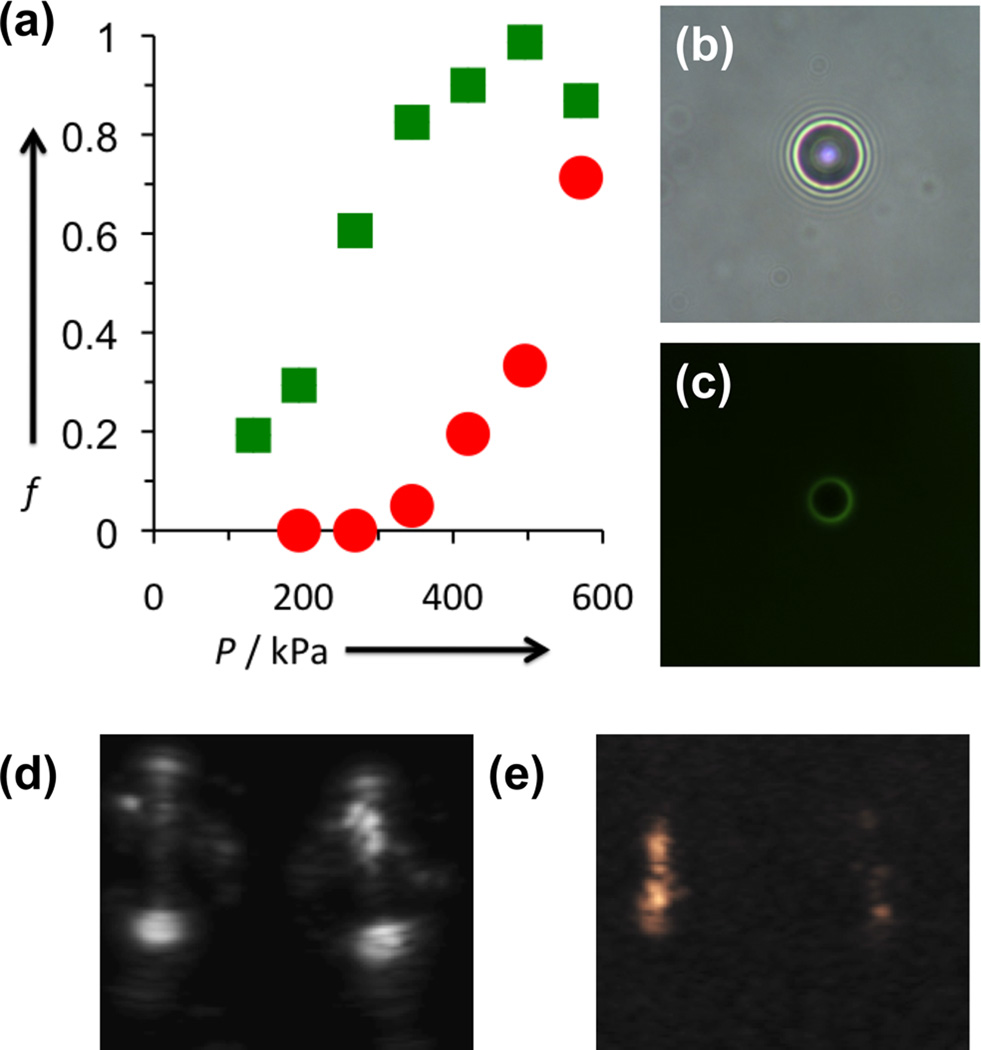
The as-determined flexible DPPC:DPPA:DSPE-PAA-A15 microbubbles were then crosslinked via incubation with a T30 (polythymine) strand to bridge the A15 strands on adjacent polymers. Successful hybridization was determined by incubating the adenine microbubbles with FAM-labelled T30 and performing fluorescence microscopy (Figure 3 b,c). Despite the potential rigidification of the shell, as well as the possible rearrangement of lipids to accommodate the crosslinking strands, the act of crosslinking had little effect upon either the concentration or size distribution of the microbubble suspension (see Supporting Information), nor was bubble aggregation observed by bright field microscopy. Standardized concentrations of crosslinked and uncrosslinked bubbles were run through the modulated light scattering instrument, again gating against AC variance to select for oscillating bubbles. Microbubbles with oscillatory behavior were counted over time and normalized to the maximum count rate of the instrument. The fraction of oscillating bubbles was taken as the slope of the linear fit (R2 > 0.95 for all nonzero samples; Supporting Figure 2). For uncrosslinked bubbles at 345, 420, 496, and 571 kPa, over 80% of microbubbles were found to show oscillatory behavior. At 269 and 194 kPa, the fractions dropped to 20% and 6%, respectively (Figure 3a). After addition of the T30 crosslinking strand however, the microbubble count rate decreased significantly when compared at the same insonation pressures as the uncrosslinked DPPC/DPPA/DSPE-PAA-A15 microbubbles. In particular, there was a sharp decrease at 345 and 420 kPa, at moderate pressures. At 194 and 269 kPa, no oscillating bubbles were detected at all, implying that oscillation was suppressed almost completely. By controlling the incident ultrasound power during imaging, the difference in bubble dynamics may be exploited to obtain substantial differences in ultrasound image contrast. Figure 3e shows uncrosslinked (left) and crosslinked (right) microbubbles in phantoms imaged at 147 kPa in contrast-enhanced mode, which suppresses elastic reflection to isolate signal from harmonic oscillation. The signal is substantially brighter for uncrosslinked than crosslinked microbubbles, and both are distinct from the phantom, the walls of which can be seen clearly in B-mode ultrasound (Figure 3d).
Figure 3. Examination of effect of T30 crosslinking on ultrasound-induced microbubble dynamics.
(a) Comparison of percentage of oscillating microbubbles vs. incident pressure for uncrosslinked (green) and crosslinked (red) microbubbles. (b,c) Bright field and green fluorescence micrographs of DPPC:DPPA:DSPE-PAA-A15 microbubbles with FAM-T30 added. The green fluorescence of the crosslinking strand only appears on the microbubble shell. (d) B-mode and (e) contrast-enhanced ultrasound images obtained simultaneously for uncrosslinked (left) and crosslinked (right) microbubbles in a phantom. The bright spots at the top and bottom of the B-mode image are caused by elastic reflection of ultrasound from the front and back walls of the phantom, respectively. The outline of the round phantom is observed as well. The contrast-enhanced image (e) shows that the uncrosslinked bubbles (left) are significantly brighter than crosslinked bubbles (right). A comparison of these images reveals that the contrast-signal overlays with the interior of the phantom, demonstrating the selectivity of microbubble imaging.
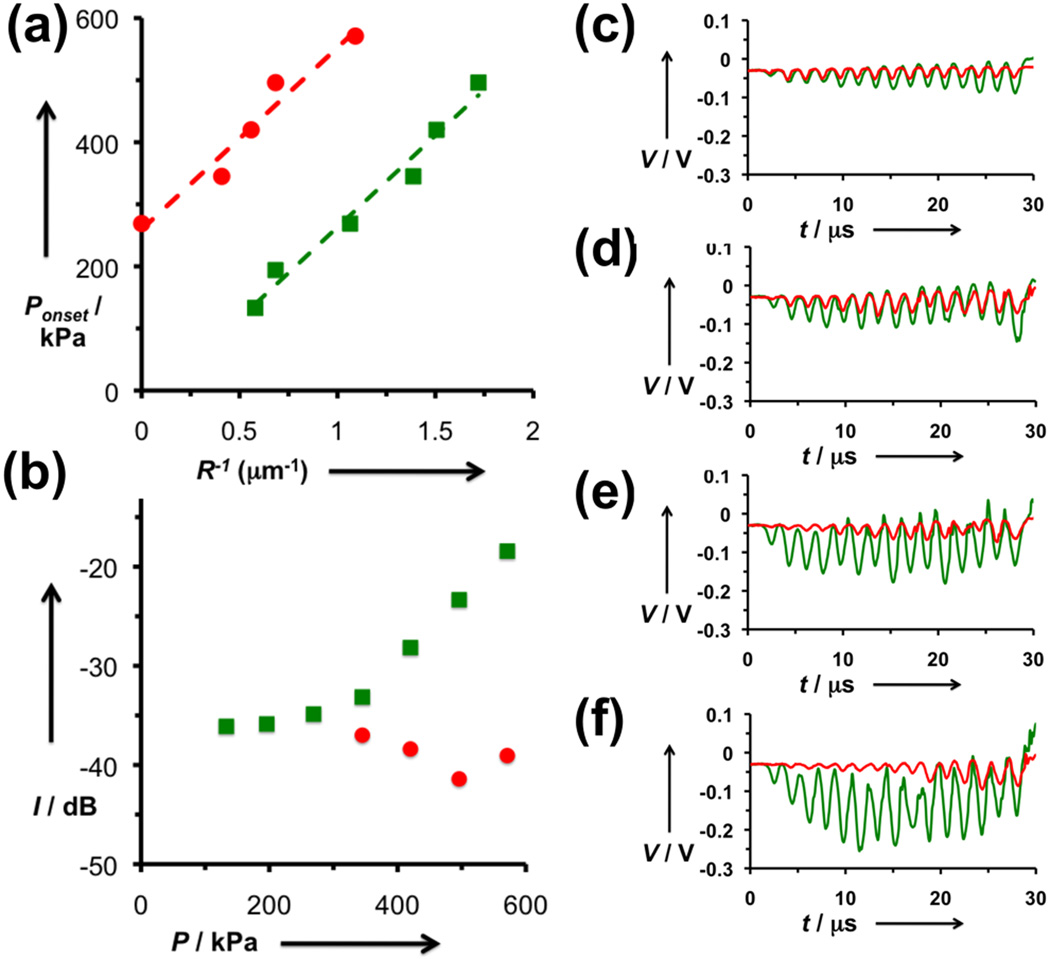
Analysis of the microbubble oscillation through modulated light scattering provides some intriguing insight into the mechanism of crosslink-induced microbubble oscillation. Recent findings by de Jong and coworkers found that small microbubbles require a minimum ultrasound intensity to initiate oscillation, and this threshold appears to have an inverse relationship with microbubble radius.[14] In our study, the size distribution of microbubbles (Supporting Figure 3) can be used to find the size threshold corresponding to a given fraction of the bubbles. Plotting the inverse of this diameter against the incident pressure reveals a linear fit (Figure 4a). The y-intercepts of the two plots reveal that an additional 291 kPa is required to initiate oscillation for crosslinked bubbles. As the slopes of the fitted lines are the same for both crosslinked and uncrosslinked bubbles, this value appears to be valid for all bubble sizes. Since pressure is force per area and the number of DNA strands per shell unit area is known, this corresponds a “ripping” force of ~25 pN per DNA strand, which is consistent with literature reports for single oligonucleotide force measurements.[15] Once this threshold is surpassed, the uncrosslinked bubbles show increasing oscillation amplitude with increasing pressure (Figure 4b-f). However, the amplitude for oscillating crosslinked bubbles stays about the same, and even decreases. One possible explanation for this observation is that for the gas bubble to begin to expand and contract, only some of the DNA-DNA bonds need to be broken. As the gas bubble approaches a certain size, the remaining DNA-DNA bonds restrain the bubble from expanding further. These studies indicate that the act of crosslinking plays a dual role in suppressing ultrasound contrast activity, and both modes are advantageous for clinical imaging.
Figure 4. Analysis of oscillating microbubble dynamics.
(a) Plotting microbubble pressure versus inverse minimum microbubble radius yields a linear fit for uncrosslinked (green) and crosslinked (red) microbubbles. The intercept corresponds to an activation pressure of 291 kPa. (b) Integrated light scattering signal for oscillating uncrosslinked (green) and crosslinked (red) microbubbles. While the size fluctuations of uncrosslinked bubbles appear to increase steadily with increasing incident pressure, the crosslinked bubbles lose signal as pressure increases. (c-f) Time domain plots of the modulated light scattering of oscillating uncrosslinked (green) and crosslinked (red) microbubbles at (c) 345 kPa, (d) 420 kPa, (e) 496 kPa, and (f) 571 kPa.
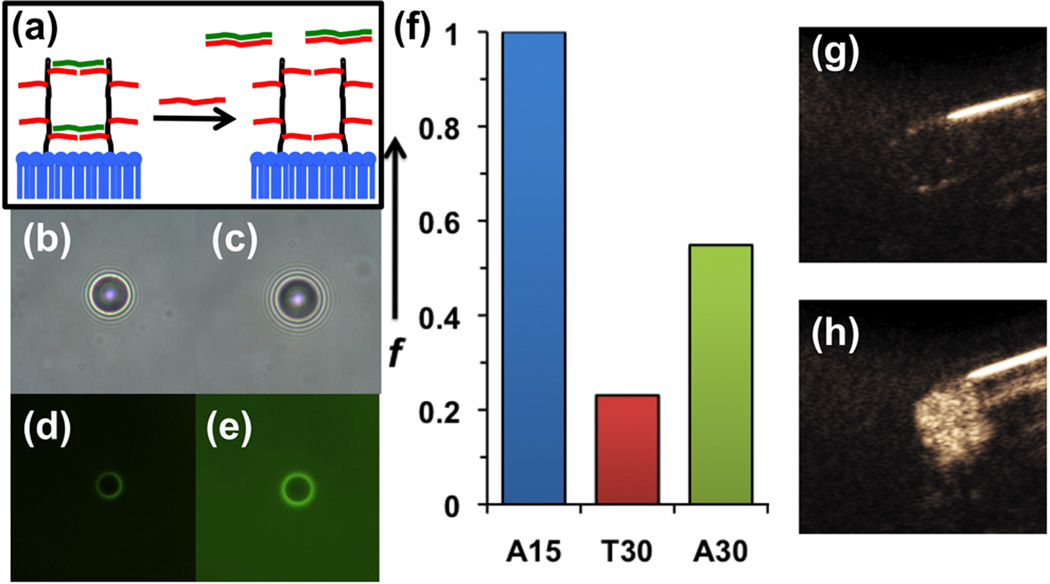
Ultimately, the application of this work is to design microbubbles capable of sensing specific biomolecules in vivo and go from a dark “OFF” state to a bright “ON” state. To study this, T30- crosslinked microbubbles were re-activated by adding excess A30 to competitively bind to the T30 and remove it from the microbubble shell (Figure 5a). The competitive displacement of T30 was confirmed by fluorescence microscopy, where the addition of three equivalents of A30 per T30 caused transfer of most of the FAM-labeled T30 from the microbubble surface into the background (Figure 5b-e). The competitive displacement of the crosslinking T30 strands from the microbubbles appeared to increase the oscillating microbubble fraction by more than two-fold (Figure 5f), although not to its original level. However, this result indicates that the excess complementary strand can compete for the crosslinking strand to pull many of them from the bubble. This activation also appears to be mostly reversible, with only a slight reduction in microbubble population as a result of the decrosslinking (Supporting Figure 2). Next, crosslinked microbubbles subjected to A30 addition were imaged via contrast-enhanced ultrasound at 257 kPa in a phantom. The crosslinked bubbles showed little signal inside the walls of the phantom (Figure 5g). After addition of A30, the signal was found to increase quite dramatically, visibly filling the region of interest (Figure 5h). Brightness analysis (ImageJ) revealed that decrosslinked bubbles were approximately 100 times brighter than crosslinked bubbles. Thus the reactivation of oscillatory behavior has a profound effect on ultrasound contrast activity using pre-existing clinical ultrasound imaging protocols.
Figure 5. Analysis of A30 decrosslinking of DPPC:DPPA:DSPE-PAA-A15 microbubbles pre-crosslinked with T30.
(a) Schematic of re-activation through addition of longer oligonucleotide (A30) complementary to crosslinking strand (T30). (b,d) Bright field and green fluorescence microscopy images of microbubbles crosslinked with FAM-T30. (c,e) Microscopy images of same sample after addition of A30. (f) Comparison of oscillating microbubble fraction for uncrosslinked (A15), crosslinked (T30), and decrosslinked (A30) microbubbles. (g) Contrast enhanced ultrasound image of crosslinked microbubbles in phantom. (h) Contrast enhanced ultrasound image of same suspension after addition of A30.
In this study, it was found that the ultrasound contrast activity of gas-filled microbubbles could be tuned by using the properties of the encapsulating shell to control the generation of nonlinear echoes. Microbubbles were fabricated with a shell consisting of a mixture of phospholipids and synthetic oligonucleotide-polymer-phospholipid conjugates. The addition of a crosslinking oligonucleotide caused the microbubbles to lose their ability to oscillate in an ultrasound field and create non-linear echoes. Analysis of the microbubbles’ modulated light scattering revealed that the crosslinking not only added a resistance to oscillation of 291 kPa for all bubble sizes, but it also decreased the amplitude of microubbble oscillation. Addition of a competitively-binding oligonucleotide resulted in the recovery of ultrasound signal based on removal of the crosslinking oligonucleotide. In future studies, the DNA will be reformulated to include biomarker-binding aptamer strands, to allow the possibility of site-specific detection of deep-lying disease, a highly sought-after goal for clinical imaging.
Experimental
Synthesis of DSPE-PAA
Poly(acrylic acid) (PAA, 100 mg, 0.02 mmol per chain, Mw ~5000, 50% wt% in water, Aldrich) was mixed with dimethylsulfoxide (4 mL, EMD) in a scintillation vial with stirbar, titrating in 1 M hydrochloric acid to solubilize, if necessary. N-hydroxysuccinimide (NHS, 46 mg, 0.40 mmol, Pierce) and 1-ethyl-3-(3-dimethylaminopropyl)carbodiimide hydrochloride (EDC, 38 mg, 0.20 mmol, Pierce) were dissolved and the solution was stirred 30 min at RT. In a separate vial, 1,2-distearoyl-sn-glycero-3-phosphoethanolamine (15 mg, 0.02 mmol, Aldrich) was mixed with chloroform (4 mL, EMD) and triethylamine (1 mL, Alfa Aesar). The mixture was incubated at 60°C until clear. The two solutions were combined and stirred at 60°C for 1 h, then stirred overnight at RT. The volatiles (chloroform and triethylamine) were removed via a stream of air, and the remaining solution was diluted with water (16 mL) and transferred to a regenerated cellulose dialysis tube (MWCO 1000, SpectraPor) and dialyzed two days against distilled water with at least four changes of water. The dialyte was lyophilized to obtain a white powder. Yield: 106 mg (0.0184 mmol, 92%). 1H NMR (500 MHz, DMSO-d6, δ): 2.93–3.09 (m, 41H), 2.71 (d, J = 3 Hz, 15H), 2.09–2.30 (br s, 48H), 1.10–1.82 (br m, 140H), 0.92–0.99 (m, 8H), 0.82–0.85 (m, 6H).
Synthesis of DSPE-PAA-A15
DSPE-PAA (0.25 mg, 44 µmol) was mixed with amine-terminated (adenine)15 (A15-NH2, 1.025 mg, 213 µmol, Integrated DNA Technologies) and EDC (0.417 mg, 2.17 mmol) in 50 mM phosphate buffer (pH 7.0, 800 uL) on a rotisserie mixer at RT overnight. The product was dialyzed (MWCO 12–14k, FisherBrand) for two days against distilled water with four changes of water. The dialyte was frozen and lyophilized to remove water and obtain a white powder. Yield: 1.1 mg (86%). DNA attachment was quantified by UV-Vis spectroscopy (Beckman Coulter DU 730). 1.1 mg of DSPE-PAA-A15 was dissolved in 1.4 mL of water. The absorbance at 260 nm was measured to be 0.188, which with the A15-NH2 absorption coefficient being 183,400 A/mol/cm, corresponded to a coupling yield of 2.1 A15-NH2 per DSPE-PAA.
Microbubble Formulation, Crosslinking, and Decrosslinking
Microbubbles were formulated in a similar manner as described previously [16]. In order to add crosslinks to the encapsulating shell, (thymine)30 (T30, IDT) was added to pre-formed microbubbles in a 1.5:1 molar ratio to the total number of (adenine)15. The bubbles were then allowed to sit at RT for 30 min. To remove crosslinks by competitive association, (adenine)30 (A30, IDT) was added to crosslinked microbubbles in a 3:1 molar ratio with the number of (thymine)30 added during the crosslinking step. The bubbles were then allowed to sit at room temperature for 45 min prior to fractionation and sizing.
Measurement of Modulated Light Scattering
This equipment has been described previously [13b]. To measure microbubble dynamics, ultrasound was pulsed in bursts of 15 sine waves of 2.25 MHz at a repetition rate of about 1 Hz. Light scattering data was collected from the oscilloscope using Labview (National Instruments) on a PC. The AC variance was determined for the noise floor, and the threshold was set to a value slightly greater than this. Microbubble samples were counted as described above, diluted to a concentration of 105 mL−1, and flowed through the setup continuously. The gated AC variance time domain spectra, their Fourier transformations, and the data time stamps were collected and processed in Matlab (MathWorks) offline.
Determination of Microbubble Fraction and Correlation to Size
The counting procedure has been described previously [15]. The microbubble count was plotted versus collection time and the linear fit was determined for all non-zero samples. R2 > 0.98 for all non-zero samples except for crosslinked bubbles at 345 kPa, for which R2 > 0.95. To determine microbubble fraction, these data the largest count rate was set to unity and the other count rates were scaled against this value. Correlation of size to bubble fraction was determined by calculating radius from raw ImageJ data from the counting experiment and ranking these against count fraction (count number divided by total sample count). For example, if the 480th smallest bubble out of 850 was 1.98 µm in diameter, then 56.5% of the bubbles in the sample were considered to be larger than 0.99 µm in radius. This value was substituted for the fraction obtained from the pressure-oscillation count experiment, and plotted as pressure vs. 1/R, removing the 571 kPa point as an outlier for uncrosslinked microbubbles and the 196 kPa point for crosslinked bubbles (1/R > 0). Linear fits were obtained through Microsoft Excel. Uncrosslinked bubbles: slope = 295 mN m−1; intercept = −32 kPa; R2 = 0.975. Crosslinked bubbles: 293 mN m−1; intercept = 260 kPa; R2 = 0.954.
Contrast-Enhanced Ultrasound Imaging
Samples were imaged with Siemens Acuson Sequoia 512 set in dual cadence mode (B-mode and contrast-enhanced ultrasound obtained simultaneously). The samples were diluted to a concentration of 20,000 bubbles mL−1 and placed in a transfer pipette in a water tank. Images in Figure 3 were obtained at 1.5 MHz and MI = 0.12 (peak pressure = 147 kPa), Figure 5 at 1.5 MHz and MI = 0.16 (257 kPa). Brightness analysis was performed with ImageJ (NIH) by integrating the brightness level inside the phantom minus an average of four background regions of the same size and shape at similar imaging depth. Data from this analysis: crosslinked raw brightness, 4966993; crosslinked average background, 4754288; decrosslinked raw brightness, 27466036, decrosslinked average background, 4316435.4. Calculations: crosslinked net brightness, 212705; decrosslinked net brightness, 23149600.6; ON/OFF ratio, 108.8.
Supplementary Material
Acknowledgements
The authors thank Prof. Robert F. Mattrey of the Department of Radiology at UCSD for helpful discussions and use of his Siemens Acuson 512 Imaging System, and Prof. Clark Wu of the Department of Radiology at UCSD for help with ultrasound imaging. This work was supported by NIH grants K99CA153935 (A.P.G.) and U54CA119335 (S.C.E.) as well as UCSD startup funds (J.N.C.).
Contributor Information
Sadik C. Esener, Email: sesener@ucsd.edu.
Jennifer N. Cha, Email: jencha@ucsd.edu.
Andrew P. Goodwin, Email: agoodwin@ucsd.edu.
References
- 1.Schutt EG, Klein DH, Mattrey RM, Riess JG. Angew. Chem. Int. Ed. 2003;42:3218–3235. doi: 10.1002/anie.200200550. [DOI] [PubMed] [Google Scholar]
- 2.a) Gramiak R, Shah PM. Invest. Radiol. 1968;3:356–366. doi: 10.1097/00004424-196809000-00011. [DOI] [PubMed] [Google Scholar]; b) Klibanov AL, Hughes MS, Wojdyla JK, Marsh JN, Hall CS, Miller JG, Wible JH, Jr, Brandenburger GH. Acad. Radiol. 1998;5(Suppl. 1):S243–S246. doi: 10.1016/s1076-6332(98)80118-9. [DOI] [PubMed] [Google Scholar]; c) Porter TR, Iversen PL, Li SP, Xie F. J. Ultrasound Med. 1996;15:577–584. doi: 10.7863/jum.1996.15.8.577. [DOI] [PubMed] [Google Scholar]; d) Unger E, Shen DK, Fritz T, Kulik B, Lund P, Wu GL, Yellowhair D, Ramaswami R, Matsunaga T. Invest. Radiol. 1994;29:S134–S136. doi: 10.1097/00004424-199406001-00044. [DOI] [PubMed] [Google Scholar]; e) Unger EC, Lund PJ, Shen DK, Fritz TA, Yellowhair D, New TE. Radiol. 1992;185:453–456. doi: 10.1148/radiology.185.2.1410353. [DOI] [PubMed] [Google Scholar]
- 3.a) Lanza GM, Wallace KD, Scott MJ, Cacheris WP, Abendschein DR, Christy DH, Sharkey AM, Miller JG, Gaffney PJ, Wickline SA. Circulation. 1996;94:3334–3340. doi: 10.1161/01.cir.94.12.3334. [DOI] [PubMed] [Google Scholar]; b) Forsberg F, Roy R, Merton DA, Rawool NM, Liu JB, Huang M, Kessler D, Goldberg BB. Ultrasound Med. Biol. 1998;24:1143–1150. doi: 10.1016/s0301-5629(98)00062-3. [DOI] [PubMed] [Google Scholar]
- 4.a) Huang SL, Hamilton AJ, Pozharski E, Nagaraj A, Klegerman ME, McPherson DD, MacDonald RC. Ultrasound Med. Biol. 2002;28:339–348. doi: 10.1016/s0301-5629(01)00512-9. [DOI] [PubMed] [Google Scholar]; b) Alkan-Onyuksel H, Demos SM, Lanza GM, Vonesh MJ, Klegerman ME, Kane BJ, Kuszak J, McPherson DD. J. Pharm. Sci. 1996;85:486–490. doi: 10.1021/js950407f. [DOI] [PubMed] [Google Scholar]
- 5.Coley BD, Trambert MA, Mattrey RF. Am. J. Roentgenol. 1994;163:961–964. doi: 10.2214/ajr.163.4.8092043. [DOI] [PubMed] [Google Scholar]
- 6.a) Ragde H, Kenny GM, Murphy GP, Landin K. Prostate. 1997;32:279–283. doi: 10.1002/(sici)1097-0045(19970901)32:4<279::aid-pros8>3.0.co;2-e. [DOI] [PubMed] [Google Scholar]; b) Frauscher F, Klauser A, Halpern EJ, Horninger W, Bartsch G. Lancet. 2001;357:1849–1850. doi: 10.1016/s0140-6736(00)04970-9. [DOI] [PubMed] [Google Scholar]
- 7.Borden MA, Sarantos MR, Stieger SM, Simon SI, Ferrara KW, Dayton PA. Mol. Imaging. 2006;5:139–147. [PMC free article] [PubMed] [Google Scholar]
- 8.Kearon C, Ginsberg JS, Hirsh J. Ann. Int. Med. 1998;129:1044–1049. doi: 10.7326/0003-4819-129-12-199812150-00009. [DOI] [PubMed] [Google Scholar]
- 9.a) Krishna PD, Newhouse VL. Ultrasound Med. Biol. 1997;23:453–459. doi: 10.1016/s0301-5629(96)00217-7. [DOI] [PubMed] [Google Scholar]; b) Ophir J, Parker KJ. Ultrasound Med. Biol. 1989;15:319–333. doi: 10.1016/0301-5629(89)90044-6. [DOI] [PubMed] [Google Scholar]
- 10.a) Church CC. J. Acoust. Soc. Am. 1995;97:1510–1521. [Google Scholar]; b) Hoff L, Sontum PC, Hovem JM. J. Acoust. Soc. Am. 2000;107:2272–2280. doi: 10.1121/1.428557. [DOI] [PubMed] [Google Scholar]
- 11.Um SH, Lee JB, Park N, Kwon SY, Umbach CC, Luo D. Nature Mater. 2006;5:797–801. doi: 10.1038/nmat1741. [DOI] [PubMed] [Google Scholar]
- 12.a) Yang H, Liu H, Kang H, Tan W. J. Am. Chem. Soc. 2008;130:6320–6321. doi: 10.1021/ja801339w. [DOI] [PMC free article] [PubMed] [Google Scholar]; b) Nutiu R, Li YF. J. Am. Chem. Soc. 2003;125:4771–4778. doi: 10.1021/ja028962o. [DOI] [PubMed] [Google Scholar]
- 13.a) Guan JF, Matula TJ. J. Acoust. Soc. Am. 2004;116:2832–2842. doi: 10.1121/1.1795334. [DOI] [PubMed] [Google Scholar]; b) Hsu MJ, Eghtedari M, Goodwin AP, Hall DJ, Mattrey RF, Esener SC. J. Biomed. Opt. 2011;16:067002. doi: 10.1117/1.3583575. [DOI] [PMC free article] [PubMed] [Google Scholar]
- 14.a) Emmer M, Vos HJ, Goertz DE, van Wamel A, Versluis M, de Jong N. Ultrasound Med. Biol. 2009;35:102–111. doi: 10.1016/j.ultrasmedbio.2008.07.005. [DOI] [PubMed] [Google Scholar]; b) Tang MX, Eckersley RJ, Noble JA. Ultrasound Med. Biol. 2005;31:377–384. doi: 10.1016/j.ultrasmedbio.2004.12.009. [DOI] [PubMed] [Google Scholar]
- 15.a) Strunz T, Oroszlan K, Schafer R, Guntherodt HJ. Proc. Natl. Acad. Sci. U S A. 1999;96:11277–11282. doi: 10.1073/pnas.96.20.11277. [DOI] [PMC free article] [PubMed] [Google Scholar]; b) MacKerell AD, Jr, Lee GU. Eur. Biophys. J. 1999;28:415–426. doi: 10.1007/s002490050224. [DOI] [PubMed] [Google Scholar]
- 16.Nakatsuka MA, Lee JH, Nakayama E, Hung AM, Hsu MJ, Mattrey RF, Esener SC, Cha JN, Goodwin AP. Soft Matter. 2011;7:1656–1659. doi: 10.1039/C0SM01131B. [DOI] [PMC free article] [PubMed] [Google Scholar]
Associated Data
This section collects any data citations, data availability statements, or supplementary materials included in this article.


