Abstract
Compared to conventional bench-top instruments, microfluidic devices possess advantageous characteristics including great portability potential, reduced analysis time (minutes), and relatively inexpensive production, putting them on the forefront of modern analytical chemistry. Fabrication of these devices, however, often involves polymeric materials with less-than-ideal surface properties, specific instrumentation, and cumbersome fabrication procedures. In order to overcome such drawbacks, a new hybrid platform is proposed. The platform is centered on the use of 5 interconnecting microfluidic components that serve as the injector or reservoirs. These plastic units are interconnected using standard capillary tubing, enabling in-channel detection by a wide variety of standard techniques, including capacitively-coupled contactless conductivity detection (C4D). Due to the minimum impact on the separation efficiency, the plastic microfluidic components used for the experiments discussed herein were fabricated using an inexpensive engraving tool and standard Plexiglas. The presented approach (named 52-platform) offers a previously unseen versatility: enabling the assembly of the platform within minutes using capillary tubing that differs in length, diameter, or material. The advantages of the proposed design are demonstrated by performing the analysis of inorganic cations by capillary electrophoresis on soil samples from the Atacama Desert.
Keywords: PMMA, microchip, fabrication, conductivity detection, inorganic ions
1. Introduction
Microchip – capillary electrophoresis (μchip-CE) devices are part of a trend combining portability, miniaturization, and low cost with high analytical performance. Considering a variety of potentially customizable parameters including separation media, material substrate, fabrication method, and detection scheme, these small devices are capable of handling chemical analyses across a broad spectrum of disciplines.1-4 Additionally, μchip-CE offers a number of advantages over traditional bench-top instrumentation such as lower volumes of sample and reagents, shorter analysis times, and the capacity to operate in a fully automated fashion.5, 6
Microchips were initially developed from glass substrates through photolithography and a variety of etching techniques.7-9 Although glass has almost ideal optical properties and well-known surface chemistry, the fabrication protocols are expensive, lengthy, and typically yield rather fragile chips that can be ruined even by small particles clogging a channel. Among other materials (most often polymers) that have been extensively utilized for fabrication,10, 11 it is worth mentioning poly(methyl methacrylate) (PMMA),12 polycarbonate,13 and poly(dimethylsiloxane).14, 15 One of the main advantages of these polymeric materials is that they allow fast and cost-efficient fabrication of devices by a variety of techniques including laser ablation,16 hot embossing,17, 18 and microwave bonding.19 Additionally, a variety of procedures are currently available to modify the surface of these materials.20-25 More recently, polyester-toner26 and paper-based microfluidic devices27-29 have emerged as promising platforms for microfluidic applications. In both cases, the devices can be produced by a direct-printing process and represent one of the simplest available technologies for microchip production (less than $0.10 per device).
Although all of these methods have yielded examples of functioning microfluidic devices, it is clear that there is a trade-off between the fabrication procedure, the material, and the microdevice performance. In other words, high-performing devices are still expensive and low-cost devices only offer limited analytical performance. There are also a variety of standard chips commercially available, but these items are expensive and inherently non-reconfigurable. For analysis in remote areas or locations where microfabrication facilities are unavailable, on-site reconfiguration could be required, limiting the versatility of the standard approach utilizing glass microchips.
Aiming to overcome such drawbacks, a series of modular (plug-n-play) microfluidic systems have been proposed.30-33 These devices add tremendous flexibility to the design but are typically limited to hydrodynamic pumping and most often require microfabrication facilities. Alternatively, this manuscript describes a microchip-inspired platform based on 5 plastic microfluidic components that serve as the injector (1 cm × 1 cm × 0.4 cm) or reservoirs (1.9 cm × 1.9 cm × 0.6 cm). These components are interconnected using standard capillary tubing, enabling in-channel detection by a wide variety of standard techniques, including C4D (demonstrated in this manuscript), as well as electrochemical or optical methods. The resulting devices are suitable for capillary electrophoresis, avoid the use of specific machinery or microfabrication facilities, are inexpensive (less than $70 per re-usable setup), and are assembled (or reconfigured) in just a few minutes. Such features makes this platform a worthy candidate to have a high impact in society because it could be replicable in didactic purposes, and it could enable the field of analytical chemistry to low-resource communities. The capabilities of the resulting device were demonstrated by performing an analysis of representative inorganic cations in soil samples from the Atacama Desert.
2. Materials and Methods
Reagents and Solutions
All chemicals were analytical reagent grade and used as received. The analytes (KCl, NaCl, LiCl, CaCl2, MgCl2) and NaOH were purchased from Sigma-Aldrich (Saint Louis, MO); (NH4)2SO4 was purchased from MCB (Darmstadt, Germany). Aqueous solutions were prepared using 18 MΩ-cm water (NANOpure Diamond, Barnstead; Dubuque, Iowa) and were filtered using a hollow fiber filter (0.2 μm, Barnstead). The pH of the solutions was adjusted when necessary, using either 1 mol L−1 NaOH or 1 mol L−1 HCl (Fisher Scientific; Fair Lawn, NJ) and measured using a glass electrode and a digital pH meter (Orion 420A+, Thermo; Waltham, MA). The background electrolyte (BGE) used for all the experiments was prepared from a stock solution of 100 mmol L−1 2-(N-morpholino)ethanesulfonic acid (MES) and 100 mmol L−1 l-histidine (HIS). Stock solutions of each analyte (10 mmol L−1 each) were prepared daily in DI water and then diluted in the running buffer prior to analysis.
Electrophoretic system
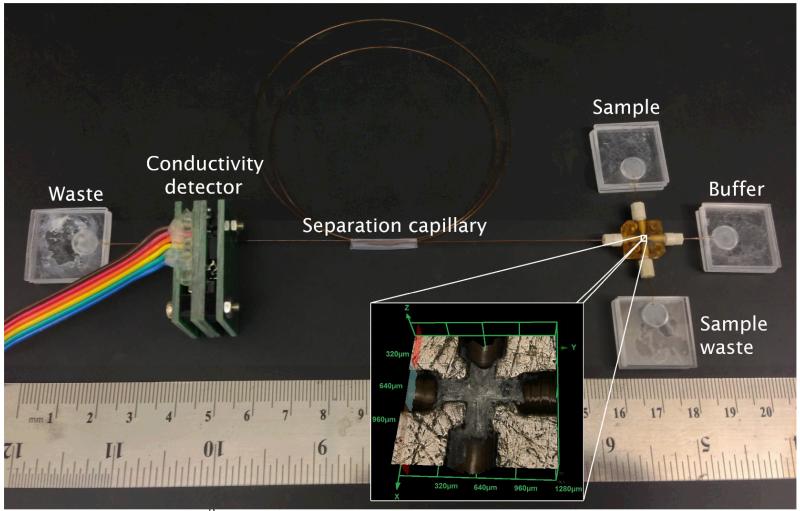
The system was assembled by connecting 4 PMMA reservoirs to a central interconnect (Ultem® Cross C360-204, Labsmith; Livermore, CA) via standard silica capillary tubing (50 μm ID, 360 μm OD; Polymicro Tech; Phoenix, AZ). The solution reservoirs were fabricated by cutting squares of 1.9 cm × 1.9 cm from standard layers of PMMA (1/16” thick) using a computer-controlled engraver (Gravograph IS400, Gravotech; Duluth, GA).* These squares were denoted as “top” and “bottom”. While the “bottom” layer consists of a flat piece of PMMA, the “top” unit has a hole drilled into the PMMA that serves as the well for sample/buffer/waste and also contains a fine channel to connect the capillary tubing. In order to avoid leaks, the capillary tubing was first glued to the “top” piece with “PMMA glue” (PMMA dissolved in chloroform) and then thermally sealed to the “bottom” piece at 120 ± 3 °C for 15 min. The reservoirs fabricated in this manner were connected to one another via an interconnect (1 cm × 1 cm × 0.4 cm), forming the microchip-inspired platform schematically shown in Figure 1. Connection between the central square and the capillaries was performed using four PEEK fittings (360 μm, Labsmith; Livermore, CA). The system was assembled under water to prevent formation of air bubbles during the application of the electrophoretic potential. In order to calculate the volume of the interconnecting square, one of the pieces was sanded to half height and visualized using a 3D laser microscope (Olympus LEXT).The picture insert in Figure 1 shows that the connector comprises inner channels of approximately 250 μm, which are larger than standard injectors specifically designed for microchip applications. The dead volume of the interconnect (according to the manufacturer) is 38 nL.
Figure 1.
Picture of the 52 platform assembled from the 5 squares and capillaries. Insert showing a microphotograph of the central interconnect (1.28 mm × 1.28 mm).
The system was washed daily with 0.1 mol L−1 NaOH, ultrapure water, and running buffer for 30 min each. This procedure was adopted to activate the fused silica surface and promote higher and stable electro-osmotic flow (EOF). Between each injection, the capillary was rinsed with running buffer for 20 min. The sample injection was performed by applying vacuum of ~70 kPa on the sample waste reservoir for a selected period of time. After the application of the vacuum, the reservoir was replenished with running buffer. To perform the electrophoretic separation, a selected potential was applied to the buffer reservoir, with respect to the ground electrode, which was placed in the buffer waste reservoir. For all experiments involving electrophoresis, a high-voltage rack (HV-RACK-4-250, Ultravolt; Ronkonkoma, NY) was used. The openC4D (https://sites.google.com/site/openc4d/) detector was obtained from the University of Sao Paulo in Brazil and used in the format described by Francisco et al.34 The electronic circuitry of the C4D includes a signal generator, a detection cell, a transimpedance amplifier, a rectifier, a low-pass filter, and an analog-to-digital converter. The arrangement includes two 2 mm coiled copper electrodes separated by a gap of 0.51 mm. Data acquisition was obtained using the Swing CE software supplied with the openC4D and the experimental conditions for the detector include using a sine wave with a frequency of 1.1 MHz with an amplitude of 4V (peak-to-peak).
Soil samples
Soil samples were collected from the Atacama Desert (northern Chile) in June 2005. Due to the extreme aridity of this region (experiencing less than a centimeter of precipitation per decade) and the chemical/mineralogical composition of the surface materials present, these samples are well-known analogues to Martian regolith. All samples were GPS-coded, cached on site, placed in sealed vials, and maintained in a sterile desiccator until used. Details related to the collection sites for the samples used in this manuscript are included in Table 1. For sample preparation using our proposed platform, an aliquot of 10 mg of soil was added to 10 mL of running buffer and stirred in an ultrasonic bath for 10 min. One mL of this was centrifuged at 13,400 rpm for 15 min and the supernatant was injected hydrodynamically in the electrophoretic system. Additional information related to these samples, the collection sites, and corresponding μchip-CE analysis for organic species can be found elsewhere.35
Table 1.
Information related to the mineralogy and location sites of soil samples collected from the Atacama Desert.
| Label | Mineralogy | Depth | Latitude | Longitude | Elevation |
|---|---|---|---|---|---|
| AT40B1-08 | Exposed duracrust | < 1 cm | S24°03.629′ | W69°52.092′ | 1081 m |
| AT44B1-08 | Exposed duracrust | < 1 cm | S24°03.651′ | W69°52.102′ | 1075 m |
| AT54A1-08 | Duracrust | 2-3 cm | S24°03.680′ | W69°52.098′ | 1055 m |
In order to verify the results obtained with the proposed platform, the elemental composition of the soil samples was analyzed by energy dispersive X-ray spectroscopy (EDX). The experiments were performed by placing an aliquot of the sample in a Hitachi High Resolution 5500 SEM Scanning electron microscope, equipped with an XFlash 4010 Si drift detector (Bruker AXS; Billerica, MA) and operated at 30 kV. The data, collected over an approximate area of 50 μm2, was analyzed with built-in software (Quantax Espirit 1.9).
Safety considerations
The high voltage power supply and associated open electrical connections should be handled with extreme care to prevent electrical shock.
3. Results and Discussion
Although we foresee a wide number of potential applications, the goal of this manuscript was to demonstrate the characteristics and advantages of the proposed platform through the analysis of inorganic cations in soil samples. Key factors affecting the performance of the platform were investigated and are discussed.
Effect of buffer solution
Similar to conventional CE, the buffer solution has a significant effect on the analysis because it influences the total charge of analytes, the magnitude of the EOF, and the generation of Joule heating (which could affect resolution). Furthermore, as previously reported, the buffer system also has a considerable effect on the signal/noise obtained in C4D.36,37 Therefore, an equimolar MES and HIS buffer, pH = 6.1 + 2 mmol L−1 18-crown-6 was selected based on previous literature reports.38-40 Although this background electrolyte was selected as a simple solution to demonstrate the functionality of the system, alternative conditions41, 42 could be selected to provide improved the resolution, if needed.
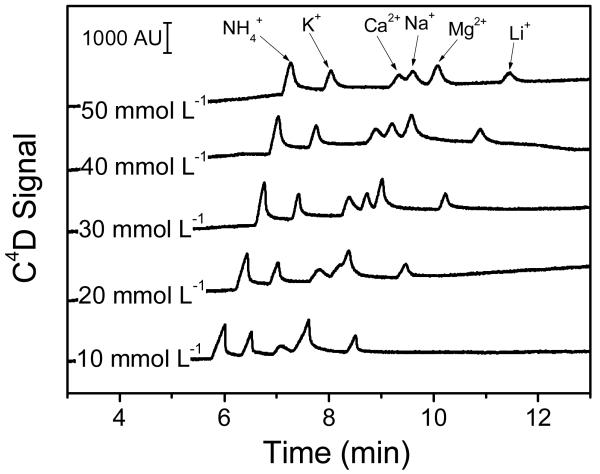
The effect of the buffer concentration on the separation and detection was evaluated in the 10 – 50 mmol L−1 range (for each component) by injecting a standard solution containing 100 μmol L−1 of the six cations diluted in the same buffer. As it can be observed in Figure 2, concentrations ≥ 30 mmol L−1 MES and 30 mmol L−1 HIS yielded significant increases in the overall analysis time but enabled the identification of all six selected cations. This behavior can be attributed to a decrease in the effective charge of the surface of the capillary, shielded by the increasing concentration of ions in the background electrolyte. It is also important to note that, within the investigated range of buffer concentrations, the signal/noise was not adversely affected. Considering these results, and as a balance between resolution and analysis time, 30 mmol L−1 MES and 30 mmol L−1 HIS pH = 6.1 (+ 3 mmol L−1 18-crown-6, vide infra) was selected as the optimum background electrolyte and used for the rest of experiments described in this manuscript.
Figure 2.
Effect of the concentration of equimolar MES and HIS buffer (pH = 6.1) on the separation of the selected cations, at 100 μmol L−1 each. Other conditions: 3 mmol L−1 18-crown-6), ESEP = 10 kV, capillary length = 60 cm, effective length = 56 cm, 5 sec hydrodynamic injection.
Effect of buffer additives
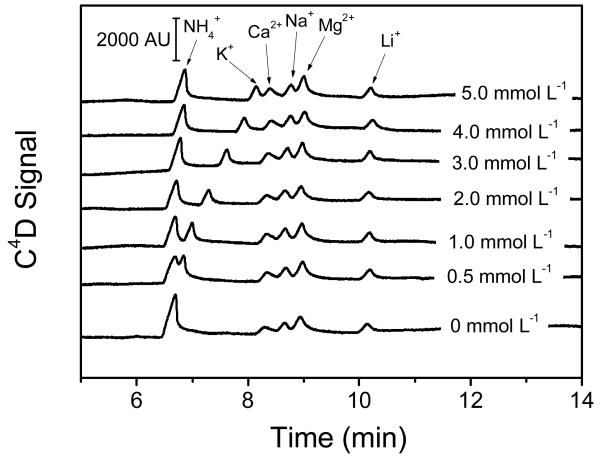
It is well-known that the separation of some cations can be optimized by the addition of 18-crown-6 to the running electrolyte.43 The main reason for this is that 18-crown-6 is able to form inclusion complexes with several inorganic cations, which affects the effective electrophoretic mobility of the cations and imparts selectivity to the separation step.44 Consequently, the effect of the concentration of 18-crown-6 on the separation was investigated in the 0 - 5 mmol L−1 range, using 30 mmol L−1 MES and 30 mmol L−1 HIS buffer as the running electrolyte. The results are summarized in Figure 3. In line with previous reports, where the stability complex constant with 18-crown-6 (log Ks = 2.1) was reported to be significantly higher than that of NH4+ (log Ks = 1.01),43 sequential additions of 18-crown-6 only influenced the migration time of the peak corresponding to potassium, enabling its separation from NH4+ with as little as 1 mmol L−1. In order to maximize the separation and minimize the possibility of co-migration with other species present in the target samples, a concentration of 3.0 mmol L−1 18-crown-6 was selected and used for all the experiments described in this manuscript.
Figure 3.
Effect of the concentration of 18-crown-6 on the separation of the selected cations at 100 μmol L−1 each. Conditions: 30 mmol L−1 MES and 30 mmol L−1 HIS, ESEP = 10 kV, capillary length = 60 cm, effective length = 56 cm, 5 sec hydrodynamic injection.
It is also important to highlight that Tanyanyiwa et al.38 stated that although it is possible to achieve complete resolution of the ammonium and potassium peaks using long capillaries and concentrations of 18-crown-6 as low as 1 mmol L−1, it would not be possible to resolve them on glass chips with less than 2 mmol L−1. In such cases,45 concentrations as high as 7.5 mmol L−1 would be required. The results shown in Figure 3 (where baseline separation of the ammonium and potassium peaks was achieved) strongly indicate that the proposed platform is able to offer not only the advantages of most microfluidic systems but also a performance that is comparable to standard bench-top instruments.
Effect of capillary length
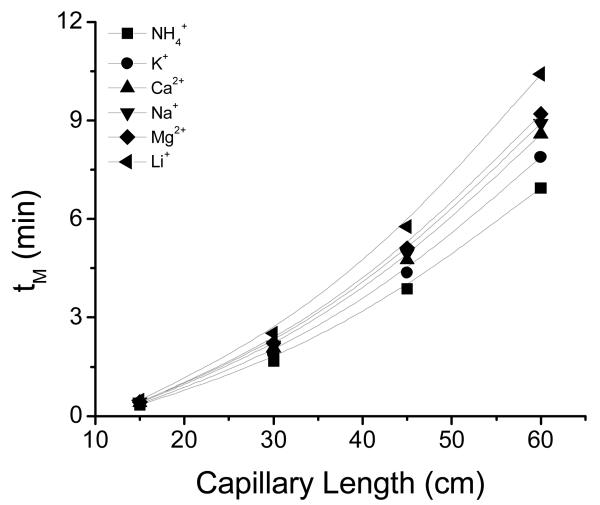
Generally, increasing the effective length of the capillary is beneficial to separation efficiency and resolution of separations under diffusion-limited conditions.46, 47 Although replacing the capillary in most commercial bench-top systems is not complicated, the operation must be manually performed (reassembling the capillary cartridge) and is often limited to fixed increments.47 At the microchip-scale, changing the length of the separation channel is significantly more challenging. For that reason, most designs include separation channels in the range of a few centimeters or require the implementation of serpentine geometries which can induce dispersion.48 Therefore, in order to demonstrate the possibility to change and customize the capillary length in the proposed design, the effect of four different capillary lengths on the separation was investigated: 15 cm, 30 cm, 45 cm and 60 cm (effective lengths of 11 cm, 26 cm, 41 cm, and 56 cm, respectively). As observed in Figure 4, significant increases in the analysis times and separation efficiencies were obtained when the separation was performed using longer capillaries. In the case of the 60 cm-long capillary (using the conditions described in Figure 4), an average of 17,000 plates m−1 was obtained (ranging from 7,300 plates m−1 for NH4+ to 27,000 plates m−1 for Na+). The resolution, calculated for the 60-cm capillary and the conditions described in Figure 4, ranged from 1.1 (for the peaks corresponding to Ca+2 and Na+) to 3.4 (for the peaks corresponding to Mg2+ and Li+). Based on these results, 60 cm was selected as the optimum length and was used for all the experiments described in this manuscript.
Figure 4.
Effect of the capillary length on the separation of the selected cations at 100 μmol L−1 each. Conditions: ESEP = 10 kV , 30 mmol L−1 MES and 30 mmol L−1 HIS + 3 mmol L−1 18-crown-6 as running buffer; 5 sec hydrodynamic injection. Original electropherograms included as Supplementary Information.
Effect of injection time
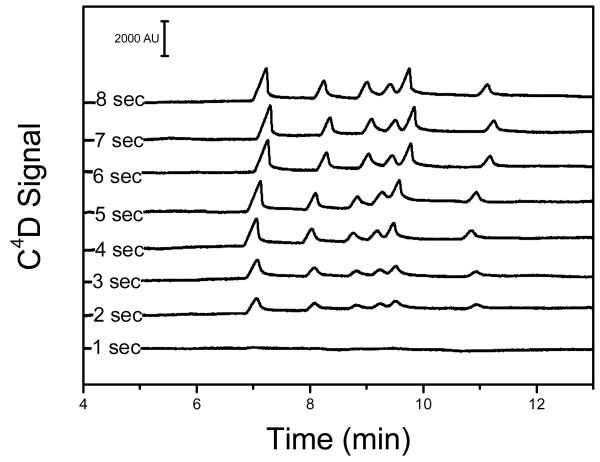
At any scale, obtaining a reproducible and representative sample injection has been deemed paramount for quantitative analytical applications.49 Although injections in microchips routinely rely on some variant of electrokinetic injection2, 50 (due to its simplicity), its performance can be significantly affected by EOF velocity, sample bias, sample conductivity, and electrolysis effects. Since these issues are particularly important for the analysis of small ions with high electrophoretic mobility, hydrodynamic injection (applying vacuum on the sample waste reservoir, for example) was selected for the experiments described in this manuscript. Besides being reproducible, this method avoids the use of additional hardware and is significantly simpler than previously proposed sample injection methods.51, 52 Although preliminary experiments were performed using a soldering iron pump (1700, Paladin Tools, USA), the house vacuum line (~70 psi) was used for the experiments herein described. The selected method yielded comparable results while enabling the control of the injection time. Next, the effect of injection time on signal magnitude was investigated over a range of 1 – 8 sec. As it can be observed in Figure 5, significant increases in signal (proportional to the injection time) were obtained in the 1 – 6 sec range. As further increases in injection time (in the 6 – 8 sec range) did not yield improvements in signal/noise, 6 sec was adopted as the optimal time for injection. Notably, no significant peak distortion was observed within the selected times, suggesting that only the center of the interconnect is being filled and that the sample plug is being pinched with flow from the separation channel and buffer reservoir.
Figure 5.
Effect of the injection time on the signal magnitude. Hydrodynamic injections were performed applying vacuum (~70 kPa) on the SW reservoir for the selected times. Migration order as shown in previous figures.
Analytical figures of merit
Using the optimized conditions for the separation and detection (10 kV as the separation potential, 30 mmol L−1 MES and 30 mmol L−1 HIS pH = 6.1 + 2 mmol L−1 18-crown-6 as running buffer; 6 sec hydrodynamic injection, and 60 cm capillary), linear relationships between the concentration and the C4D signal were obtained for the six cations analyzed up to 500 μM. At higher concentrations, significant co-migration of the ions was observed, precluding the analysis. The limit of detection for each cation was estimated using a signal/noise ratio of at least 3, obtained upon the injection of samples under the optimum conditions. The results corresponding to each calibration curve are summarized in Table 2.
Table 2.
Migration time (tM), sensitivity, coefficient of determination (R2), and calculated limit of detection (LOD) corresponding to the analysis of the selected inorganic cations under optimal conditions.
| Cation | tM (min) |
Sensitivity (AU μmol−1 L) |
R2 | LOD (μmol L−1) |
|---|---|---|---|---|
| NH4+ | 7.1 ± 0.1 | 7.7 ± 0.2 | 0.99 | 7 |
| K+ | 8.2 ± 0.1 | 4.1 ± 0.1 | 0.99 | 53 |
| Ca2+ | 8.9 ± 0.1 | 4.1 ± 0.1 | 0.99 | 38 |
| Na+ | 9.3 ± 0.1 | 4.9 ± 0.2 | 0.99 | 57 |
| Mg2+ | 9.6 ± 0.1 | 9.9 ± 0.5 | 0.98 | 45 |
| Li+ | 11.0 ± 0.1 | 3.2 ± 0.2 | 0.98 | 91 |
The proposed system provided similar sensitivity than other microfluidic systems coupled to C4D53 and conventional capillary electrophoresis systems when coupled to either indirect UV-vis54 or conductivity detection.55 Although these values were considered appropriate for the target application, alternative configurations can be selected to further improve the sensitivity.56
Analysis of soil samples
The identification and quantification of the components of each sample was performed by comparing the electropherograms obtained with standard solutions to those obtained with the corresponding samples under the optimal conditions. A main peak at 8.9 min was observed in all samples (data available in the Supplementary Information), with a migration time matching that of Ca2+. In two samples (AT40B1-44 and AT40B1-54), it was also possible to identify a second peak with much lower intensity that was assigned to Na+. Based on the peak intensity, the amount of Ca2+ was 20.4, 44.1, and 78.2 mg of Ca2+ per gram of soil in the samples marked as ATB1-40, ATB1-44, and ATB1-54, respectively. These findings are in agreement not only with previous reports describing the abundance of CaSO4 in such samples, but also with the results obtained by EDX (see Supplementary Information).
4. Conclusions
A new hybrid device, based on the use of 5 plastic microfluidic components, was fabricated quickly and inexpensively. Additionally, the new platform bypasses some of the traditional problems involving microchip fabrication, including large/specific machineries and lengthy assembly times. The platform itself is highly versatile and can be coupled with a number of inline detection methods, such as C4D or UV-Vis. The variable length of the separation channel adds another advantage in that the separations can be adjusted if necessary. The simplicity of the platform allows for customization in terms detection, capillary length, injection type (gated and pinched electrokinetic or hydrodynamic), and reservoir volumes. This device is an attractive approach for a portable analytical instrumentation capable of performing rapid analyses, as demonstrated through the conductimetric detection of inorganic cations.
Supplementary Material
Acknowledgements
The authors gratefully acknowledge the financial support provided by STTN/NASA (NNX12CG20P-1), The University of Texas at San Antonio and the National Institutes of Health through the National Institute of General Medical Sciences (1SC3GM081085, 2SC3GM081085) and the Research Centers at Minority Institutions (G12MD007591).
Footnotes
Alternatively, these pieces can be fabricated with a standard saw and drill set.
References
- 1.Kaigala GV, Hoang VN, Stickel A, Lauzon J, Manage D, Pilarski LM, Backhouse CJ. Analyst. 2008;133:331–338. doi: 10.1039/b714308g. [DOI] [PubMed] [Google Scholar]
- 2.Wu D, Qin J, Lin B. J. Chromatogr. A. 2008;1184:542–559. doi: 10.1016/j.chroma.2007.11.119. [DOI] [PMC free article] [PubMed] [Google Scholar]
- 3.Liu X, Lo RC, Gomez FA. Electrophoresis. 2009;30:2129–2133. doi: 10.1002/elps.200900041. [DOI] [PubMed] [Google Scholar]
- 4.Kutter JP. J. Chromatogr. A. 2012;1221:72–82. doi: 10.1016/j.chroma.2011.10.044. [DOI] [PubMed] [Google Scholar]
- 5.da Costa ET, Neves CA, Hotta GM, Vidal DT, Barros MF, Ayon AA, Garcia CD, do Lago CL. ELECTROPHORESIS. 2012;33:2650–2659. doi: 10.1002/elps.201200273. [DOI] [PubMed] [Google Scholar]
- 6.Mora MF, Greer F, Stockton AM, Bryant S, Willis PA. Anal. Chem. 2011;83:8636–8641. doi: 10.1021/ac202095k. [DOI] [PubMed] [Google Scholar]
- 7.Rodriguez I, Zhang Y, Lee HK, Li SF. J. Chromatogr. A. 1997;781:287–293. doi: 10.1016/s0021-9673(97)00667-5. [DOI] [PubMed] [Google Scholar]
- 8.Solignac D, Sayah A, Constantin S, Freitag R, Gijs MAM. Sens. Actuators, A. 2001;A92:388–393. [Google Scholar]
- 9.Berthold A, Laugere F, Schellevis H, de Boer CR, Laros M, Guijt RM, Sarro PM, Vellekoop MJ. Electrophoresis. 2002;23:3511–3519. doi: 10.1002/1522-2683(200210)23:20<3511::AID-ELPS3511>3.0.CO;2-C. [DOI] [PubMed] [Google Scholar]
- 10.Becker H, Locascio L. Talanta. 2002;56:267–287. doi: 10.1016/s0039-9140(01)00594-x. [DOI] [PubMed] [Google Scholar]
- 11.Castano-Alvarez M, Fernandez-Abedul MT, Costa-García A. Electrophoresis. 2005;26:3160–3168. doi: 10.1002/elps.200500148. [DOI] [PubMed] [Google Scholar]
- 12.Graβ B, Neyer A, Johnck M, Siepe D, Eisenbeiβ F, Weber G, Hergenroder R. Sens. Actuators, B. 2001;72:249–258. [Google Scholar]
- 13.Liu Y, Ganser D, Schneider A, Liu R, Grodzinski P, Kroutchinina N. Anal. Chem. 2001;73:4196–4201. doi: 10.1021/ac010343v. [DOI] [PubMed] [Google Scholar]
- 14.Duffy DC, McDonald JC, Schueller OJA, Whitesides GM. Anal. Chem. 1998;70:4974–4984. doi: 10.1021/ac980656z. [DOI] [PubMed] [Google Scholar]
- 15.McDonald JC, Whitesides GM. Acc. Chem. Res. 2002;35:491–499. doi: 10.1021/ar010110q. [DOI] [PubMed] [Google Scholar]
- 16.Roberts MA, Rossier JS, Bercier P, Girault H. Anal. Chem. 1997;69:2035–2042. doi: 10.1021/ac961038q. [DOI] [PubMed] [Google Scholar]
- 17.Lee GB, Chen SH, Huang GR, Sung WC, Lin YH. Sens. Actuators, B. 2001;B75:142–148. [Google Scholar]
- 18.Shadpour H, Musyimi H, Chen J, Soper SA. J. Chromatogr. A. 2006;1111:238–251. doi: 10.1016/j.chroma.2005.08.083. [DOI] [PubMed] [Google Scholar]
- 19.Rahbar M, Chhina S, Sameoto D, Parameswaran M. J. Micromech. Microeng. 2010;20:015026. [Google Scholar]
- 20.Abbasi F, Mirzadeh H, Katbab A-A. Polym. Int. 2001;50:1279–1287. [Google Scholar]
- 21.Belder D, Ludwig M. Electrophoresis. 2003;24:3595–3606. doi: 10.1002/elps.200305648. [DOI] [PubMed] [Google Scholar]
- 22.Garcia CD, Dressen BM, Henderson A, Henry CS. Electrophoresis. 2005;26:703–709. doi: 10.1002/elps.200410290. [DOI] [PubMed] [Google Scholar]
- 23.Hu S, Ren X, Bachman M, Sims CE, Li GP, Allbritton N. Anal. Chem. 2002;74:4117–4123. doi: 10.1021/ac025700w. [DOI] [PubMed] [Google Scholar]
- 24.Wang Y, Dubin PL. Anal. Chem. 1999;71:3463–3468. [Google Scholar]
- 25.Muck A, Svatos A. Talanta. 2007;74:333–341. doi: 10.1016/j.talanta.2007.09.012. [DOI] [PubMed] [Google Scholar]
- 26.Gabriel EFM, Duarte Junior GF, Garcia P. d. T., de Jesus DP, Coltro WKT. Electrophoresis. 2012;33:2660–2667. doi: 10.1002/elps.201200009. [DOI] [PubMed] [Google Scholar]
- 27.Martinez AW, Phillips ST, Butte MJ, Whitesides GM. Angew. Chem. Int. Ed. 2007;46:1318–1320. doi: 10.1002/anie.200603817. [DOI] [PMC free article] [PubMed] [Google Scholar]
- 28.Martinez AW, Phillips ST, Whitesides GM. P. Nat. Acad. Sci. 2008;105:19606–19611. doi: 10.1073/pnas.0810903105. [DOI] [PMC free article] [PubMed] [Google Scholar]
- 29.Martinez AW, Phillips ST, Whitesides GM, Carrilho E. Anal. Chem. 2009;82:3–10. doi: 10.1021/ac9013989. [DOI] [PubMed] [Google Scholar]
- 30.Yuen PK. Lab Chip. 2008;8:1374–1378. doi: 10.1039/b805086d. [DOI] [PubMed] [Google Scholar]
- 31.Rhee M, Burns MA. Lab Chip. 2008;8:1365–1373. doi: 10.1039/b805137b. [DOI] [PubMed] [Google Scholar]
- 32.Langelier SM, Livak-Dahl E, Manzo AJ, Johnson BN, Walter NG, Burns MA. Lab Chip. 2011;11:1679–1687. doi: 10.1039/c0lc00517g. [DOI] [PubMed] [Google Scholar]
- 33.Chen A, Pan T. Lab Chip. 2011;11:727–732. doi: 10.1039/c0lc00384k. [DOI] [PubMed] [Google Scholar]
- 34.Francisco KJM, do Lago CL. ELECTROPHORESIS. 2009;30:3458–3464. doi: 10.1002/elps.200900080. [DOI] [PubMed] [Google Scholar]
- 35.Skelley AM, Aubrey AD, Willis PA, Amashukeli X, Ehrenfreund P, Bada JL, Grunthaner FJ, Mathies RA. J. Geophys. Res. 2007;112:G04S11. [Google Scholar]
- 36.Brito-Neto JGA, Fracassi da Silva JA, Blanes L, do Lago CL. Electroanalysis. 2005;17:1207–1214. [Google Scholar]
- 37.Brito-Neto JGA, Fracassi da Silva JA, Blanes L, do Lago CL. Electroanalysis. 2005;17:1198–1206. [Google Scholar]
- 38.Tanyanyiwa J, Hauser PC. Anal. Chem. 2002;74:6378–6382. doi: 10.1021/ac020489+. [DOI] [PubMed] [Google Scholar]
- 39.Mahabadi KA, Rodriguez I, Lim CY, Maurya DK, Hauser PC, de Rooij NF. Electrophoresis. 2010;31:1063–1070. doi: 10.1002/elps.200900578. [DOI] [PubMed] [Google Scholar]
- 40.Pumera M, Wang J, Opekar F, Jelínek I, Feldman J, Löwe H, Hardt S. Anal. Chem. 2002;74:1968–1971. doi: 10.1021/ac011219e. [DOI] [PubMed] [Google Scholar]
- 41.Mori M, Kaseda M, Yamamoto T, Yamada S, Itabashi H. Anal. Bioanal. Chem. 2012;402:2425–2430. doi: 10.1007/s00216-011-5688-6. [DOI] [PubMed] [Google Scholar]
- 42.Noblitt SD, Henry CS. In: Capillary Electrophoresis and Microchip Capillary Electrophoresis. Principles, Applications, and Limitations. Editon edn. Garcia CD, Chumbimuni-Torres K, Carrilho E, editors. John Wiley & Sons; Hoboken, NJ: 2013. pp. 177–200. [Google Scholar]
- 43.Francois C, Morin P, Dreux M. J. Chromatogr. A. 1995;706:535–553. [Google Scholar]
- 44.Kubáň P, Kubáň P, Kubáň V. Electrophoresis. 2002;23:3725–3734. doi: 10.1002/1522-2683(200211)23:21<3725::AID-ELPS3725>3.0.CO;2-9. [DOI] [PubMed] [Google Scholar]
- 45.Wang J, Pumera M, Collins G, Opekar F, Jelinek I. Analyst. 2002;127:719–723. doi: 10.1039/b201700h. [DOI] [PubMed] [Google Scholar]
- 46.Karger AE. Electrophoresis. 1996;17:144–151. doi: 10.1002/elps.1150170124. [DOI] [PubMed] [Google Scholar]
- 47.Oguri S, Hibino M, Mizunuma M. Electrophoresis. 2004;25:1810–1816. doi: 10.1002/elps.200305945. [DOI] [PubMed] [Google Scholar]
- 48.Dolnik V, Liu S, Jovanovich S. Electrophoresis. 2000;21:41–54. doi: 10.1002/(SICI)1522-2683(20000101)21:1<41::AID-ELPS41>3.0.CO;2-7. [DOI] [PubMed] [Google Scholar]
- 49.Saito RM, Coltro WKT, de Jesus DP. Electrophoresis. 2012;33:2614–2623. doi: 10.1002/elps.201200089. [DOI] [PubMed] [Google Scholar]
- 50.Gong M, Wehmeyer KR, Stalcup AM, Limbach PA, Heineman WR. Electrophoresis. 2007;28:1564–1571. doi: 10.1002/elps.200600616. [DOI] [PMC free article] [PubMed] [Google Scholar]
- 51.Wang J, Chen G, Muck A, Jr., Collins GE. Electrophoresis. 2003;24:3728–3734. doi: 10.1002/elps.200305593. [DOI] [PubMed] [Google Scholar]
- 52.Zhang L, Yin X, Fang Z. Lab Chip. 2006;6:258–264. doi: 10.1039/b511924c. [DOI] [PubMed] [Google Scholar]
- 53.Segato TP, Coltro WKT, de Jesus Almeida AL, de Oliveira Piazetta MH, Gobbi AL, Mazo LH, Carrilho E. Electrophoresis. 2010;31:2526–2533. doi: 10.1002/elps.201000099. [DOI] [PubMed] [Google Scholar]
- 54.Beck W, Engelhardt H. Chromatographia. 1992;33:313–316. [Google Scholar]
- 55.Fracassi da Silva JA, do Lago CL. Anal. Chem. 1998;70:4339–4343. [Google Scholar]
- 56.Tanyanyiwa J, Galliker B, Schwarz MA, Hauser PC. Analyst. 2002;127:214–218. [Google Scholar]
Associated Data
This section collects any data citations, data availability statements, or supplementary materials included in this article.


