

Abstract
Many bacterial species, such as the alphaproteobacterium Sinorhizobium meliloti, are characterized by open pangenomes and contain multipartite genomes consisting of a chromosome and other large-sized replicons, such as chromids, megaplasmids, and plasmids. The evolutionary forces in both functional and structural aspects that shape the pangenome of species with multipartite genomes are still poorly understood. Therefore, we sequenced the genomes of 10 new S. meliloti strains, analyzed with four publicly available additional genomic sequences. Results indicated that the three main replicons present in these strains (a chromosome, a chromid, and a megaplasmid) partly show replicon-specific behaviors related to strain differentiation. In particular, the pSymB chromid was shown to be a hot spot for positively selected genes, and, unexpectedly, genes resident in the pSymB chromid were also found to be more widespread in distant taxa than those located in the other replicons. Moreover, through the exploitation of a DNA proximity network, a series of conserved “DNA backbones” were found to shape the evolution of the genome structure, with the rest of the genome experiencing rearrangements. The presented data allow depicting a scenario where the pSymB chromid has a distinctive role in intraspecies differentiation and in evolution through positive selection, whereas the pSymA megaplasmid mostly contributes to structural fluidity and to the emergence of new functions, indicating a specific evolutionary role for each replicon in the pangenome evolution.
Keywords: chromid, pangenome, bacteria, selection
Introduction
The dynamics of prokaryotic genome evolution are different from those of eukaryotic organisms (Koonin and Wolf 2010; Koonin 2011), due to the undefined boundaries between species (Gogarten and Townsend 2005), the horizontal gene transfer (Boto 2010), and the tendency to genome reduction in bacteria (Koonin 2009; Kuo et al. 2009). In particular, at the intraspecies scale, genomes of different bacterial strains often present large genomic differences, and the concept of pangenome has been developed to take into account these differences (Tettelin et al. 2008). More precisely, a bacterial pangenome is composed by a core fraction, common to all strains, and a dispensable part that comprises, in turn, a unique (including all singleton genes) and an accessory component. The dispensable genome, which can account for a large fraction of the entire pangenome, has been shown to harbor genes related to local adaptation, originated by relatively recent horizontal gene transfer events (Medini et al. 2008), and it may explain phenotypic differences found in natural strains (Biondi et al. 2009) and the lifestyle of a given species (Tettelin et al. 2008). Concerning genome structure, several species contain multipartite genomes, which are composed by several replicons, often showing sizes as large as that of the chromosome. Such additional large replicons are collectively called megaplasmids, but recently a new term, “chromid,” has been proposed to better describe the biological features of several megaplasmids, which present housekeeping functions, so they are chromosome-like and plasmid replication and partition systems (Harrison et al. 2010). Chromids have been claimed as genera-specific elements, whereas megaplasmids, because of their possible more recent origin, could better define interspecies boundaries inside a genus. However, it is still unclear whether chromosome, chromids, and megaplasmids may have common or distinct evolutionary routes at the intraspecific level.
Sinorhizobium meliloti is one of the most investigated bacterial species for symbiotic interaction with plants (Gibson et al. 2008); it is found as a free-living bacterium in most of temperate soils, as a symbiont in the root nodules of host leguminous plants, mainly of genera Medicago, Melilotus, and Trigonella (Fabaceae) (Sprent 2001), and also an endophyte in host legumes (Pini et al. 2012) or nonhost plant species (Chi et al. 2005). As a model in evolutionary genomics, S. meliloti is particularly attractive because strains of this species harbor large and typically multipartite genomes with a chromosome, a chromid, a megaplasmid, plus additional smaller plasmids (Krawiec and Riley 1990; Galibert et al. 2001; Galardini et al. 2011; Tian et al. 2012). This organization could in principle favor three levels of genome variability, the smaller plasmids and the megaplasmids being more strain specific and of recent origin, whereas the chromid and the chromosome being less variable and more genus specific and of ancient origin. Consequently, the S. meliloti pangenome can be considered as a “time machine” of pangenome evolution.
Previous population genetics investigations have shown that strains of S. meliloti are highly variable, and various studies explored the relationship between the pattern of genetic variation and environmental variables (Paffetti et al. 1996, 1998; Carelli et al. 2000; Jebara et al. 2001; Bailly et al. 2006; Talebi Bedaf et al. 2008; Trabelsi et al. 2010), highlighting the influence of both host plant genotype and geographical separation on S. meliloti populations. More recently, both S. meliloti and its cogeneric species S. medicae have been used in parallel for population genomics investigations (Guo et al. 2009; Bailly et al. 2011; Epstein et al. 2012). Finally, the first comparative genomic study with three complete genomes (Galardini et al. 2011) showed that the pangenome of S. meliloti is indeed highly variable, providing the basis for more detailed genomic comparison and microevolutionary investigations. Further investigation of those strains showed a high phenotypic variability for both symbiotic and nonsymbiotic phenotypes (Biondi et al. 2009); however, their relevance for environmental adaptation is still unknown.
Several studies in the last years have applied comparative genomics to describe the pangenome and genome-to-genome variability at the intraspecific scale in bacteria (see e.g., Brosch et al. 2001; Edwards et al. 2002; Deng et al. 2003, 2010; Mols 2007; Rasko et al. 2008; Cho et al. 2010; Frandi et al. 2010; Lukjancenko et al. 2010; Galardini et al. 2011; Epstein et al. 2012; Tian et al. 2012), emphasizing the potential importance of the dispensable genome for virulence and adaptation; however, the evolutionary explanation of the existence of large multipartite genomes in bacteria and especially the role of chromids in strains differentiation are still obscure. The aim of this work was consequently to use the genomic sequences of S. meliloti strains to investigate multireplicon genome dynamics at the intraspecies level in bacteria, trying to understand what was the role of core and dispensable genome in intraspecific differentiation and if different replicons followed different evolutionary routes.
Materials and Methods
Bacterial Strains Isolation
Supplementary table S1, Supplementary Material online, lists all S. meliloti strains used in this work. All strains indicated as Italian, but H1, were isolated at the Italian Agricultural Research Council-Fodder and Dairy Productions Research Centre (CRA-FLC), Lodi, Italy, from root nodules of alfalfa (Medicago sativa) in the course of a long-term experiment (Carelli et al. 2000). H1 was isolated as endophyte from surface-sterilized leaves of M. sativa grown in a field in Prato, Italy, after plating the leaf homogenate on TY medium (Beringer 1974) and then screening the obtained bacterial isolates (∼300) with S. meliloti-specific primers (Trabelsi et al. 2009). This screening procedure allowed to identify one S. meliloti isolate, which was confirmed by 16S ribosomal RNA (rRNA) gene sequencing and designed with the code S. meliloti H1. Original specimen for this strain is conserved in the strain collection of the Department of Biology, University of Florence (BIO). All specimens for the other Italian strains are conserved both at BIO and at the strain collection of the Italian Agricultural Research Council-Fodder and Dairy Productions Research Centre (CRA-FLC), Lodi, Italy. All AK-coded strains were initially isolated from root nodules of Medicago plants in the North Aral Sea region in Kazakhstan and are deposited, as original specimens after initial isolation, in the culture collection of All-Russia Institute of Agricultural Microbiology (St. Petersburg, Russia) and as duplicated at BIO. Strain 1A42 was isolated from root nodules of alfalfa in Iran (Talebi Bedaf et al. 2008) and deposited at BIO by M. Talebi Bedaf. Rm1021 is the model strain for S. meliloti. It was originally isolated as a Tn5 mutant of strain SU47 (RCR2011 = NZP4009 = LMG 6130) (Meade et al. 1982), and its genome was completely sequenced in 2001 (Galibert et al. 2001). Sinorhizobium meliloti BL225C and AK83 strains (Galardini et al. 2011), whose genomes have been completely sequenced (Galardini et al. 2011), are also deposited at the German Collection of Microorganisms and Cell Cultures (DSMZ). Strain SM11 was sequenced by CeBiTec (Bielefeld, Germany) and was originally isolated as the dominant, indigenous S. meliloti strain during a long-term field release experiment in Germany with genetically modified S. meliloti strains (Schneiker-Bekel et al. 2011).
Whole-Genome Shotgun Sequencing and Assembly
Total DNA was isolated from S. meliloti cultures on liquid TY medium (Beringer 1974) with a cetyl trimethylammonium bromide (CTAB) method (Galardini et al. 2011). Genome sequencing was performed at the IGA Technology Services (http://www.igatechnology.com/), Udine, Italy, using an Illumina HiSeq2000 with pair-end sequencing (Bennett 2004), yielding reads with length of 100 bp. The raw sequences were checked with FastQC (http://www.bioinformatics.babraham.ac.uk/projects/fastqc/), then the first four bases at the 5′-end were trimmed to remove low-quality bases and a dynamic trimming was applied on reads ends, imposing a minimum read length of 34 bases and a minimum quality of 20. The trimmed reads were assembled using Abyss v1.3.0 (Simpson et al. 2009), using the default parameters and with a k size of 35 or 45, depending on the number and average length of the output contigs. Phrap (de la Bastide and McCombie 2007) was then used to find putative contigs overlap, using the following parameters: repeat_stringency = 0.99, maxgap = 0, minmatch = 45, forcelevel = 0, and penalty = −20. The putative contigs overlap were checked with Tablet (Milne et al. 2010), merging those contigs with no mismatches or gaps in the overlapping regions. Contigs below 1,000 bp were discarded. The number of reads, contigs, and the degree of coverage are reported in supplementary table S2, Supplementary Material online. The sequences have been deposited in GenBank: The BioProject and GenBank IDs are reported in supplementary table S1, Supplementary Material online.
Annotation and Storage
Protein-coding sequences predictions were performed using Prodigal v2.0 (Hyatt et al. 2010), rRNA were predicted using rnammer v1.2 (Lagesen et al. 2007), whereas transfer RNA (tRNA) were predicted using tRNAscan-SE v1.3 (Lowe and Eddy 1999). Protein sequences were annotated using blast2go (Conesa et al. 2005), Interproscan v4 with domain database v34 (Zdobnov and Apweiler 2001), the KAAS web server (Moriya et al. 2007); homologies with RhizoBase (http://genome.kazusa.or.jp/rhizobase) and Clusters of Orthologous Groups (COG) (Tatusov et al. 2001) were assessed using Blast+ v2.2.25 (Camacho et al. 2009). Replicon sizes in the newly sequenced genomes were estimated using CONTIGuator v2.5 (Galardini, Biondi, et al. 2011), using the average number of base pairs mapping to the four S. meliloti complete genomes. All the sequences, plus annotations, and analyses were stored in a MySQL relational database.
Orthology
Two distinct algorithms were used for orthologous clusters construction, using the protein sequences as inputs: a reciprocal best-blast hit (BBH) approach (Altenhoff and Dessimoz 2009), with e-value threshold of 1e−10, BLOSUM80 matrix, and the combination of InParanoid (Remm et al. 2001) and MultiParanoid (Alexeyenko et al. 2006). The BBH algorithm was applied in a sequential fashion, picking up one genome at a time and using each protein as a query for a BBH search against each other genome, thus constructing a group of orthologs: If a genome was found as not represented in a group, the BBH search is done again using the orthologs of the starting protein, thus avoiding the bias introduced by the specific genome order used (Popa et al. 2011). The similarity at the gene level between the genomes of this study has been estimated using the genomic fluidity metric (Kislyuk et al. 2011), using the InParanoid approach, via the calculation of all the possible pairwise clusters, and also to verify the openness of the S. meliloti pangenome using different pangenome sizes (2, 3, 4, 5, 6, 7, 10, 13 and 14). Summary pie charts were drawn using Krona (Ondov et al. 2011).
Phylogenetic Reconstruction
The BBH clusters’ core genome phylogenetic relationships were analyzed by using a concatemer composed of 2,695 coding sequences (CDS), using the corresponding nucleotide sequences for each protein and discarding those core genes with a difference in length above 60 bp in one of the 14 strains, to remove those genes present as fragments due to the draft status of 10 genomes of the data set. Replicon-specific alignments were performed dividing the 2,695 CDS according to the replicon of origin. Upstream regions of the core genes were retrieved, discarding the sequences below 5 bp, resulting in 2,004 sequences concatemer. Nucleotide sequences were aligned using MUSCLE (Edgar 2004), and the Bayesian dendrogram was inferred with MrBayes v3.2.0 (Huelsenbeck and Ronquist 2001). The best DNA substitution model and distance matrices were inferred with MEGA v5 (Tamura et al. 2011). Neighbor-joining dendrogram of accessory genome was computed with Past v2.13 (Hammer et al. 2001) from Jaccard similarity distances among strains derived from the presence/absence matrix of orthologs in the accessory genome. TreeView v1.6.6 (Page 1996) was used to display dendrogram topologies. The strains were clustered using the dendrogram data, using the Phylo-MCOA R package (de Vienne et al. 2012) (to convert the dendrograms into distance matrices) and the scikits.learn mean-shift unsupervised clustering algorithm (Pedregosa et al. 2011 and http://scikit-learn.org/). MantelTester (Bonnet and Van de Peer 2002) was used for computing correlation values between distance matrices within core portions (chromosome, megaplasmid pSymA, and chromid pSymB) and between core and accessory genome distance matrices.
Purifying and Positive Selection Signatures Detection
The protein sequences derived from the concatemer used in the phylogenetic reconstruction were aligned with MUSCLE (Edgar 2004), and the alignments were then converted to nucleotide sequences and used as input for the codeml program, from the PAML package, version 4.6 (Yang 1997), using models M1a and M2a and the tree generated by the phylogenetic reconstruction as guide. A gene was considered to be positively selected with dn/ds >1 at P value < 0.01 for both χ2 test and Posterior Bayesian Probability. The same alignments were used as an input for the SLR program version 1.4.1 (Massingham and Goldman 2005), used to confirm the positive selection signatures and to detect the genes under purifying selection: A probability score of 99% and a likelihood ratio test (LRT) score ≥ 9.21 were used as thresholds. Signs of recombination were checked using the PhyML_multi software, but no gene was found to harbor signs of recombination (Boussau et al. 2009). The proportional differences in the COG categories have been analyzed by computing the proportion of each category for the positively selected genes and all the other genes, then for each category by computing the difference between the two proportions divided by the proportion seen for the genes not positively selected.
Taxonomic Distribution
Taxonomic distribution of the pangenome CDS was assessed using TaxonomyBlaster (available upon request) with the same approach described in the work of Pini et al. (2011): The proteins contained in the nr database (downloaded on September 2011) have been divided according to the NCBI taxonomy in a series of smaller databases, one for each phylum inside the kingdom Bacteria (excluding the “environmental classes”). The Proteobacteria phylum has been divided into distinct classes, including also the Alphaproteobacteria class. Each one of these smaller databases has been queried with all the proteins of the pangenome through a Blast search, with the same parameters of Pini et al. Each taxonomic group has been analyzed independently, using the InParanoid clusters: An orthologous group (OG) was considered as mapped to a certain taxonomic group if existed at least one hit with e-value 1e−10, index ≥0.33, and coverage ≥0.66. The proportional differences in the COG categories have been analyzed by computing the proportion of each category for the Proteobacteria classes and the other taxonomic phyla, then for each category by computing the difference between the two proportions divided by the proportion seen for the other bacterial phylum.
Structural Genomics
The newly sequenced genomes replicons were estimated using CONTIGuator v2.6 (Galardini, Biondi, et al. 2011), using as reference the closest closed genome in the phylogenetic tree. Pairwise whole-genome alignments were performed on the whole-genome concatemer produced by CONTIGuator using the megablast algorithm from Blast+ (Camacho et al. 2009), with an e-value threshold of 1e−10 and an alignment size above 10,000 bp; The alignment were visualized using the GenomeDiagram (Pritchard et al. 2006) module inside the BioPython library (Cock et al. 2009). The orthologs’ contiguous regions were constructed using the InParanoid clusters. The DNA proximity network was constructed using the backbone file from a Progressive Mauve analysis using the CONTIGuator scaffolds as input as an approximation of the complete genome (Darling et al. 2004). Each node in the network represents a nucleotide region present in one or more strains, whereas the edges represent the proximity of each region to the others, the weight of the edge being proportional to the number of times each link is observed in the pangenome. The DNA backbones were found via the application of a pruning filter over the edges, keeping those edges with higher weight: A weight range between 10 and 14 was chosen, considering the presence of four complete genomes in the data set. Replicon-specific backbones were found by removing those nodes not mapped to the replicon of interest. Network parameters were computed using networkx (http://networkx.lanl.gov/), using Gephi (Mathieu et al. 2009) for the visualization.
COG Categories and Replicons Enrichment
The significance of the observed differences in the COG categories and in the presence of the positively selected genes in each replicon was validated with a Fisher's exact test, as implemented in the DendroPy package (Sukumaran and Holder 2010).
Results and Discussion
Whole-Genome Microevolution: Sinorhizobium meliloti Has a Typical Open Pangenome
The draft genome sequences of 10 S. meliloti strains reported in table 1 were produced as described in Materials and Methods section. The comparison of those 10 genomes with the complete sequences of the four strains already available at December 2011 (Rm1021, AK83, BL225C, and SM11) showed that genome sizes varied from 6.69 Mb (Rm1021) to 8.94 Mb (5A14), with an average GC content of 61.9%. The number of ORFs ranged from 6,218 (Rm1021) to 8,735 (5A14). The partial assembly of the new genomes was performed by contigs mapping with the four completely assembled genomes (Rm1021, AK83, BL225C, and SM11): Interestingly, the newly sequenced genomes also possessed sequences belonging to “rare” accessory plasmids such as pSINME01 and pSINME02 of strain AK83, and pSme11a and pSme11b of strain SM11. In particular, all 10 newly sequenced genomes contained sequences found in the accessory pSINME01 plasmid of strain AK83. Finally, 30% of ORFs had no predicted function, whereas the proportion of proteins annotated by standard annotation sources ranged from 44.8% (Kyoto Encyclopedia of Genes and Genomes [KEGG]) to 83.3% (Interpro). The highest annotation signal for all genomes was found, as expected, by homology with genes present in the Rhizobase (86.4%).
Table 1.
Main Features of the 14 Sinorhizobium meliloti Genomesa
| Strains |
||||||||||||||
|---|---|---|---|---|---|---|---|---|---|---|---|---|---|---|
| 1A42 | 5A14 | A0641M | A0643DD | AE608H | AK11 | AK75 | C0431A | C0438LL | H1 | Rm1021 | AK83 | BL225C | SM11 | |
| General stats | ||||||||||||||
| Length (bp) | 7,162,724 | 8,942,552 | 7,953,713 | 7,351,905 | 7,347,181 | 6,843,938 | 6,992,595 | 7,086,830 | 7,064,773 | 6,923,151 | 6,691,694 | 7,140,471 | 6,978,785 | 7,499,157 |
| G + C content | 62.02 | 61.98 | 61.88 | 61.84 | 62.00 | 62.03 | 61.86 | 61.96 | 61.96 | 61.96 | 0.61 | 0.62 | 0.62 | 61.91 |
| Coding % | 85.25 | 85.57 | 85.17 | 85.28 | 85.46 | 85.75 | 85.28 | 85.20 | 85.44 | 85.11 | 86.13 | 82.53 | 84.56 | 86.40 |
| Coding | 6,106,284 | 7,652,148 | 6,774,171 | 6,269,850 | 6,279,117 | 5,868,819 | 5,963,196 | 6,037,653 | 6,035,811 | 5,892,396 | 5,763,546 | 5,893,086 | 5,901,528 | 6,479,490 |
| ORFs | 7,374 | 8,735 | 8,411 | 7,771 | 7,197 | 6,895 | 7,555 | 7,386 | 7,242 | 6,993 | 6,218 | 6,518 | 6,359 | 7,428 |
| rRNA | 6 | 24 | 9 | 4 | 18 | 2 | 5 | 2 | 5 | 9 | 9 | 9 | 9 | 9 |
| tRNA | 56 | 78 | 63 | 51 | 63 | 47 | 56 | 48 | 52 | 52 | 54 | 56 | 55 | 56 |
| Annotation stats (%)b | ||||||||||||||
| No function | 30.47 | 30.02 | 34.70 | 34.15 | 31.22 | 28.66 | 31.41 | 31.02 | 31.61 | 29.73 | 23.72 | 28.91 | 25.93 | 32.77 |
| ORFans | 3.38 | 3.57 | 3.67 | 3.35 | 1.92 | 3.16 | 3.45 | 2.40 | 3.02 | 2.89 | 1.74 | 2.75 | 0.30 | 0.70 |
| COG | 69.53 | 69.98 | 65.30 | 65.85 | 68.78 | 71.34 | 68.59 | 68.98 | 68.39 | 70.27 | 76.28 | 71.09 | 74.07 | 67.23 |
| Interpro | 87.86 | 86.14 | 84.65 | 85.28 | 85.24 | 88.69 | 87.66 | 85.96 | 86.33 | 88.15 | 88.68 | 84.84 | 87.42 | 81.35 |
| GO | 62.19 | 63.18 | 59.09 | 59.85 | 62.05 | 63.90 | 61.69 | 61.72 | 61.39 | 62.81 | 67.88 | 64.32 | 66.06 | 61.16 |
| KEGG | 44.36 | 45.20 | 41.31 | 41.56 | 44.69 | 45.82 | 43.35 | 43.39 | 43.84 | 44.96 | 50.63 | 46.59 | 48.51 | 43.09 |
| Rhizobasec | 87.32 | 78.95 | 83.21 | 84.00 | 84.80 | 88.70 | 87.40 | 86.79 | 85.97 | 88.07 | 92.23 | 87.48 | 90.64 | 84.05 |
| Replicon sizes (bp) | ||||||||||||||
| Chromosome | 3,731,100 | 4,990,772 | 4,063,405 | 3,643,054 | 3,891,677 | 3,572,765 | 3,447,294 | 3,613,238 | 3,588,400 | 3,558,302 | 3,650,000 | 3,820,000 | 3,670,000 | 3,908,022 |
| Chromid pSymB | 1,588,418 | 1,878,443 | 1,754,039 | 1,593,848 | 1,630,437 | 1,565,308 | 1,647,631 | 1,558,480 | 1,626,313 | 1,603,718 | 1,680,000 | 1,680,000 | 1,690,000 | 1,632,395 |
| Megaplasmid pSymA | 1,396,116 | 1,506,164 | 1,457,555 | 1,307,958 | 1,285,253 | 1,387,542 | 1,518,412 | 1,389,865 | 1,313,050 | 1,374,799 | 1,350,000 | 1,310,000 | 1,610,000 | 1,633,319 |
| pSINME01 | 209,195 | 232,672 | 111,645 | 136,588 | 125,681 | 109,990 | 76,265 | 112,338 | 94,450 | 127,226 | 260,000 | |||
| pSINME02 | 11,278 | 25,905 | 7,018 | 70,000 | ||||||||||
| pSmeSM11b | 140,640 | 178,756 | 63,273 | 122,560 | 132,879 | 11,263 | 33,722 | 71,081 | 13,413 | 181,251 | ||||
| pSmeSM11a | 14,949 | 3,811 | 232,455 | 19,702 | 14,801 | 3,810 | 144,170 | |||||||
| Not mapped | 82,306 | 155,746 | 499,985 | 304,164 | 281,255 | 151,462 | 269,272 | 398,109 | 360,652 | 245,693 | ||||
aThe general statistics and the putative mapping of reads to the six replicons present in the completely sequenced genomes (Rm1021, AK83, BL225C, and SM11) are reported.
bPercentage on total ORFs.
cRm1021 is excluded.
The pangenome of the 14 strains used in this study has been computed using two different methods (InParanoid and BBH, see Materials and Methods); the first method allows the detection of inparalogs (O'Brien et al. 2005) and its algorithmic complexity allows the classification of the pangenome as “open” or “closed," because all the pairwise genomic comparisons are computed before the clusterization step, whereas the BBH approach allows only one protein for each genome in each OG, therefore being more suitable for the alignments used in the phylogenetic analysis. The total 102,082 ORFs found in the 14 genomes have been used for the definition of the S. meliloti pangenome of 14 strains: A set of 12,162/19,447 OGs (using InParanoid or BBH, respectively) was identified (supplementary tables S3a and S3b, Supplementary Material online); a subset of 3,989/4,685 OGs was conserved across all genomes (core genome) (supplementary fig. S1, Supplementary Material online). The remaining 8,173/14,762 OGs were defined as members of the dispensable genome, with a similar number or accessory OGs (4,596/4,602) and a slightly different number of unique OGs (3,577/10,160). The differences in the number of OGs found with the two methods (especially for the unique genome fraction) is mostly due to the presence of paralogs detected by the InParanoid method: In fact, 3,265 OGs have been found to contain at least one paralog (totaling 8,025 paralog proteins). Figure 1 summarizes the results obtained comparing the 14 genomes of S. meliloti strains in relationship to the core and dispensable (accessory plus unique genes) genome. Sinorhizobium meliloti appears to have an open pangenome, fitting the general Heaps law, n = κNγ, with γ > 0 (Tettelin et al. 2008) but has also a relatively stable core genome, accounting for slightly less than 4,000 OGs. Another measure of genomic similarity at the gene level is genomic fluidity (φ), which is 0.32 for these S. meliloti genomes, in the range found for intraspecies polymorphism (Kislyuk et al. 2011) and in agreement with that of other rhizobial species (Tian et al. 2012).
Fig. 1.—
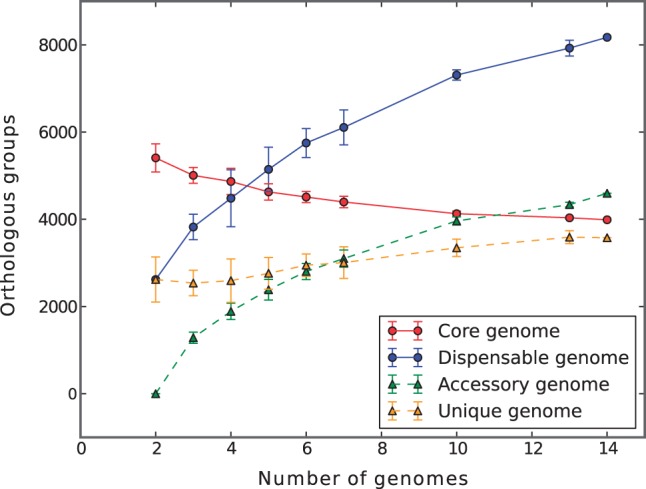
Sinorhizobium meliloti pangenome permutations statistics. Each point indicates the number of orthologs that are found in each pangenomic fraction. The trend lines on the median values are shown.
Core and Dispensable Genome Microevolution: Replicon-Based, Intraspecies Differentiation
Because the evolutionary dynamics in bacteria are different in the core and the dispensable genomes, we analyzed separately the genetic relationships among the 14 strains by using core genome loci and the pattern of differential occurrence of genes in the accessory genome (see Materials and Methods). Moreover, for the core genome, individual analyses of the three main single replicons and also of noncoding sequences were performed.
Concerning core genome diversity, four Bayesian dendrograms were reconstructed based on a concatemer of nucleotide sequences of most of the core genome CDSs (see Materials and Methods) and noncoding sequences mapped to the chromosome, pSymB, and pSymA (fig. 2a). Moreover, a dendrogram with a concatemer of nucleotide sequences of all CDS shared between the 14 S. meliloti strains, S. fredii NGR234, and S. medicae WSM419 was constructed (supplementary fig. S2, Supplementary Material online), showing that S. meliloti strains, even though they are similar to S. fredii NGR234 and S. medicae WSM419, are well separated from these two latter strains and form a monophyletic group.
Fig. 2.—

Dendrograms of 14 Sinorhizobium meliloti strains based on pangenome content. Gray shades indicate the dendrogram’s clusters, and strain names and branches are colored after the geographical origin of each strain (black: reference strain Rm1021; red: Germany; yellow: Iran; and blue: Kazakhstan; green: Italy). (a) Bayesian consensus dendrogram of S. meliloti strains from core genome sequences alignments; both coding and noncoding sequences dendrogram are reported. All represented nodes have a posterior probability equal to 1. (b) Neighbor-joining dendrograms with respect to the pattern of occurrence of 4,602 accessory orthologs in the accessory genome. The concatemer for the dendrograms of coding sequences is formed by 883,803 sites (7,921 polymorphic, 4,626 parsimony informative) from the whole core genome; 629,418 sites (2,498 polymorphic, 1,104 parsimony informative) from the chromosomal genes; 178,901 sites (4,023 polymorphic, 2,513 parsimony informative) from the chromid pSymB; and 75,291 sites (1,400 polymorphic, 391 parsimony informative) from the megaplasmid pSymA. For the dendrograms of noncoding sequences, concatemer is formed by 210,215 sites (6,215 polymorphic, 3,608 parsimony informative) from the whole core genome; 295,554 sites (1,537 polymorphic, 414 parsimony informative) from the chromosomal genes; 109,256 sites (3,160 polymorphic and 2,083 parsimony informative) from the chromid pSymB; and 71,405 sites (1,518 polymorphic and 1,111 parsimony informative) from the megaplasmid pSymA.
Additionally, to evaluate accessory genome relationships, a dendrogram from differential occurrence of accessory OGs was computed (fig. 2b). The intraspecific distances have been extracted from the dendrograms and used to clusterize the strains for each dendrogram (see Materials and Methods). In general, two to five clusters were detected for the 14 strains. The overall trees showed differential clusterizations: The coding fraction in the total tree and the coding fraction of pSymB chromid showed a three-cluster arrangement that was also found in all the partitions of the pSymA megaplasmid. The megaplasmid shows a similar signature, even at the accessory genome level. The Kazakhstan strains clustered together in all the fraction of pSymA megaplasmid and in total and pSymB chromid coding fraction in agreement with previous observations about the role of geographical isolation in S. meliloti differentiation (Talebi Bedaf et al. 2008). The chromosome showed a higher compactness, as expected for this more evolutionary conserved replicon, with two clusters for the coding and the accessory component and three clusters for the noncoding component. The pSymB chromid showed the highest number of clusters, 3 for the coding component and 5 for the noncoding and the accessory components, suggesting a prominent role of this replicon for the differentiation within the S. meliloti species.
To quantitatively evaluate the similarity in the pattern of differentiation among strains due to the core genome and to the accessory genome, Mantel’s tests were carried out comparing the distance matrices obtained from core genome and accessory genome (supplementary table S4, Supplementary Material online). Significant values for r Mantel’s coefficient were found in all comparison, and the highest r value (r = 0.778) was obtained for pSymA megaplasmid, confirming earlier reports on the main role of pSymA megaplasmid on dispensable genome dynamics (Giuntini et al. 2005; Guo et al. 2009; Galardini et al. 2011) and then on strains differentiation. Moreover, distance matrices based on the three main replicons CDSs were only partially (though significantly) correlated with r = 0.623 (P < 0.001) for pSymB-pSymA, r = 0.510 for pSymA-chromosome, and r = 0.524 (P < 0.001) for pSymB-chromosome. The same approach was used to compare distance matrices of CDSs and surrounding noncoding regions, and, as expected, high correlation values were found r = 0.862, 0.902, and 0.930 for chromosome, pSymB chromid, and pSymA megaplasmid, respectively (P < 0.001), suggesting a strong hitchhiking between CDS and their flanking noncoding regions.
Evolutionary Pressure on CDS: Replicon-Based Patterns of Positive Selection
To detect whether the different evolutionary forces acting on the three main replicons (chromosome, pSymB chromid, and pSymA megaplasmid) affect gene evolution through purifying and positive selection, a genome-wide scan for genes subjected to these evolutionary forces was performed following a general computational approach previously used in several bacterial species (Biswas and Akey 2006; Petersen et al. 2007). Within 2,695 core aligned OGs, a total of 10 OGs under purifying selection were detected, as well as 313 positively selected OGs (supplementary table S5 and fig. S3, Supplementary Material online). The number of OGs experiencing purifying selection may have been underestimated due to the high sequence similarity found in the core genome of the 14 strains of this study: In fact, 17.7% of the core OGs have identical protein sequences in all the strains. The genes under purifying selection were evenly distributed in the three main replicons and comprised the fixO1 gene involved in nitrogen fixation, as well as bacA, which encodes for one of the key factors for the establishment of an effective symbiosis (Glazebrook et al. 1993). The highest percentage of genes under positive selection was found for OGs located (at least in one strain) on pSymB chromid (11.4% of the OGs mapped on this replicon, 150 OGs), whereas 5.8% of the OGs mapped on the pSymA megaplasmid showed signs of positive selection (40 OGs), and only 4.7% of the OGs mapped to the chromosome (153 OGs) showed signs of positive selection (fig. 3a); some of the positively selected OGs have been mapped to more than one replicon, due to the presence of 10 draft genome in the data set (supplementary table S5, Supplementary Material online). This high fraction of positively selected genes may match part of the phenotypic variability observed in natural populations (Biondi et al. 2009). Notably, within the positively selected genes on pSymB chromid, we detected genes coding for putative short chain oxidoreductases, which may have roles in hydroxybutyate accumulation (Jacob et al. 2008), or involved in osmotolerance, as eutA (Jebbar et al. 2005), or in rhizopine uptake, as mocBD (Rossbach et al. 1994); interestingly, the mocD gene was found to exhibit also signs of purifying selection. Interestingly, on pSymA, we found positively selected genes involved in Nod Factor biosynthesis and host plant preference, such as nodCHLP (Roche et al. 1996), and the gene encoding for NoeB host-specific nodulation protein, the FixB electron transfer flavoprotein alpha chain, involved in nitrogen fixation and rpoE6/rpoE (RNA polymerase ECF sigma factor). For the chromosome, genes such as ntrB (nitrogen regulation protein), xylA (xylose isomerase), flgF (flagellar basal-body rod protein), and ureE (urease accessory protein) were found as positively selected, which may have a role in the adaptation to stress conditions (Bastiat et al. 2010). We computed for each COG category, the ratio between selected and not selected OGs (fig. 3b) to evaluate if several COG categories were more represented in the positively selected genes with respect to nonselected genes. Nine COG categories showed enrichment in positive selection: Interestingly, within these 10 COGs, five COG, namely K (Transcription), M (Cell envelope biogenesis, outer membrane), N (Cell motility and secretion), G (Carbohydrate transport and metabolism), and I (Lipid metabolism), showed the highest proportional differences (>15%). On the opposite, one COG containing mainly housekeeping functions (J, Translation, ribosomal structure, and biogenesis) showed the lowest proportional differences (<−75%) with the nonselected genes. It should be mentioned that indeed the pSymB chromid is particularly rich in carbohydrate transporters (Finan et al. 2001) and was supposed to play important roles in the survival of the bacterium under highly variable nutritional conditions encountered in the soil and rhizosphere. Under this view, it is expected that a higher number of positively selected genes are resident on this replicon, suggesting that the pSymB chromid is a hot spot for adaptation in free living (nonhost) highly diverse conditions, which indeed challenge bacterium’s fitness. Up to now, most of genome-wide searches for positively selected genes have been performed on pathogenic species (Lefebure and Stanhope 2007; Petersen et al. 2007; Soyer et al. 2009). These studies showed that surface proteins encoding genes are among the most relevant categories of positively selected genes, suggesting a strong role of host immune system in strain diversification. By paralleling these data, we could suppose that the evolutionary role played by host immune system variability for pathogenic bacteria is played by environmental carbohydrate scavenging by soil and rhizosphere bacteria. However, statistical evidences of positive selection should be considered with caution, because different methods may yield very different results. In a recent article on a panel of S. meliloti and S. medicae strains (Epstein et al. 2012), the use of a different metrics (DTH test [Zeng et al. 2006]) indicated that also some nonessential symbiotic functions may be under positive selection, though curiously no overlap of positively selected orthologs was found for the two species.
Fig. 3.—
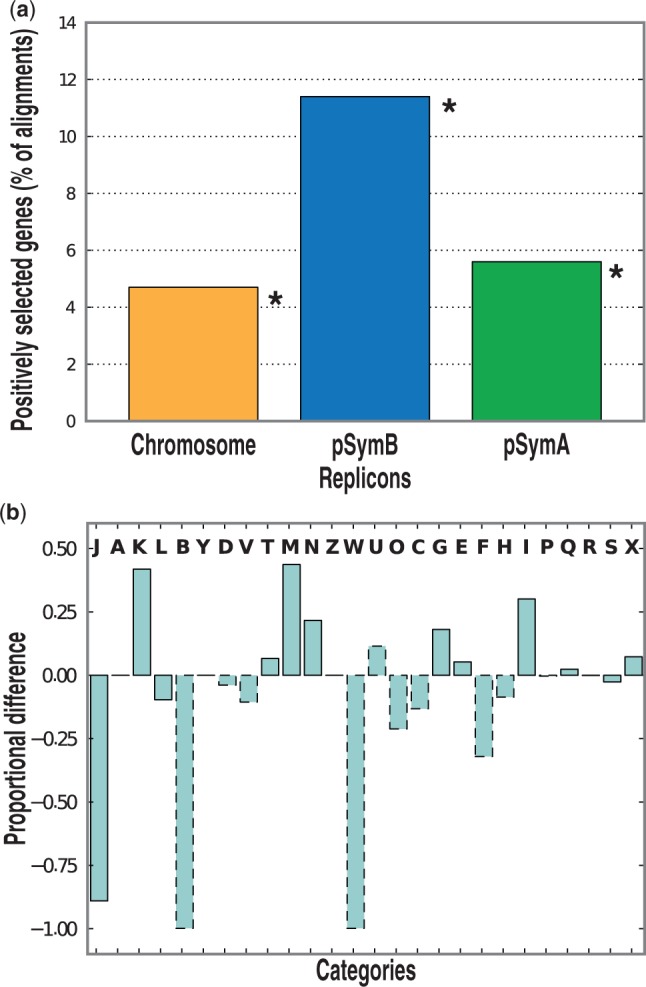
Detection of positively selected sites in the three main S. meliloti replicons. (a) The proportion of positively selected sites detected with respect to the total number of genes present in each replicon is reported. Asterisks indicate significant enrichment (P < 0.05 with a Fisher’s exact test) of positively selected genes. (b) Difference between relative proportions of each COG category between selected and nonselected core genes. Solid borders indicate a significant difference (P < 0.05 with a Fisher’s exact test). See http://www.ncbi.nlm.nih.gov/COG/grace/fiew.cgi for the list of COG codes.
Taxonomic Distribution: Uneven Pattern of Core Genes among Replicons
To infer the phylogenetic origin of dispensable genome and its potential differences with respect to the phylogenetic relationships of the core genome, a homology analysis on taxonomic partitions of the nr database (Pini et al. 2011) was carried out to define the bacterial (and proteobacterial) phylogenetic groups to which each replicon shows the highest similarity (fig. 4). When analyzing the orthologs with respect to their position on the three main replicons (chromosome, pSymB chromid, and pSymA megaplasmid, fig. 4a), several bacterial classes, notably Betaproteobacteria and Gammaproteobacteria had the highest number of matches for orthologs harbored by pSymB chromid, whereas orthologs located on the chromosome and on pSymA megaplasmid had a (similar) lower proportion. This evidence suggests that chromids could have originated from (very ancient) gene transfer events from distant relatives, then contributing in the emergence of new taxa (e.g., genera) (Harrison et al. 2010). Finally, to provide functional insights over the orthologs that S. meliloti shares with proteobacterial and nonproteobacterial taxa, the differences between hits on nonproteobacterial and proteobacterial taxa were computed for each COG category. Results of the analysis are shown in figure 4b. Interestingly, positive values of proportional differences were obtained for several COGs involved in housekeeping functions (as J, L, D, M, O, C, F, H, and I), indicating that orthologs for these functions are significantly shared also with nonproteobacterial taxa, suggesting that these functions may be evolutionary conserved inside the kingdom Bacteria. Conversely, COGs coding for “accessory” functions, such as defense mechanisms (V), carbohydrate and amino acid metabolism (G and E), and secondary metabolites (P), are more represented in hits on proteobacterial taxa than in nonproteobacterial taxa. These data indicate that “accessory” functions are more taxonomically related than housekeeping functions. However, biases due to different evolutionary rates among COGs (possibly higher in certain “accessory” functions, such as defense mechanisms, with respect to housekeeping functions) may mask ancient sharing with nonproteobacterial taxa.
Fig. 4.—

Taxonomic distribution of the S. meliloti pangenome. (a) Taxonomic distribution of the OGs mapped to each replicon: For each taxonomic group, the proportion of the orthologs for each replicon having a significant hit is reported. (b) Difference between relative proportions of each COG category between proteobacterial hits and nonproteobacterial hits. Solid histograms mark categories with significant differences (P < 0.05 with a Fisher’s exact test).
The Unique Gene Fraction Is Arranged in Clusters
To infer potential structural features, such as uneven or even distribution along the replicons of the dispensable genome in the 14 strains, the 10 draft genomes were assembled using CONTIGuator (Galardini, Biondi, et al. 2011), and the resulted reconstructed putative replicons were aligned (see Materials and Methods) to the complete genomes of S. meliloti AK83, BL225C, Rm1021, and SM11 strains (fig. 5a). Interestingly, the dendrogram of genetic relationships between strains was well mirrored by structural features of the same strains. It is worth notice that, in fact, the three main clusters present in the dendrogram, containing Rm1021, SM11, and AK83, respectively, correspond to the presence of large inversions: Specifically, an inversion on the chromosome was observed between strain 1A42 and SM11 and between strain C0438LL and AK83, as well as two large inversions on megaplasmid pSymA between strain C0438LL and AK83 and between strain AK75 and BL225C. Both inversions observed on megaplasmid pSymA have been found to be enriched in genes with signs of positive selection, when compared with the rest of the replicon (P ≤ 0.05), whereas the inversion on megaplasmid pSymA between strain C0438LL and AK83 was found to contain a significant lower proportion of genes with signs of purifying selection (P ≤ 0.05). Another interesting feature is the evidence that the dispensable genome, and especially unique genes fractions, is mainly distributed in clusters (blue and green zones, respectively). In particular, pSymA megaplasmid contained, as expected, a higher proportion of accessory and unique contiguous blocks, whereas pSymB chromid and the chromosome contained a higher proportion of core contiguous blocks, in agreement with earlier reports (Giuntini et al. 2005; Galardini et al. 2011). Particularly interesting is also the abundance of unique gene clusters in pSymA megaplasmid (∼10% of the total, against the 5% proportion of the chromosome and the pSymB chromid), compared with the other large replicons (fig. 5b); in the two smaller plasmids, a significant higher fraction of dispensable contiguous block is present, as expected in such small accessory plasmids.
Fig. 5.—

Structural alignments of the 14 Sinorhizobium meliloti genomes. (a) Alignment between genomes is reported, following the order of the overall Bayesian dendrogram (fig. 2), the presence of core, and accessory and unique contiguous regions of orthologs whose length is over 10 kb is reported. Whole replicon inversions (as in the chromid pSymB and megaplasmid pSymA between strain 1A42 and SM11) and translocations spanning over the starting point of a replicon (as in the chromid pSymB between strain AK75 and BL225C) are artifacts dependent on the specific orientation and starting point of the nucleotide sequences. (b) Proportion of contiguous regions for each pangenomic category in each replicon.
The arrangement of the unique gene fraction in blocks on S. meliloti genomes is particularly relevant, because unique genes are used as models for inferring de novo gene evolution. Unique gene evolution models hypothesize that transcriptional and translational events in noncoding regions or sporadic phage integrations are fixed and, after passing the natural selection filter, lead to the emergence of unique (novel) genes (Yomtovian et al. 2010; Carvunis et al. 2012). In this perspective, the slightly higher abundance of unique and dispensable genes found on pSymA megaplasmid makes sense with either a higher proportion of mobile genetic elements (Biondi et al. 2011) or with the lower percentage of protein-coding DNA (and consequently higher intergenic regions length) in pSymA megaplasmid, with respect to the chromosome and to pSymB chromid (Galibert et al. 2001).
The DNA Proximity Network Reveals a Structural Evolution through Rearrangements on a Shared Backbone
To understand how the genomic structure evolves, a deeper structural analysis was then performed through the exploitation of the DNA proximity network; the network has been constructed, so that each node represents a nucleotide region present in one or more genomes, whereas the edges represent the proximity of each region to the others on one or more genomes, the weight of the edge being proportional to the number of times each link is observed in the whole pangenome (fig. 6a). A total number of 24,518 nodes with an average size of 894 bp and 36,781 edges were added to the network. Each node was assigned to its replicon of origin, “Shuffled” if the node was mapped to more than one replicon in the pangenome or “UnMapped” if the node was not assigned to any replicon. A simpler block-model network was then constructed using the replicon information, the nodes size proportional to the bases mapped and the edges proportional to the number of links between each replicon (fig. 6b). As expected, the largest node is that representing the chromosome, with 6.58 Mb mapped in the whole pangenome, followed by the shuffled and unmapped nodes (4.34 and 4.38 Mb, respectively). Interestingly, the pSymA megaplasmid showed a higher number of bases than the pSymB chromid (3.19 and 2.83 Mb, respectively), a feature that can be explained by the higher number of accessory regions mapping to this replicon, which in fact leads to a pSymA megaplasmid that is larger than the pSymB chromid in pangenomic terms.
Fig. 6.—

Proximity network construction and statistics. (a) Explanatory proximity network construction details. (b) Block model simplified version of the proximity network, obtained dividing the nodes according to their replicon of origin; nodes and edges sizes are proportional to the number of orthologs and number of links observed, respectively.
A series of network statistics were computed for the overall network (“All”), the nucleotidic regions univocally mapped to one replicon (“Mapped”), the shuffled regions (“Shuffled”), and the single replicons (table 2). The overall network had the highest average node degree (∼3), meaning that each node is connected to three other nodes on average, resulting in a relatively nonconserved structure in the whole pangenome. When considering the replicon assortativity (a measure of how much each node tends to be closer to a node coming from the same replicon), the highest value is found for the “Mapped” component (1), meaning that when the shuffled nodes are removed from the proximity network, the single replicons have no links connecting each other, thus suggesting indeed the presence of a conserved core structure for each replicon. This finding was further confirmed looking at the size of the major connected component (i.e., the largest subgraph in which each node can be reached from any other node): Only approximately 21% of the “Mapped” component was linked in a single cluster. When considering the larger replicons, the chromosome was found to have the larger fraction of its content present in a single cluster (∼43%), whereas lower values for the other two replicons, meaning that the chromosome structure is evolutionary more conserved, with nearly half of its nucleotidic content with a conserved structure. As expected, the opposite trend was observed when looking at the fraction of genes of each cluster that were present in the “boundary” to the shuffled component, having an edge to a node in the shuffled component, ranging from approximately 27% (chromosome) to 100% (pSINME02), with the pSymA megaplasmid having the highest proportion of nodes in boundary among the larger replicons (∼44%), meaning that the pSymA megaplasmid experienced a higher number of rearrangements than the other replicons. This observation is confirmed when looking at the number of putative transposases encoded in each replicon (supplementary table S6, Supplementary Material online), with the pSymA megaplasmid harboring almost three times the transposases found in the chromosome and in the pSymB chromid, a feature that could explain the higher structural fluidity of this replicon.
Table 2.
DNA Proximity Network Statistics
| DNA Proximity Network Cluster |
||||||||||
|---|---|---|---|---|---|---|---|---|---|---|
| All | Mapped | Shuffled | Chromosome | pSymB | pSymA | pSINME01 | pSmeSM11b | pSINME02 | pSmeSM11a | |
| Average degreea | 3.00 | 2.91 | 2.63 | 2.98 | 2.88 | 2.77 | 2.43 | 2.79 | NA | 2.42 |
| Std-dev degreea | 1.00 | 0.97 | 0.81 | 1.00 | 0.97 | 0.89 | 0.73 | 0.89 | 0.00 | 0.72 |
| Replicon assortativity | 0.67 | 1.00 | NA | NA | NA | NA | NA | NA | NA | NA |
| Major component weighted size | 1.00 | 0.21 | 0.19 | 0.43 | 0.17 | 0.29 | 0.13 | 0.56 | 0.04 | 0.13 |
| Boundary weighted sizeb | NA | 0.34 | NA | 0.27 | 0.34 | 0.44 | 0.94 | 0.68 | 1.00 | 0.70 |
Note.—Std-dev, standard deviation; NA, not applicable.
aConsidering nodes with degree > 1.
bNodes having at least a link to the shuffled cluster.
To inspect if there was a conserved structural backbone in the pangenome, the overall network was divided using a filter on the links weight, which are proportional to the number of times two nucleotide regions are seen as adjacent in the whole pangenome (fig. 6a), leading to the definition of “DNA backbones” having link weight between 10 and 14, which are the largest conserved genomic structures in the S. meliloti pangenome; both the overall backbones and the replicon-specific backbones were computed (table 3). For all the three categories used, only linear backbones were found (degree = 2), with a similar average length of approximately 5,000 bp, meaning that the underlying mechanisms of formation and evolution of these backbones may be similar in the three replicons. On the other hand, the proportion of replicons conserved in a backbone varies between each replicon: Approximately half of the chromosome is conserved and contained in a single backbone, one-third of the pSymB chromid is conserved, whereas just 18% of the pSymA megaplasmid is conserved; thus, even though the mechanisms of structural evolution are similar in each replicon, the extent of the structural variability is different.
Table 3.
DNA Backbones Statistics
| All | Chromosome | pSymB | pSymA | |
|---|---|---|---|---|
| Number of chains | 1,035 | 349 | 118 | 60 |
| Total length (Mb) | 2.68 | 2.03 | 0.51 | 0.27 |
| Length proportiona | Nd | 0.54 | 0.31 | 0.18 |
| Average length (bp) | 5,391.9 | 5,819.7 | 4,342.4 | 4,502.2 |
| Standard size (bp) | 6,561.6 | 6,281.8 | 6,257.8 | 5,522.5 |
Note.—Nd, not determined.
aReplicon size is the average replicon length in the four complete Sinorhizobium meliloti genomes.
An Evolutionary Scenario for Multipartite Bacterial Genomes
Bacterial genomes are classically described by the “E. coli rules,” in which the genome is composed by one chromosome, plus additional plasmids that often carry nonessential functions (Krawiec and Riley 1990). However, this approximation fails to describe several bacterial species, for which large additional replicons are present as secondary chromosomes, megaplasmids, etc. Recently, the term “chromid” has been proposed (Harrison et al. 2010) to describe large replicons that contain not only plasmid-type replication systems but also essential genes for growth and survival.
Here, the analysis of 14 S. meliloti multipartite genomes allowed us to suggest that each replicon may behave as a partially independent evolutionary unit, implying that the multireplicon structure in some bacterial species may be functional to the physical separation of different functions, at least as a general tendency on a limited amount of genes, and with the action of different evolutionary forces in each replicon. This is the case of S. meliloti that exploits multiple ecological niches (soil, rhizosphere, root nodule, plant endosphere, etc. [Pini et al. 2012]). In particular, the pSymB chromid behaves as an independent evolutionary unit, and our data suggest that the biological and evolutionary meaning of chromids is larger than previously hypothesized, playing a considerable role at the intraspecific level (at least in this taxon), in addition to genera differentiation (Harrison et al. 2010). Indeed, chromids could also have a role in species differentiation as genomic elements for adaptation through individual genes evolution, whereas the plasmids and megaplasmids are more prone to structural evolution (e.g., via horizontal gene transfer). However, because of the species concept in bacteria (see e.g., Doolittle and Papke 2006), the analysis of other taxa is needed to more precisely define the involvement of chromids in strains differentiation in relationship with different taxonomic levels (e.g., species and genus).
The overall evolutionary scenario of the three main S. meliloti replicons could be approximated as in figure 7. The chromosome contains most of the housekeeping functions and originated mainly by vertical descent from S. meliloti phylogenetic relatives. The pSymB chromid indeed is mainly vertically transmitted in the genus Sinorhizobium (Harrison et al. 2010; Bailly et al. 2011), but it also acquired genes from distant relatives by primordial horizontal gene transfer events. Functions of pSymB are mainly related to environmental adaptation, and evolution takes place through positive selection of genes involved in local adaptation. Finally, the pSymA megaplasmid, as alien element (its GC content is significantly different from those of chromosome and of pSymB chromid [Galibert et al. 2001]) is the replicon devoted to the introduction of genomic novelties, such as new genes come by horizontal gene transfer. It is worth to remember that the most relevant bioprocess of rhizobia (symbiotic nitrogen fixation) is indeed linked to this last replicon and that functional diversification via purifying selection seems to act also on a number of symbiotic-related genes; moreover, unlike the other replicons, both core and accessory fractions of pSymA megaplasmid show a similar pattern, indicating similar evolutionary routes for the conserved and variable fractions in this replicon. Interestingly, at the structural level, the network analysis highlighted the presence of stable core structures in each replicons, the chromosome having the largest conserved network, followed by the pSymB chromid and finally by the pSymA megaplasmid, which was confirmed as a hot spot for structural rearrangements.
Fig. 7.—
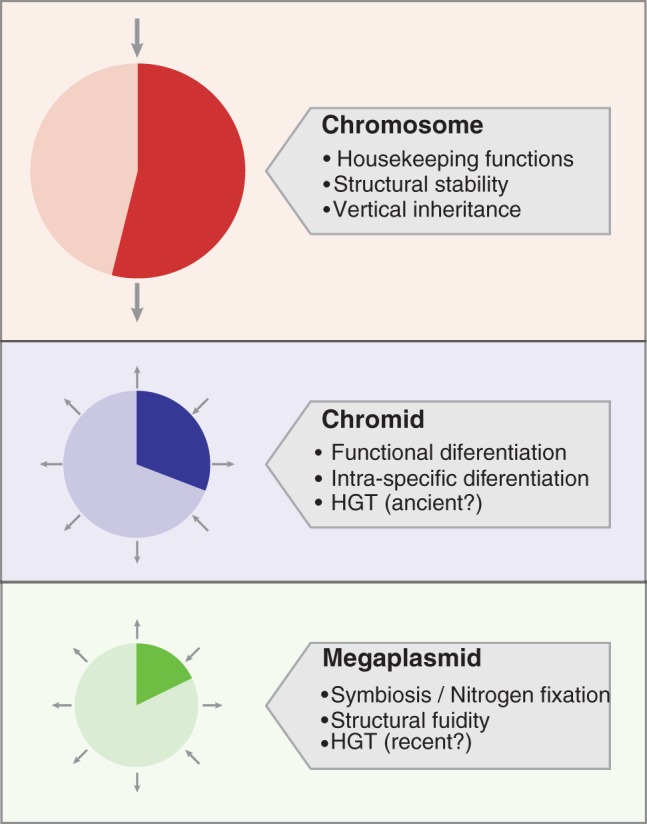
Tasks and evolutionary differences of replicons in S. meliloti. Pie charts indicate the proportion of each replicon that is present in the DNA backbones. The arrows indicate the transmission mechanism: vertical inheritance (two arrows) or HGT (radial arrows).
In conclusion, our study demonstrates that the evolution of the S. meliloti pangenome shows two opposite behaviors: a strongly conserved genome, with a significant fraction of genes evolving by positive selection, and a highly variable fraction that most likely contributes to structural fluidity and the emerging of new functions. The conserved genome signature is replicon specific, whereas for the variable part, the signature is more strain specific. It is not clear yet if this model is applicable to other multipartite bacterial genomes, which contains both chromids and plasmids and may have different ecological features (e.g., Brucella, Variovorax, and Vibrio; for a list of genera see Harrison et al. 2010). However, future population genomics analyses on other species with these features will help elucidating the evolutionary role of multipartite genomes in bacteria.
Supplementary Material
Supplementary figures S1–S3 and tables S1–S6 are available at Genome Biology and Evolution online (http://www.gbe.oxfordjournals.org).
Acknowledgments
The authors are grateful to Dr M. Roumiantseva and Dr B. Simarov for providing S. meliloti strains of AK series under the activities of PLADADINFIS EU Project. This work was partially supported by intramural funding of the University of Florence to A.M. and M.B. and by Italian Ministry of Research (PRIN 2008 research grant contract No. TCKNJL, “Il pangenoma di Sinorhizobium meliloti: L'uso della genomica per il miglioramento agronomico dell'erba medica”) to M.B. They are grateful to two anonymous referees for helping improving the manuscript.
Literature Cited
- Alexeyenko A, Tamas I, Liu G, Sonnhammer ELL. Automatic clustering of orthologs and inparalogs shared by multiple proteomes. Bioinformatics. 2006;22:e9–e15. doi: 10.1093/bioinformatics/btl213. [DOI] [PubMed] [Google Scholar]
- Altenhoff AM, Dessimoz C. Phylogenetic and functional assessment of orthologs inference projects and methods. PLoS Comput Biol. 2009;5:e1000262. doi: 10.1371/journal.pcbi.1000262. [DOI] [PMC free article] [PubMed] [Google Scholar]
- Bailly X, Olivieri I, De Mita S, Cleyet-Marel JC, Bena G. Recombination and selection shape the molecular diversity pattern of nitrogen-fixing Sinorhizobium sp. associated to Medicago. Mol Ecol. 2006;15:2719–2734. doi: 10.1111/j.1365-294X.2006.02969.x. [DOI] [PubMed] [Google Scholar]
- Bailly X, et al. Population genomics of Sinorhizobium medicae based on low-coverage sequencing of sympatric isolates. ISME J. 2011;5:1722–1734. doi: 10.1038/ismej.2011.55. [DOI] [PMC free article] [PubMed] [Google Scholar]
- Bastiat BND, Sauviac L, Bruand C. Dual control of Sinorhizobium meliloti RpoE2 sigma factor activity by Two PhyR-type two-component response regulators. J Bacteriol. 2010;192:2255–2265. doi: 10.1128/JB.01666-09. [DOI] [PMC free article] [PubMed] [Google Scholar]
- Bennett S. Solexa Ltd. Pharmacogenomics. 2004;5:433–438. doi: 10.1517/14622416.5.4.433. [DOI] [PubMed] [Google Scholar]
- Beringer JE. R factor transfer in Rhizobium leguminosarum. J Gen Microbiol. 1974;84:188–198. doi: 10.1099/00221287-84-1-188. [DOI] [PubMed] [Google Scholar]
- Biondi EG, Toro NS, Bazzicalupo M, Martinez-Abarca F. Spread of the group II intron RmInt1 and its insertion sequence target sites in the plant endosymbiont Sinorhizobium meliloti. Mob Genet Elements. 2011;1:2–7. doi: 10.4161/mge.1.1.15316. [DOI] [PMC free article] [PubMed] [Google Scholar]
- Biondi EG, et al. Metabolic capacity of Sinorhizobium (Ensifer) meliloti strains as determined by phenotype microarray analysis. Appl Environ Microbiol. 2009;75:5396–5404. doi: 10.1128/AEM.00196-09. [DOI] [PMC free article] [PubMed] [Google Scholar]
- Biswas S, Akey JM. Genomic insights into positive selection. Trends Genet. 2006;22:437–446. doi: 10.1016/j.tig.2006.06.005. [DOI] [PubMed] [Google Scholar]
- Bonnet E, Van de Peer Y. zt: a software tool for simple and partial Mantel tests. J Stat Software. 2002;7:1–12. [Google Scholar]
- Boto L. Horizontal gene transfer in evolution: facts and challenges. Proc Biol Sci. 2010;277:819–827. doi: 10.1098/rspb.2009.1679. [DOI] [PMC free article] [PubMed] [Google Scholar]
- Boussau B, Gueguen L, Gouy M. A mixture model and a hidden Markov model to simultaneously detect recombination breakpoints and reconstruct phylogenies. Evol Bioinform Online. 2009;5:67–79. doi: 10.4137/ebo.s2242. [DOI] [PMC free article] [PubMed] [Google Scholar]
- Brosch R, Pym AS, Gordon SV, Cole ST. The evolution of mycobacterial pathogenicity: clues from comparative genomics. Trends Microbiol. 2001;9:452–458. doi: 10.1016/s0966-842x(01)02131-x. [DOI] [PubMed] [Google Scholar]
- Camacho C, et al. BLAST+: architecture and applications. BMC Bioinformatics. 2009;10:421. doi: 10.1186/1471-2105-10-421. [DOI] [PMC free article] [PubMed] [Google Scholar]
- Carelli M, et al. Genetic diversity and dynamics of Sinorhizobium meliloti populations nodulating different alfalfa varieties in Italian soils. Appl Environ Microbiol. 2000;66:4785–4789. doi: 10.1128/aem.66.11.4785-4789.2000. [DOI] [PMC free article] [PubMed] [Google Scholar]
- Carvunis A-R, et al. Proto-genes and de novo gene birth. Nature. 2012;487:370–374. doi: 10.1038/nature11184. [DOI] [PMC free article] [PubMed] [Google Scholar]
- Chi F, et al. Ascending migration of endophytic rhizobia, from roots to leaves, inside rice plants and assessment of benefits to rice growth physiology. Appl Environ Microbiol. 2005;71:7271–7278. doi: 10.1128/AEM.71.11.7271-7278.2005. [DOI] [PMC free article] [PubMed] [Google Scholar]
- Cho YJ, Yi H, Lee JH, Kim DW, Chun J. Genomic evolution of Vibrio cholerae. Curr Opin Microbiol. 2010;13:646–651. doi: 10.1016/j.mib.2010.08.007. [DOI] [PubMed] [Google Scholar]
- Cock PJ, et al. Biopython: freely available Python tools for computational molecular biology and bioinformatics. Bioinformatics. 2009;25:1422–1423. doi: 10.1093/bioinformatics/btp163. [DOI] [PMC free article] [PubMed] [Google Scholar]
- Conesa A, et al. Blast2GO: a universal tool for annotation, visualization and analysis in functional genomics research. Bioinformatics. 2005;21:3674–3676. doi: 10.1093/bioinformatics/bti610. [DOI] [PubMed] [Google Scholar]
- Darling AC, Mau B, Blattner FR, Perna NT. Mauve: multiple alignment of conserved genomic sequence with rearrangements. Genome Res. 2004;14:1394–1403. doi: 10.1101/gr.2289704. [DOI] [PMC free article] [PubMed] [Google Scholar]
- de la Bastide M, McCombie WR. Assembling genomic DNA sequences with PHRAP. Curr Protoc Bioinformatics. 2007 doi: 10.1002/0471250953.bi1104s17. Chapter 11:Unit11 14. [DOI] [PubMed] [Google Scholar]
- Deng X, Phillippy AM, Li Z, Salzberg SL, Zhang W. Probing the pan-genome of Listeria monocytogenes: new insights into intraspecific niche expansion and genomic diversification. BMC Genomics. 2010;11:500. doi: 10.1186/1471-2164-11-500. [DOI] [PMC free article] [PubMed] [Google Scholar]
- Deng W, et al. Comparative genomics of Salmonella enterica serovar Typhi strains Ty2 and CT18. J Bacteriol. 2003;185:2330–2337. doi: 10.1128/JB.185.7.2330-2337.2003. [DOI] [PMC free article] [PubMed] [Google Scholar]
- de Vienne DM, Ollier S, Aguileta G. Phylo-MCOA: a fast and efficient method to detect outlier genes and species in phylogenomics using multiple co-inertia analysis. Mol Biol Evol. 2012;29:1587–1598. doi: 10.1093/molbev/msr317. [DOI] [PubMed] [Google Scholar]
- Doolittle WF, Papke RT. Genomics and the bacterial species problem. Genome Biol. 2006;7:116. doi: 10.1186/gb-2006-7-9-116. [DOI] [PMC free article] [PubMed] [Google Scholar]
- Edgar RC. MUSCLE: a multiple sequence alignment method with reduced time and space complexity. BMC Bioinformatics. 2004;5:113. doi: 10.1186/1471-2105-5-113. [DOI] [PMC free article] [PubMed] [Google Scholar]
- Edwards RA, Olsen GJ, Maloy SR. Comparative genomics of closely related salmonellae. Trends Microbiol. 2002;10:94–99. doi: 10.1016/s0966-842x(01)02293-4. [DOI] [PubMed] [Google Scholar]
- Epstein B, et al. Population genomics of the facultatively mutualistic bacteria Sinorhizobium meliloti and S. medicae. PLoS Genet. 2012;8:e1002868. doi: 10.1371/journal.pgen.1002868. [DOI] [PMC free article] [PubMed] [Google Scholar]
- Finan TM, et al. The complete sequence of the 1,683-kb pSymB megaplasmid from the N2-fixing endosymbiont Sinorhizobium meliloti. Proc Natl Acad Sci U S A. 2001;98:9889–9894. doi: 10.1073/pnas.161294698. [DOI] [PMC free article] [PubMed] [Google Scholar]
- Frandi A, Mengoni A, Brilli M. Comparative genomics of VirR regulons in Clostridium perfringens strains. BMC Microbiol. 2010;10:65. doi: 10.1186/1471-2180-10-65. [DOI] [PMC free article] [PubMed] [Google Scholar]
- Galardini M, Biondi E, Bazzicalupo M, Mengoni A. CONTIGuator: a bacterial genomes finishing tool for structural insights on draft genomes. Source Code Biol Med. 2011;6:11. doi: 10.1186/1751-0473-6-11. [DOI] [PMC free article] [PubMed] [Google Scholar]
- Galardini M, et al. Exploring the symbiotic pangenome of the nitrogen-fixing bacterium Sinorhizobium meliloti. BMC Genomics. 2011;12:253. doi: 10.1186/1471-2164-12-235. [DOI] [PMC free article] [PubMed] [Google Scholar]
- Galibert F, et al. The composite genome of the legume symbiont Sinorhizobium meliloti. Science. 2001;293:668–672. doi: 10.1126/science.1060966. [DOI] [PubMed] [Google Scholar]
- Gibson KE, Kobayashi H, Walker GC. Molecular determinants of a symbiotic chronic infection. Annu Rev Genet. 2008;42:413–441. doi: 10.1146/annurev.genet.42.110807.091427. [DOI] [PMC free article] [PubMed] [Google Scholar]
- Giuntini E, et al. Large-scale genetic variation of the symbiosis-required megaplasmid pSymA revealed by comparative genomic analysis of Sinorhizobium meliloti natural strains. BMC Genomics. 2005;6:158. doi: 10.1186/1471-2164-6-158. [DOI] [PMC free article] [PubMed] [Google Scholar]
- Glazebrook J, Ichige A, Walker GC. A Rhizobium meliloti homolog of the Escherichia coli peptide-antibiotic transport protein SbmA is essential for bacteroid development. Genes Dev. 1993;7:1485–1497. doi: 10.1101/gad.7.8.1485. [DOI] [PubMed] [Google Scholar]
- Gogarten JP, Townsend JP. Horizontal gene transfer, genome innovation and evolution. Nat Rev Microbiol. 2005;3:679–687. doi: 10.1038/nrmicro1204. [DOI] [PubMed] [Google Scholar]
- Guo H, Sun S, Eardly B, Finan T, Xu JP. Genome variation in the symbiotic nitrogen-fixing bacterium Sinorhizobium meliloti. Genome. 2009;52:862–875. doi: 10.1139/g09-060. [DOI] [PubMed] [Google Scholar]
- Hammer Ø, Harper DAT, Ryan PD. PAST: Paleontological Statistics Software Package for education and data analysis. Palaeontol Electron. 2001;41:9. [Google Scholar]
- Harrison PW, Lower RPJ, Kim NKD, Young JPW. Introducing the bacterial “chromid”: not a chromosome, not a plasmid. Trends Microbiol. 2010;18:141–148. doi: 10.1016/j.tim.2009.12.010. [DOI] [PubMed] [Google Scholar]
- Huelsenbeck JP, Ronquist F. MRBAYES: Bayesian inference of phylogenetic trees. Bioinformatics. 2001;17:754–755. doi: 10.1093/bioinformatics/17.8.754. [DOI] [PubMed] [Google Scholar]
- Hyatt D, et al. Prodigal: prokaryotic gene recognition and translation initiation site identification. BMC Bioinformatics. 2010;11:119. doi: 10.1186/1471-2105-11-119. [DOI] [PMC free article] [PubMed] [Google Scholar]
- Jacob AI, et al. Mutational analysis of the Sinorhizobium meliloti short-chain dehydrogenase/reductase family reveals substantial contribution to symbiosis and catabolic diversity. Mol Plant Microbe Interact. 2008;21:979–987. doi: 10.1094/MPMI-21-7-0979. [DOI] [PubMed] [Google Scholar]
- Jebara M, Mhamdi R, Aouani ME, Ghrir R, Mars M. Genetic diversity of Sinorhizobium populations recovered from different Medicago varieties cultivated in Tunisian soils. Can J Microbiol. 2001;47:139–147. doi: 10.1139/w00-135. [DOI] [PubMed] [Google Scholar]
- Jebbar M, Sohn-Bösser L, Bremer E, Bernard TO, Blanco C. Ectoine-induced proteins in Sinorhizobium meliloti include an ectoine ABC-type transporter involved in osmoprotection and ectoine catabolism. J Bacteriol. 2005;187:1293–1304. doi: 10.1128/JB.187.4.1293-1304.2005. [DOI] [PMC free article] [PubMed] [Google Scholar]
- Kislyuk A, Haegeman B, Bergman N, Weitz J. Genomic fluidity: an integrative view of gene diversity within microbial populations. BMC Genomics. 2011;12:32. doi: 10.1186/1471-2164-12-32. [DOI] [PMC free article] [PubMed] [Google Scholar]
- Koonin EV. Darwinian evolution in the light of genomics. Nucleic Acids Res. 2009;37:1011–1034. doi: 10.1093/nar/gkp089. [DOI] [PMC free article] [PubMed] [Google Scholar]
- Koonin EV. Are there laws of genome evolution? PLoS Comput Biol. 2011;7:e1002173. doi: 10.1371/journal.pcbi.1002173. [DOI] [PMC free article] [PubMed] [Google Scholar]
- Koonin EV, Wolf YI. Constraints and plasticity in genome and molecular-phenome evolution. Nat Rev Genet. 2010;11:487–498. doi: 10.1038/nrg2810. [DOI] [PMC free article] [PubMed] [Google Scholar]
- Krawiec S, Riley M. Organization of the bacterial chromosome. Microbiol Rev. 1990;54:502–539. doi: 10.1128/mr.54.4.502-539.1990. [DOI] [PMC free article] [PubMed] [Google Scholar]
- Kuo C-H, Moran NA, Ochman H. The consequences of genetic drift for bacterial genome complexity. Genome Res. 2009;19:1450–1454. doi: 10.1101/gr.091785.109. [DOI] [PMC free article] [PubMed] [Google Scholar]
- Lagesen K, et al. RNAmmer: consistent and rapid annotation of ribosomal RNA genes. Nucleic Acids Res. 2007;35:3100–3108. doi: 10.1093/nar/gkm160. [DOI] [PMC free article] [PubMed] [Google Scholar]
- Lefebure T, Stanhope MJ. Evolution of the core and pan-genome of Streptococcus: positive selection, recombination, and genome composition. Genome Biol. 2007;8:R71. doi: 10.1186/gb-2007-8-5-r71. [DOI] [PMC free article] [PubMed] [Google Scholar]
- Lowe TM, Eddy SR. TRNAscan-SE: a program for improved detection of transfer RNA genes in genomic sequence. Nucleic Acids Res. 1999;25:955–964. doi: 10.1093/nar/25.5.955. [DOI] [PMC free article] [PubMed] [Google Scholar]
- Lukjancenko O, Wassenaar TM, Ussery DW. Comparison of 61 sequenced Escherichia coli genomes. Microb Ecol. 2010;60:708–720. doi: 10.1007/s00248-010-9717-3. [DOI] [PMC free article] [PubMed] [Google Scholar]
- Massingham T, Goldman N. Detecting amino acid sites under positive selection and purifying selection. Genetics. 2005;169:1753–1762. doi: 10.1534/genetics.104.032144. [DOI] [PMC free article] [PubMed] [Google Scholar]
- Mathieu B, Sebastien H, Mathieu J. International AAAI Conference on Weblogs and Social Media. 2009. Gephi: an open source software for exploring and manipulating networks. [Google Scholar]
- Meade HM, Long SR, Ruvkun GB, Brown SE, Ausubel FM. Physical and genetic characterization of symbiotic and auxotrophic mutants of Rhizobium meliloti induced by transposon Tn5 mutagenesis. J Bacteriol. 1982;149:114–122. doi: 10.1128/jb.149.1.114-122.1982. [DOI] [PMC free article] [PubMed] [Google Scholar]
- Medini D, et al. Microbiology in the post-genomic era. Nat Rev Microbiol. 2008;6:419–430. doi: 10.1038/nrmicro1901. [DOI] [PubMed] [Google Scholar]
- Milne I, et al. Tablet—next generation sequence assembly visualization. Bioinformatics. 2010;26:401–402. doi: 10.1093/bioinformatics/btp666. [DOI] [PMC free article] [PubMed] [Google Scholar]
- Mols M, de Been M, Zwietering MH, Moezelaar R, Abee T. Metabolic capacity of Bacillus cereus strains ATCC 14579 and ATCC 10987 interlinked with comparative genomics. Environ Microbiol. 2007;9:2933–2944. doi: 10.1111/j.1462-2920.2007.01404.x. [DOI] [PubMed] [Google Scholar]
- Moriya Y, Itoh M, Okuda S, Yoshizawa AC, Kanehisa M. KAAS: an automatic genome annotation and pathway reconstruction server. Nucleic Acids Res. 2007;35:W182–W185. doi: 10.1093/nar/gkm321. [DOI] [PMC free article] [PubMed] [Google Scholar]
- O'Brien KP, Remm M, Sonnhammer ELL. Inparanoid: a comprehensive database of eukaryotic orthologs. Nucleic Acids Res. 2005;33:D476–D480. doi: 10.1093/nar/gki107. [DOI] [PMC free article] [PubMed] [Google Scholar]
- Ondov B, Bergman N, Phillippy A. Interactive metagenomic visualization in a Web browser. BMC Bioinformatics. 2011;12:385. doi: 10.1186/1471-2105-12-385. [DOI] [PMC free article] [PubMed] [Google Scholar]
- Paffetti D, et al. Influence of plant genotype on the selection of nodulating Sinorhizobium meliloti strains by Medicago sativa. Antonie Van Leeuwenhoek. 1998;73:3–8. doi: 10.1023/a:1000591719287. [DOI] [PubMed] [Google Scholar]
- Paffetti D, Scotti C, Gnocchi S, Fancelli S, Bazzicalupo M. Genetic diversity of an Italian Rhizobium meliloti population from different Medicago sativa varieties. Appl Environ Microbiol. 1996;62:2279–2285. doi: 10.1128/aem.62.7.2279-2285.1996. [DOI] [PMC free article] [PubMed] [Google Scholar]
- Page RD. TreeView: an application to display phylogenetic trees on personal computers. Comput Appl Biosci. 1996;12:357–358. doi: 10.1093/bioinformatics/12.4.357. [DOI] [PubMed] [Google Scholar]
- Pedregosa F, et al. Scikit-learn: machine learning in Python. J Machine Learning Res. 2011;12:2825–2830. [Google Scholar]
- Petersen L, Bollback JP, Dimmic M, Hubisz M, Nielsen R. Genes under positive selection in Escherichia coli. Genome Res. 2007;17:1336–1343. doi: 10.1101/gr.6254707. [DOI] [PMC free article] [PubMed] [Google Scholar]
- Pini F, et al. Exploring the plant-associated bacterial communities in Medicago sativa L. BMC Microbiol. 2012;12:78. doi: 10.1186/1471-2180-12-78. [DOI] [PMC free article] [PubMed] [Google Scholar]
- Pini F, Galardini M, Bazzicalupo M, Mengoni A. Plant-bacteria association and symbiosis: are there common genomic traits in Alphaproteobacteria? Genes. 2011;2:1017–1032. doi: 10.3390/genes2041017. [DOI] [PMC free article] [PubMed] [Google Scholar]
- Popa O, Hazkani-Covo E, Landan G, Martin W, Dagan T. Directed networks reveal genomic barriers and DNA repair bypasses to lateral gene transfer among prokaryotes. Genome Res. 2011;21:599–609. doi: 10.1101/gr.115592.110. [DOI] [PMC free article] [PubMed] [Google Scholar]
- Pritchard L, White JA, Birch PR, Toth IK. GenomeDiagram: a python package for the visualization of large-scale genomic data. Bioinformatics. 2006;22:616–617. doi: 10.1093/bioinformatics/btk021. [DOI] [PubMed] [Google Scholar]
- Rasko DA, et al. The pangenome structure of Escherichia coli: comparative genomic analysis of E. coli commensal and pathogenic isolates. J Bacteriol. 2008;190:6881–6893. doi: 10.1128/JB.00619-08. [DOI] [PMC free article] [PubMed] [Google Scholar]
- Remm M, Storm CEV, Sonnhammer ELL. Automatic clustering of orthologs and in-paralogs from pairwise species comparisons. J Mol Biol. 2001;314:1041–1052. doi: 10.1006/jmbi.2000.5197. [DOI] [PubMed] [Google Scholar]
- Roche P, et al. The common nodABC genes of Rhizobium meliloti are host-range determinants. Proc Natl Acad Sci U S A. 1996;93:15305–15310. doi: 10.1073/pnas.93.26.15305. [DOI] [PMC free article] [PubMed] [Google Scholar]
- Rossbach S, Kulpa DA, Rossbach U, Bruijn FJ. Molecular and genetic characterization of the rhizopine catabolism (mocABRC) genes of Rhizobium meliloti L5–30. Mol Gen Genet. 1994;245:11–24. doi: 10.1007/BF00279746. [DOI] [PubMed] [Google Scholar]
- Schneiker-Bekel S, et al. The complete genome sequence of the dominant Sinorhizobium meliloti field isolate SM11 extends the S. meliloti pan-genome. J Biotechnol. 2011;155:20–33. doi: 10.1016/j.jbiotec.2010.12.018. [DOI] [PubMed] [Google Scholar]
- Simpson JT, et al. ABySS: a parallel assembler for short read sequence data. Genome Res. 2009;19:1117–1123. doi: 10.1101/gr.089532.108. [DOI] [PMC free article] [PubMed] [Google Scholar]
- Soyer Y, Orsi R, Rodriguez-Rivera L, Sun Q, Wiedmann M. Genome wide evolutionary analyses reveal serotype specific patterns of positive selection in selected Salmonella serotypes. BMC Evol Biol. 2009;9:264. doi: 10.1186/1471-2148-9-264. [DOI] [PMC free article] [PubMed] [Google Scholar]
- Sprent JI. Nodulation in legumes. London: Royal Botanic Gardens, Kew; 2001. [Google Scholar]
- Sukumaran J, Holder MT. DendroPy: a Python library for phylogenetic computing. Bioinformatics. 2010;26:1569–1571. doi: 10.1093/bioinformatics/btq228. [DOI] [PubMed] [Google Scholar]
- Talebi Bedaf M, Bahar M, Saeidi G, Mengoni A, Bazzicalupo M. Diversity of Sinorhizobium strains nodulating Medicago sativa from different Iranian regions. FEMS Microbiol Lett. 2008;288:40–46. doi: 10.1111/j.1574-6968.2008.01329.x. [DOI] [PubMed] [Google Scholar]
- Tamura K, et al. MEGA5: molecular evolutionary genetics analysis using maximum likelihood, evolutionary distance, and maximum parsimony methods. Mol Biol Evol. 2011;28:2731–2739. doi: 10.1093/molbev/msr121. [DOI] [PMC free article] [PubMed] [Google Scholar]
- Tatusov RL, et al. The COG database: new developments in phylogenetic classification of proteins from complete genomes. Nucleic Acids Res. 2001;29:22–28. doi: 10.1093/nar/29.1.22. [DOI] [PMC free article] [PubMed] [Google Scholar]
- Tettelin H, Riley D, Cattuto C, Medini D. Comparative genomics: the bacterial pan-genome. Curr Opin Microbiol. 2008;11:472–477. doi: 10.1016/j.mib.2008.09.006. [DOI] [PubMed] [Google Scholar]
- Tian CF, et al. Comparative genomics of rhizobia nodulating soybean suggests extensive recruitment of lineage-specific genes in adaptations. Proc Natl Acad Sci U S A. 2012;109:8629–8634. doi: 10.1073/pnas.1120436109. [DOI] [PMC free article] [PubMed] [Google Scholar]
- Trabelsi D, Mengoni A, Aouani ME, Bazzicalupo M, Mhamdi R. Genetic diversity and salt tolerance of Sinorhizobium populations from two Tunisian soils. Ann Microbiol. 2010;60(3):541–547. [Google Scholar]
- Trabelsi D, Pini F, Aouani ME, Bazzicalupo M, Mengoni A. Development of real-time PCR assay for detection and quantification of Sinorhizobium meliloti in soil and plant tissue. Lett Appl Microbiol. 2009;48:355–361. doi: 10.1111/j.1472-765X.2008.02532.x. [DOI] [PubMed] [Google Scholar]
- Yang Z. PAML: a program package for phylogenetic analysis by maximum likelihood. Comput Appl Biosci. 1997;13:555–556. doi: 10.1093/bioinformatics/13.5.555. [DOI] [PubMed] [Google Scholar]
- Yomtovian I, Teerakulkittipong N, Lee B, Moult J, Unger R. Composition bias and the origin of ORFan genes. Bioinformatics. 2010;26:996–999. doi: 10.1093/bioinformatics/btq093. [DOI] [PMC free article] [PubMed] [Google Scholar]
- Zdobnov EM, Apweiler R. InterProScan—an integration platform for the signature-recognition methods in InterPro. Bioinformatics. 2001;17:847–848. doi: 10.1093/bioinformatics/17.9.847. [DOI] [PubMed] [Google Scholar]
- Zeng K, Fu Y-X, Shi S, Wu C-I. Statistical tests for detecting positive selection by utilizing high-frequency variants. Genetics. 2006;174:1431–1439. doi: 10.1534/genetics.106.061432. [DOI] [PMC free article] [PubMed] [Google Scholar]
Associated Data
This section collects any data citations, data availability statements, or supplementary materials included in this article.