

Abstract
Background and Purpose
For four decades, 5-fluorouracil (5-FU) has been a major anti-cancer medicine. This drug is increasingly used with other anti-cancer agents such as irinotecan. Irinotecan and many others such as PPD (pentyl carbamate of p-aminobenzyl carbamate of doxazolidine) require activation by carboxylesterase-2 (CES2). 5-FU, on the other hand, reportedly induces CES2 in colorectal tumour lines. The aims of this study were to determine the molecular basis for the induction and to ascertain interactive cell-killing activity between 5-FU and ester prodrugs.
Experimental Approach
Colorectal and non-colorectal lines and xenografts were treated with 5-FU and the expression of CES2 was determined. Cell-killing activity of irinotecan and PPD were determined in the presence or absence of CES2 inhibitor. Several molecular experiments were used to determine the molecular basis for the induction.
Key Results
Without exceptions, robust induction was detected in cell lines expressing functional p53. High-level induction was also detected in xenografts. 5-FU pretreatment significantly increased cell-killing activity of irinotecan and PPD. Molecular experiments established that the induction was achieved by both transactivation and increased mRNA stability through p53. Either p63 or p73, functionally related to p53, did not support the transactivation.
Conclusions and Implications
The results in this study suggest that FOLFIRI, a common regimen combining irinotecan and 5-FU, should switch the dosing sequence, namely from 5-FU to irinotecan, to enhance hydrolytic activation of irinotecan. This modified order likely reduces the dose of anti-cancer agents, thus minimizing overall toxicity. The results also conclude that p53 family members act differently in regulating gene expression.
Keywords: 5-fluorouracil, irinotecan, carboxylesterase-2, FOLFIRI, p53
Introduction
Carboxylesterases (CES; E.C.3.1.1.1) constitute a class of hydrolytic enzymes that play critical roles in drug metabolism, detoxification of insecticides and lipid mobilization (Shi et al., 2006, 2010; Wei et al., 2010; Yan, 2012). These enzymes rapidly hydrolyse carboxylic acid esters and, to a lesser extent, amides and thioesters (Shi et al., 2006). Among the top 40 prescribed drugs in the United States in 2010, 20% are esters and 12% are amides (Top 200, 2010). In addition, many drugs such as irinotecan are ester prodrugs and require hydrolytic activation to exert anti-cancer activity (Wu et al., 2002; Barthel et al., 2008; 2009). The human genome contains seven CES genes including a pseudogene (Yan et al., 1999; Yan, 2012). Two carboxylesterases, CES1 and CES2, are recognized to play major roles in drug metabolism (Yan, 2012). CES1 is encoded by two distinct genes: CES1A1 and CES1A2. CES2 is encoded by a single gene but has several variants produced through alternative splicing or alternative use of the translation initiation codon (Yan, 2012).
While both CES1 and CES2 rapidly hydrolyse certain standard substrates such as p-nitrophenyl acetate, many drugs are hydrolysed predominately by one of them (Satoh and Hosokawa, 2006; Shi et al., 2006; Tang et al., 2006). We and other investigators have shown that the relative sizes between the alcohol and acyl (acid) moieties of an ester contribute significantly to the isoform-specific hydrolysis. For example, the anti-influenza prodrug, oseltamivir, has a larger acid group and is hydrolysed by CES1 (Shi et al., 2006). In contrast, the anti-cancer prodrug, irinotecan, has a larger alcohol moiety and is hydrolysed preferably by CES2 (Wu et al., 2002). However, there are exceptions on this alcohol/acyl ratio rule. For example, cis- and trans-permethrins, although identical in terms of the relative sizes of the acid and alcohol moieties, are differentially hydrolysed by CES1 and CES2 (Yang et al., 2009a). Likewise, PPD (pentyl carbamate of p-aminobenzyl carbamate of doxazolidine), a prodrug of the anti-cancer agent doxazolidine, is hydrolysed by CES2 to release 1-pentenol (Barthel et al., 2008). This alcohol moiety is much less than the corresponding acid moiety (<10%). While both PPD and irinotecan are hydrolysed predominately by CES2, irinotecan, but not PPD, causes severe diarrhoea in certain individuals (Barthel et al., 2009; Di Paolo et al., 2011).
Like many other xenobiotic-metabolizing enzymes (Lupp et al., 2008), the expression of CESs is regulated by age (Yang et al., 2009b; Shi et al., 2011) [15], hormones and therapeutic agents (Zhu et al., 2000; Yang and Yan, 2007). In some cases, the regulation exhibits profound-species differences. For example, dexamethasone, a synthetic glucocorticoid, suppressed several major rat CESs (Shi et al., 2008) but slightly induced human CES1 and CES2 (Zhu et al., 2000). Recently, several anti-cancer agents including 5-fluorouracil (5-FU) were shown to induce CES2 in several colorectal tumour lines through transactivation by the tumour suppressor p53, although the magnitude of the transactivation was only moderate compared with the induction of CES2 mRNA (Choi et al., 2006).
This study was performed to determine whether the induction occurs in vivo and whether the induction leads to enhanced cell-killing activity of irinotecan and PPD. As observed in vitro, robust induction of CES2 was detected in xenografts and the induction occurred in a dose-dependent manner. A set of molecular experiments established that the induction was achieved by both transactivation and increased mRNA stability through p53. However, neither p63 nor p73, functionally related proteins to p53, supported the transactivation. In addition, 5-FU pretreatment significantly increased cell killing of irinotecan and PPD. The increase was detected in LS180 but not Huh7 cell line. Likewise, LS180 line, but not Huh7, supported robust induction of CES2. These findings underscore the importance of CES2 induction in the interactive cell killing between 5-FU and CES2-activated prodrugs.
Methods
Chemicals and supplies
α-Amanitin (AAT), crystal violet, cycloheximide (CHX), 5-FU, 1-naphthylacetate, Hanks balanced salt solution and irinotecan hydrochloride were from Sigma (St. Louis, MO, USA). DMEM and high-fidelity Platinum Taq DNA polymerase were from Life Technology (Carlsbad, CA, USA). Dual-Luciferase Reporter Assay System was from Promega (Madison, WI, USA). FBS were from HyClone laboratories (Logan, UT, USA). The antibody against p53 was from Oncogene Research Products (Cambridge, MA, USA). The antibody against GAPDH was from Abcam (Cambridge, UK). The goat anti-rabbit IgG conjugated with HRP was from Pierce (Rockford, IL, USA). Nitrocellulose membranes were from Bio-Rad (Hercules, CA, USA). All cell lines except Huh7 were from American Type Culture Collection (Manassas, VA, USA). Expression constructs for NF-E2-related factor-2 (Nrf2) and p53 family proteins were purchased from OriGene Technologies Inc. (Rockville, MD, USA). Unless otherwise specified, all other reagents were from Fisher Scientific (Fair Lawn, NJ, USA).
Cell treatment and xenografts
All cell lines were maintained in DMEM containing 10% FBS, penicillin and streptomycin, 1× non-essential amino acids. Cells were usually seeded at a density of 3 × 10⁵ cells per well (12 well plates) and treated with a chemical 12 h after seeding. The treatment typically lasted for 48 h. To develop xenografts, nude mice were s.c. implanted LS180 (1 × 10⁶ cells) under isoflurane anaesthesia. Treatment with 5-FU was performed when tumour sizes reached ∼8 mm in diameter. After 48 h, tumours were harvested for the preparation of total RNA and cell lysates. The use of animals was approved by the IACUC. All studies involving animals are reported in accordance with the ARRIVE guidelines for reporting experiments involving animals (Kilkenny et al., 2010; McGrath et al., 2010). Total RNA (1 μg) was subjected to reverse transcription (Ma et al., 2004) and analysed for the level of CES2 mRNA with TaqMan Gene Expression Assay (Applied Biosystems, Foster City, CA, USA), as described previously (Yang et al., 2011). The TaqMan assay identification numbers were as follows. CES2: Hs00187279_m1; GAPDH, 4352934E; and RNA polymerase II, Hs00172187_m1. The mRNA levels were normalized according to the level of GAPDH and the normalization of selected samples was confirmed based on the signal of RNA polymerase II. Amplification and quantification were performed with the Applied Biosystems 7500 Real-Time PCR System.
Reporter assays
The CES2 reporters containing the promoter and its upstream sequence at varying length were prepared by inserting a genomic fragment into the pGL3 basic luciferase vector at the Mlu I and Xho I sites (Yang et al., 2007). All reporter fragments were generated by PCR with high-fidelity Platinum Taq DNA polymerase. The primer sequences are listed in Table 1. The CES2-PE element and CES2-intronic element reporters were prepared by inserting respective oligonucleotides (Table 1) into the pGL3 promoter vector at the Nhe I and Xho I sites. All constructs were confirmed by sequencing. The CES2 intronic reporter was provided by Dr Wei Zhang of the University of Texas MD Anderson Cancer Center (Choi et al., 2006). The reporter assays were performed as described previously (Liu et al., 2008). In addition, the reporters containing CES2 cDNA at different lengths were constructed as well. However, the cDNA reporters were constructed with the promoter/enhancer pGL3 vector at the Xba I and Fse I restriction endonuclease sites.
Table 1.
Sequences of primers for reporter constructs
| Primer | Sequence | Application |
|---|---|---|
| CES2-612MluI | 5′-actgacgcgtgaccctcagaccctggactg-3′ | Reporter |
| CES2-282MluI | 5′-actgacgcgtggcacagccccttccgagga-3′ | Reporter |
| CES2-252MluI | 5′-actgacgcgtgcccgggcaaaggaaagtgg-3′ | Reporter |
| CES2-222MluI | 5′-actgacgcgtgcctgcctaccactagatcc-3′ | Reporter |
| CES2-192MluI | 5′-actgacgcgtatgactgctcagtcccgctc-3′ | Reporter |
| CES2p53-252-222 NheIs | 5′-ctaggcccgggcaaaggaaagtggccgtgcccggg-3′ | Reporter |
| CES2p53-252-222 XhoIa | 5′-tcgacccggggcacggccactttcctttgcccgggc-3′ | Reporter |
| CES2p53-252-222 NheIs-M | 5′-ctaggcccgggctttggaaagtggcgcaccccggg-3′ | Reporter |
| CES2p53-252-222 XhoIa-M | 5′-tcgacccgggtgcgccactttccaaagcccgggc-3′ | Reporter |
| CES2-Intron p53 NheIs | 5′- ctagagaccagcttgggcaacaagacttgtct-3′ | Reporter |
| CES2 Intron p53 XhoIa | 5′- tcgaagacaagtcttgttgcccaagctggtct-3′ | Reporter |
| CES2 Intron p53 1148s | 5′- tgcactgcagggcttcct-3′ | ChIP |
| CES2 Intron p53 1417a | 5′- ctgagtagcttggagtacagc-3′ | ChIP |
| CES2 mRNA-59 Xbals | 5′-gtgctctagaagcggtgaccgcggccctggc-3′ | cDNA reporter |
| CES2 mRNA-1193 FseIa | 5′-gctcggccggccacgaagtctgtgcagccgcat-3′ | cDNA reporter |
| CES2 mRNA-1134 Xbals | 5′-agcctctagatgaacagcagcgtgtccgccg-3′ | cDNA reporter |
| CES2 mRNA-2101 FseIa | 5′-accaggccggccatcatcttgaaaggcttgtta-3′ | cDNA reporter |
| CES2 mRNA-2088 Xbals | 5′-agattctagaaattaacaagcctttcaagat-3′ | cDNA reporter |
| CES2 mRNA-3092 FseI | 5′-tgagggccggcctcactgtgttgccctggctgg-3′ | cDNA reporter |
| CES2 mRNA-3061 Xbals | 5′-cggttctagaccgccagccagg gcaacaca-3′ | cDNA reporter |
| CES2 mRNA-3834 FseIa | 5′-ttcaggccggccagggatgaacggacatag-3′ | cDNA reporter |
EMSA
The EMSA experiment was performed as described previously (Li et al., 2004). Nuclear extracts of LS180 cells treated with 5-FU (10 μM) for 48 h were prepared with the nuclear and cytoplasmic extraction kit (Pierce, Rockford, IL, USA). The sense and anti-sense oligonucleotides (Table 1) were annealed by heating at 94°C for 5 min, followed by gradually cooling to room temperature. The sense strand was synthesized as labelled or non-labelled form (for competition). Nuclear protein (5 μg) was incubated with a double-stranded biotinylated probe (0.1 pmol) at room temperature for 20 min. In competition assays, nuclear extracts were first incubated with an unlabelled probe at a 25× or 100× excess for 20 min before the addition of the labelled probe. For antibody-disruption assay, the nuclear extracts were first incubated with an antibody against p53 (ASK07) on ice for 20 min and then with the labelled probe. The protein-DNA complexes were resolved by non-denaturing PAGE (5%) and transferred onto a Biodyne® nylon membrane (Pierce, Rockford, IL, USA). The biotinylated probe was detected with streptavidin-conjugated HRP and chemiluminescent substrate (Pierce, Rockford, IL, USA). The staining intensity was captured by Carestream 2200 PRO Imager (Carestream Health Inc, Woodbridge, CT, USA).
Chromatin immunoprecipitation (ChIP)
ChIP experiment was performed as essentially described previously (Liu et al., 2008). LS180 cells were treated with 5-FU (10 μM) for 48 h, washed and underwent cross-linking for 15 min by 1.0% formaldehyde at room temperature, and the cross-linking was terminated with glycine (final concentration of 125 mM). The soluble chromatins were prepared as described previously (Liu et al., 2008). For ChIP experiment, chromatins were pre-cleared for 2 h at 4°C with protein G beads pretreated with herring sperm DNA (0.2 mg·mL−1) and BSA (0.5 mg·mL−1). A fraction of the pre-cleared chromatins was stored at −80°C for later use as an input. An antibody against p53 was added into the pre-cleared chromatins, and an overnight incubation at 4°C was performed. As a negative control, incubation was performed with pre-immune IgG. The antibody-bound chromatins and DNA input were analysed by PCR for the presence of the genomic fragments containing the IE, the promoter element or no putative element, with primers shown in Table 1. The PCR was performed with Platinum Taq DNA polymerase for a total of 32 cycles at 94°C for 30 s, 58°C for 30 s and 68°C for 60 s. A 3 min initial denaturation was performed.
Hydrolytic activity
Two experimental approaches were used to determine the hydrolytic activity: native gel electrophoresis and intracellular hydrolysis-based fluorescence. Native gel electrophoresis stained for esterase activity was conducted as described previously (Yang et al., 2001). Cell lysates (10 μg) was solubilized with 0.2% Lubrol and subjected to electrophoresis with a 3% acrylamide stacking gel and a 7.5% acrylamide separating gel. After electrophoresis, the gels were washed for 1 h in 100 mM potassium phosphate buffer (pH 6.5), followed by incubating in the same buffer containing 1-naphthylacetate (5 mM) and 4-benzolamino-2,5-dimethoxybenzenediazonium chloride hemi (zinc chloride) salt, usually termed Fast Blue RR (0.4 mg·mL−1). The staining of esterases by this method is based on the formation of a black, insoluble complex between 1-naphthol hydrolysed from 1-naphthylacetate and Fast Blue RR.
For intracellular hydrolysis, LS180 cells were treated with 5-FU (5 μM) or DMSO for 48 h. The cells were then extensively washed followed by incubation with 0.2 μM PPD for 24 h. PPD was provided by Dr Ted Koch of University of Colorado for PPD. Cell fluorescence intensity was viewed by fluorescent microscope (Nikon TE2000-E, Nikon Instruments Inc., Melville, NY, USA) or quantified by flow cytometry. Cells were plated in 6 well plates and treated with 5-FU (5 μM) and PPD (0.2 μM) for 48 h. For cytometric analysis, cells were washed with PBS, removed and digested with trypsin for 5 min. Single cell suspensions were prepared and transferred to sample tubes, washed again with PBS and analysed by a FACScan flow cytometer.
Other analyses
Protein concentrations were determined with bicinchoninic acid assay (Pierce) based on albumin standard. Western blotting was performed as described previously (Shi et al., 2008). Data are presented as mean ± SD of at least three separate experiments, except where results of blots are shown, in which case a representative experiment is depicted in the figures. Statistical significance between two means was made according to one-way anova, followed by a Duncan's multiple comparison test (P < 0.05). Letters or lines combining with asterisks were used to indicate data points for the comparisons.
Results
In vitro and in vivo induction of CES2 by 5-FU in cell lines with different p53 status
CES2 has been shown to play critical roles in the activation of several anti-cancer ester prodrugs such as irinotecan (Wu et al., 2002; Barthel et al., 2008). It has been reported that 5-FU, commonly used in combination with irinotecan, markedly induced CES2 mRNA in several colorectal tumour lines and the induction required the presence of functional p53 (Choi et al., 2006). In this study, we first tested whether the induction occurs in non-colorectal tumour lines and whether the induction occurs in vivo. Cells were treated with 5-FU and the level of CES2 mRNA was determined. Consistent with the previous report (Choi et al., 2006), induction of CES2 mRNA varied markedly, depending on the status of p53 but not the organs from which a cell line was derived. For example, HepG2 (hepatic origin) and LS180 (colorectal origin), known to express functional p53 (Thottassery et al., 1997; Calvisi et al., 2011), supported robust induction of CES2 mRNA (Figure 1A). In contrast, little induction was detected in cells HT29 (colon), Caco-2 (colorectal) and Huh7 (Hepatic) (Figure 1A). These lines are known to express non-functional p53 (Thottassery et al., 1997; Choi et al., 2006; Calvisi et al., 2011; Ray et al., 2011). The induction of CES2 mRNA occurred in a concentration-dependent manner and proportionally increased CES2 protein (Figure 1B). To link the induction to clinical situation, mice were xenografted with LS180 and treated with 5-FU at comparable concentrations used for the in vitro study. As shown in Figure 1C, xenografts with 5-FU-treated mice increased CES2 protein and hydrolytic activity up to approximately twofold.
Figure 1.
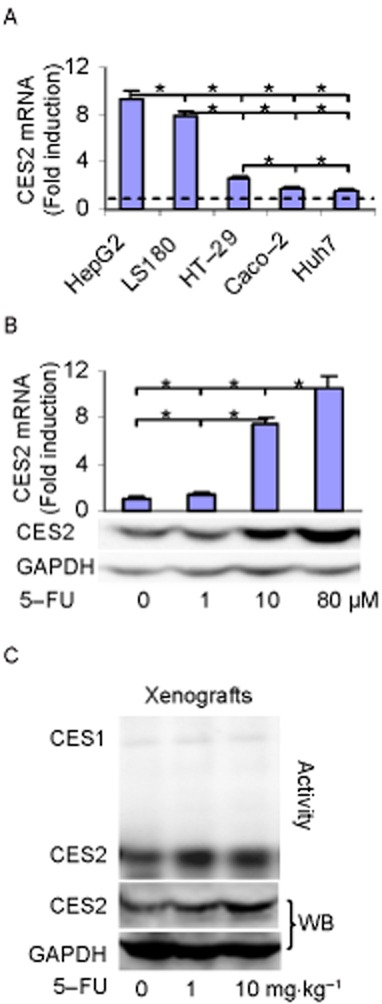
Induction of CES2 mRNA in vitro and in vivo. (A) Induction of CES2 mRNA in various tumour lines wherein HepG2, LS180, HT-29, Caco-2 and Huh7 cells were treated with 5-FU at 10 μM or DMSO for 48 h. The level of CES2 mRNA was determined by RT-qPCR. The level of CES2 mRNA was normalized according to the level of GAPDH mRNA and expressed as fold of induction. *Indicates statistical significance (P < 0.05). (B) Induction of CES2 mRNA as a function of 5-FU LS180 cells was treated with 5-FU at 0, 1, 10 or 80 μM and the level of CES2 mRNA was determined. *Indicates statistical significance (P < 0.05). (C) Induction of CES2 in vivo wherein xenograft-bearing mice (n = 4) were i.v. injected with 5-FU (0, 1 and 10 mg·kg−1) and tumours were harvested 48 h after the treatment. Homogenates (5 μg) from pooled samples analysed by Western blotting or stained for the hydrolysis of 1-naphthylacetate as described in the Methods section.
Transactivation of CES2 by p53 but not p63 or p73
It is well established that the p53 class of proteins is sequence-specific transcription factors (Maiyar et al., 1996; Moll et al., 2006; Patel et al., 2008; Noureddine et al., 2009; Dötsch et al., 2010; Zdzalik et al., 2010). We next confirmed whether 5-FU induces CES2 through transactivation. To test this possibility, induction of CES2 by 5-FU was performed in the presence or absence of RNA polymerase II inhibitor AAT and protein synthesis inhibitor CHX (Shi et al., 2010). As shown in Figure 2A, both AAT and CHX abolished the induction, suggesting that the induction is achieved by transactivation and requires newly synthesized protein (Figure 2A). Next, we tested whether 5-FU activates the CES2 promoter. Dissection analysis of the CES2 promoter and upstream regulatory sequence located an element (−252 to −222) that supported the transactivation in response to 5-FU. This element, designated proximal element (PE), is a putative p53 element based on computer program prediction.
Figure 2.
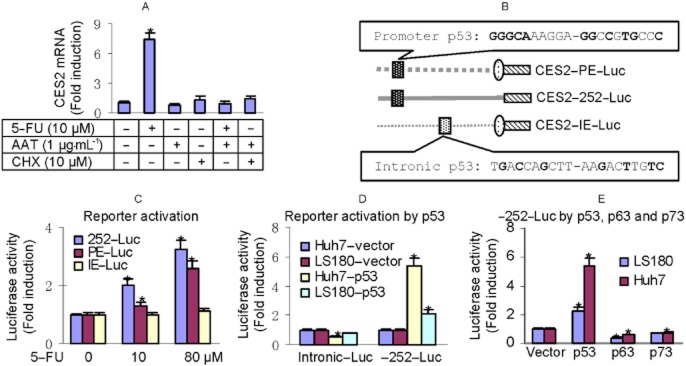
Activation of CES2 reporters by 5-FU. (A) Effect of AAT or CHX on the induction of CES2 mRNA LS180 cells were treated with 5-FU (10 μM) or in combination with AAT (1 μg·mL−1) or CHX (10 μM) for 48. The level of CES2 mRNA was determined by RT-qPCR. (B) Diagrams of various reporters. Solid lines represent the real sequence, but dotted lines represent deleted sequences. (C) Activation of CES2 reporters LS180 cells were transiently transfected by FuGene HD with a mixture containing 50 ng of a reporter, or the vector along with 5 ng of the null-Renilla luciferase plasmid. The transfected cells were then treated with 5-FU at 0–80 μM for 24 h. Luciferase activities were determined with a Dual-Luciferase Reporter Assay System and the signals were expressed as fold of activation. *Indicates statistical significance from the vector (P < 0.05). (D) Activation of CES2-252-Luc by p53 LS180 and Huh7 cells transfected with a mixture containing 50 ng of CES2-252-Luc and 5 ng of the null-Renilla luciferase plasmid along with 20 ng of p53 plasmid or the vector. After 24 h of incubation, luciferase activities were determined and expressed as above. *Indicates statistical significance from the vector control (P < 0.05). (E) Relative transactivation of CES2-252-Luc by p53, p63 or p73 LS180 cells were transfected as above and luciferase activities were determined as above. *Indicates statistical significance (P < 0.05).
Choi et al. (2006) reported earlier that an intronic p53 element (IE) in the CES2 gene supported 5-FU in the transactivation. The PE has 55% sequence identity, whereas the IE has 35% with the consensus p53 element (in bold) (Figure 2B). Nevertheless, we next tested whether the PE and IE differ in supporting the transactivation of CES2 in LS180. As shown in Figure 2C, both CES2-252-Luc and CES2-PE-Luc but not CES2-IE-Luc responded to 5-FU and the transactivation increased with increasing concentrations of 5-FU. It should be emphasized that comparable activation was detected in HepG2 but not Huh7 line. Once again, the former, but not the later, expresses functional p53. To test whether transfection of p53 into Huh7 cells is sufficient to support the activation of CES2-252-Luc, Huh7 and LS180 were transfected with a p53 expression plasmid along with the CES2-252-Luc reporter. As shown in Figure 2D, transfection of p53 increased the activation of CES2-252-Luc by sixfold in Huh7 cells and twofold in LS180 respectively. The higher activation in Huh7 cells was likely due to its lower basal activity compared with LS180 cells. In contrast, the CES2-intronic Luc reporter was not activated in either cell line, and actually, this reporter was repressed in both lines (Figure 2D). The p53 family has several members and they share similar DNA binding specificity (Patel et al., 2008; Dötsch et al., 2010). We next tested whether p63 and p73 activated CES2-252-Luc. As shown in Figure 2E, p63 and p73, in contrast to p53, repressed this reporter.
Differential interaction with p53 between the promoter and intronic p53 elements
It was surprising that the promoter, but not the intronic reporter, was activated by p53 (Figure 2D). We next tested whether these elements differentially interact with p53. We first performed EMSA. As shown in Figure 3A, incubation of the promoter element with the nuclear extract from p53-transfected cells led to two major shifted bands, a typically banding pattern of p53 (Maiyar et al., 1996). These bindings, however, were completely competed by cold promoter element or abolished considerably by an antibody against p53. Interestingly, the bindings were also competed by the IE (Figure 3A). These findings suggested that both the promoter and the IEs are bound by p53, with the promoter element being bound to a higher extent.
Figure 3.
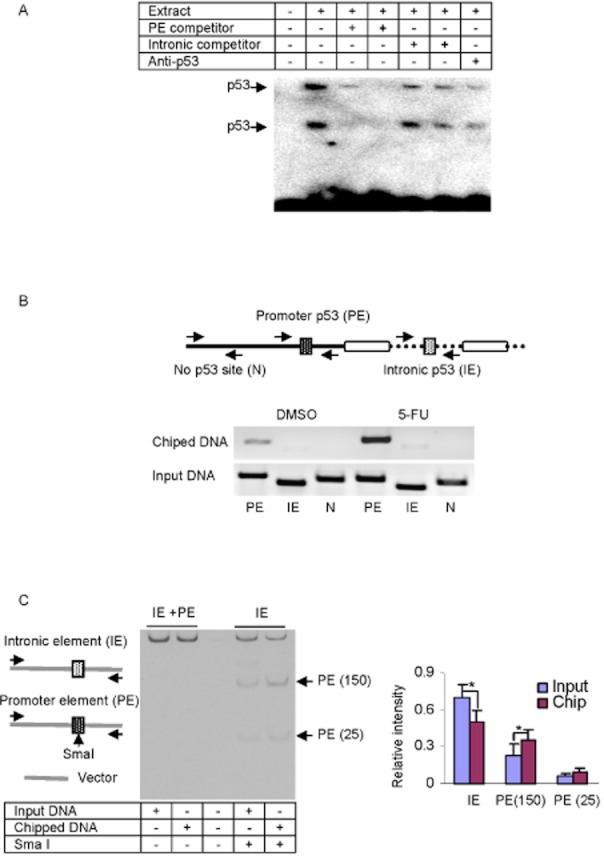
Analyses of the PE p53 element by EMSA and ChIP. (A) EMSA analysis of nuclear extracts (5 μg) from LS180 cells treated with 5-FU (10 μM) for 48 h that were incubated with a biotinylated probe containing the PE p53 element (0.1 pmol) for 20 min. In the competition assay, nuclear extracts were pre-incubated with the unlabelled PE p53 element (25× or 100×), intronic p53 element (25× or 100×) for 5 min, and then incubated with the biotinylated probe. In disruption assay, nuclear extracts were incubated first with an antibody against p53 on ice for 20 min and then with the biotinylated probe. The protein-DNA complexes were electrophoretically resolved, transferred to a Biodyne nylon membrane and located with streptavidin-conjugated HRP and chemiluminescent substrate. (B) ChIP analysis of the LS180 cells that were treated with 5-FU (10 μM) or DMSO for 48 h, washed and underwent cross-linking for 15 min by 1% formaldehyde, and the cross-linking was terminated with 125 mM glycine. The soluble chromatins were prepared, pre-cleared with protein G beads and incubated with anti-p53 antibody or pre-immune IgG. The antibody-bound chromatins and DNA input (1/20 of the antibody-bound chromatins) were analysed by PCR for the presence of the genomic fragments containing the PE p53 element, the intronic p53 element or no putative p53 element, with the primers indicated in the diagram. The primer sequences are shown in Table 1. (C) ChIP analysis on PE and IE reporters, in which LS180 cells were transfected with CES2-PE-Luc (1.2 μg, PE), CES2-intronic E-Luc (1.2 μg, IE) and p53 (0.5 μg). ChIP analyses were performed as described earlier. However, the primers for PCR recognized the vector sequences. The amplified PCR products were purified and digested with Sma I (PE but not IE contains a Sma I site). The digested products were analysed by 7% PAGE and stained by ethidium bromide. The left part shows representative staining image, whereas the right part shows the quantitative results from three separate experiments. *Indicates statistical significance (P < 0.05). All experiments in this figure were performed three times.
We next tested whether these two elements are differentially bound by p53 intracellularly. ChIP experiment was performed in LS180 cells treated with 5-FU or DMSO. As shown in Figure 3B, chipped DNA by p53 antibody showed the abundant presence of this transcription factor in the region containing the promoter but not the IE. The presence was greatly enhanced in 5-FU-treated cells (Figure 3B). As expected, the region (labelled as N) lacking a putative p53 binding site was not enriched by p53 antibody (Figure 3B). It should be noted that pre-immune IgG was used as a control but did not enrich any fragments (data not shown). To further establish that the promoter element represents a p53 binding site with higher binding affinity than the IE, we performed the ChIP experiment with chromatins from cells transfected with the promoter and IEs together. The p53 antibody-enriched chromatins were amplified by the primers recognizing the vector and the amplified fragments were subjected to Sma I digestion. The promoter, but not the intronic, element was digested by this endonuclease to produce fragments with 25 and 150 base pairs respectively. As shown in Figure 3C, ChIP significantly enriched the promoter element reporter and proportionally decreased the enrichment of the IE reporter (Figure 3C, right).
Increases in intracellular hydrolysis and interactive enhancement in cell killing
To shed light on the potential clinical significance of the induction, we tested whether 5-FU pretreatment increases intracellular hydrolysis of PPD, a prodrug of the anti-cancer agent doxazolidine (Barthel et al., 2008). PPD undergoes exclusive hydrolysis by CES2, and the hydrolytic metabolite of PPD produces strong fluorescent chromophore (Barthel et al., 2008; 2009), allowing the hydrolysis to be monitored in intact cells. As shown in Figure 4A (left), pretreatment with 5-FU, compared with the vehicle, increased the intracellular fluorescence upon treatment with PPD. The increase was statistically significant based on cytometric analysis (Figure 4A, middle). To specify the induction of CES2, the lysates were subjected to native gel electrophoresis stained for CES activity with 1-naphthylacetate, a standard substrate for CES. As shown in Figure 4A (right), both CES1- and CES2-based hydrolyses were markedly increased, with CES2 activity being increased to a much greater extent. PPD did not increase the activity of CES2.
Figure 4.
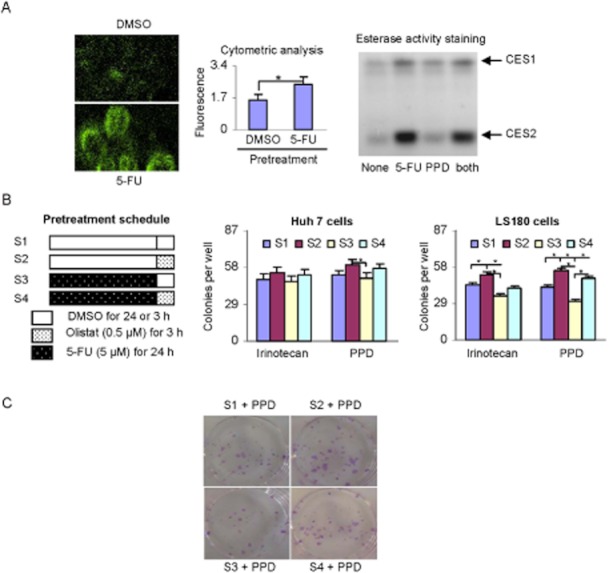
Intracellular hydrolysis of PPD and interactive cell killing among 5-FU, irinotecan and PPD. (A) Hydrolysis of PPD in which LS180 cells were treated with 5-FU (5 μM) or DMSO for 48 h and then incubated with PPD (0.2 μM) for 24 h. Cell fluorescence intensity was viewed by fluorescent microscope (Nikon TE2000-E) (left) or quantified by flow cytometry (middle). Lysates (10 μg) from the treated cells were subjected to native gel electrophoresis and stained for esterase activity with 1-naphythalacetate as described in the Methods section. The staining intensity was captured by Carestream 2200 PRO Imager. (B) Pretreatment schedules and colonogenic formation cells (Huh7 and LS180) were seeded at a 10% confluence overnight and pretreated with a schedule (left). After extensive washing, cells were treated with irinotecan (0.3 μM) or PPD (0.2 μM) for 48 h. The cells were cultured for 15 days and colonies were stained with 0.1% crystal violet. The results are from three separate experiments and * indicates statistical significance (P < 0.05). (C) Representative colony staining of LS180 was shown.
To link the induction directly to anti-cancer activity, the effect of 5-FU pretreatment on the clonogenic inhibition by irinotecan and PPD was determined. Huh7 and LS180 cells were pretreated with four schedules (Figure 4B, left) and 5-FU was used at 5 μM, a concentration that caused significant induction of CES2 but only moderate clonogenic inhibition (16–19%). In addition, orlistat was used in some cases to selectively inhibit CES2-based catalysis (Xiao et al., 2013). Consistent with the little induction of CES2 in Huh7 cells (Figure 1A), pretreatment of this cell line with 5-FU did not enhance cell-killing activity of irinotecan or PPD (Figure 4B, middle), although moderate attenuation was detected by orlistat pretreatment (pretreatment schedule-2 and 4: S2 and S4). In contrast, pretreatment of LS180 cells with 5-FU caused significant reduction in clonogenesis in response to irinotecan and PPD (schedule-3, S3) (Figure 4B, right). Importantly, orlistat reversed the effect of 5-FU pretreatment on the reduction of clonogenesis, although the reversal did not reach statistical significance in the case of irinotecan (Figure 4, right). Figure 4C shows representative clonogenic images in LS180 line by 5-FU pretreatment, PPD and the reversal by orlistat. It should be noted that cell viability assay, commonly referred to as MTT, showed similar interactive cell toxicity between 5-FU and an ester prodrug.
Involvement of mRNA stability in CES2 induction
Clearly, transactivation plays a major role in the induction of CES2 by 5-FU. However, the reporter activation (Figure 2), compared with the induction of CES2 mRNA (Figure 1), was modest. One explanation is that the induction of CES2 mRNA was achieved by increasing CES2 mRNA stability as well (in addition to transactivation). To shed light on this possibility, luciferase reporters were constructed to include part of CES2 cDNA sequence, designated as cDNA reporters, and tested for altered activity by 5-FU. As shown in Figure 5, the cDNA reporters, CES2-59/1193Luc and CES2-2088/3092Luc, showed significant increased activity in 5-FU-treated cells. The increase with CES2-59/1193Luc was greater than that with CES2-2088/3092Luc. Next, we tested whether these reporters respond to p53 or p63. As shown in Figure 5 (right), all cDNA reporters, compared with the vector reporter, showed increased activity in p53-transfecetd cells, with CES2-59/1193Luc increasing the most. In contrast, p63 caused increases in two cDNA reporters and decreases in the remaining two.
Figure 5.
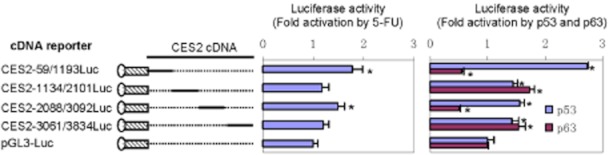
CES2 cDNA reporter activation by 5-FU, p53 or p63. LS180 cells were transfected with a mixture containing 50 ng of a cDNA luciferase reporter or the vector along with 5 ng of the null-Renilla luciferase plasmid. The transfected cells were then treated with DMSO or 5-FU (10 μM) for 24 h and luciferase activities were determined as above. The reporter signals were normalized with Renilla luciferase and expressed as fold of activation (middle). *Indicates statistical significance from the vector (P < 0.01). Alternatively, LS180 cells were transfected with a mixture containing 50 ng of a cDNA reporter, and 5 ng of the null-Renilla luciferase plasmid along with 20 ng of p53 or p63 plasmid. Luciferase activities were determined as above. *Indicates statistical significance from the vector (P < 0.05). All experiments in this figure were performed three times.
Discussion
CES2 is abundantly expressed in the liver and the gastrointestinal tract, and this CES represents a major pharmacokinetic determinant of many chemotherapeutic agents (Yan, 2012). 5-FU is widely used in combination with other chemotherapy agents, including irinotecan, to treat several types of cancer and has been on the market for many decades (Poujol et al., 2007; Toffoli et al., 2010; Lee and McKay, 2011; Tamura et al., 2011; Yamashita et al., 2011). In this study, we have shown that 5-FU significantly induced CES2 and the induction occurred in vitro and in vivo (Figure 1). A p53 element in the CES2 proximal promoter supported the transactivation (Figures 2 and 3). However, a promoter reporter harbouring this element was activated by p53 but not its functionally related protein p63 and p73 (Figure 2). Importantly, pretreatment with 5-FU significantly enhanced the inhibitory potential of anti-cancer ester prodrug irinotecan and PPD on clonogenesis (Figure 4), providing a therapeutic interaction with a potential of enhanced anti-cancer activity.
The induction-based interaction operates at a highly sensitive level. In this study, we have shown that 5-FU at 10 μM, a small fraction of plasma concentrations commonly seen in patients (Bocci et al., 2006), induced CES2 mRNA by as many as ninefold (Figure 1). Importantly, cells pretreated with this concentration showed significant reductions in clonogenic formation in response to irinotecan at 0.3 μM (Figure 4). Likewise, the concentration of irinotecan used in this study represented 10% of the plasma concentrations commonly seen in patients (de Jonge et al., 2000). The enhanced cell-killing activity was also detected with PPD (Figure 4). Both irinotecan and PPD are therapeutically activated by CES2, although they differ in the mechanisms of action in anti-cancer (Barthel et al., 2009; Marsh and Hoskins, 2010), suggesting a critical role of CES2 induction in enhanced cell killing. Interestingly, the reduction of clonogenesis by PPD was significantly reversed by orlistat, a potent CES2 inhibitor (Figure 4, right). However, this inhibitor was less effective in reversing the inhibited clonogenesis by irinotecan. The differential reversal on irinotecan and PPD was likely due to their differences in the metabolic activation by CESs. PPD is exclusively hydrolysed by CES2 (Barthel et al., 2009), whereas irinotecan is a substrate of both CES1 and CES2 (Wu et al., 2002; Sanghani et al., 2004). Although irinotecan is preferably hydrolysed by CES2, it is likely that CES1 effectively hydrolyses this ester in the absence of CES2.
The enhanced cell-killing activity of irinotecan and PPD by 5-FU pretreatment argues for the importance of the order of administration in the dosing schedules, although clinical trials are required to definitively establish this possibility. While we have shown that 5-FU is a potent inducer of CES2, the induction was completely abolished by AAT (transcription inhibitor) and CHX (protein synthesis inhibitor) (Figure 2A). These findings suggest that induction of CES2 represents an event secondary to another, namely the induction of p53. Interestingly, FOLFIRI, one of the standard regimens for advanced colorectal cancer, uses a reversed order of administration (Tamura et al., 2011; Yamashita et al., 2011). This regimen consists of 2 h i.v. infusion of l-leucovorin, 90 min i.v. infusion of irinotecan followed by i.v. bolus of 5-FU on day 1. Clearly, this regimen may not have much CES2 induction-based enhancement of irinotecan therapy. On the other hand, lack of the enhancement likely reduces adverse effects associated with the use of irinotecan, which is potentially a major merit of the FOLFIRI protocol (Poujol et al., 2007). Alternatively, maximization of the CES2-induction-based enhancement, namely a reversal of the irinotecan and 5-FU administration in FOLFIRI and probably separated by 1 day, likely requires much lower dosing of irinotecan, thus reducing toxic potential. Given the importance of p53 in the induction, hydrolysis-based enhancement will be evident in the tumours that express functional p53.
Interestingly, p63 and p73, two functionally related proteins to p53, did not transactivate the CES2-252-Luc (Figure 2E), a CES2 promoter reporter. These two proteins are highly identical in the DNA binding domain (>60%) (Noureddine et al., 2009; Dötsch et al., 2010). It is established that p53 family members recognize similar DNA elements. On the other hand, these proteins are much less identical in other regions than the DNA binding domain. For example, the N-terminal sequences show a <30% sequence identity (Zdzalik et al., 2010). These regions may prevent p63 and p73 from binding to the element in the native promoter. Alternatively, these regions may recruit proteins with different transactivation activity and such differential recruitment occurs only with the native promoter context. In support of this possibility, the N-terminal sequence among these proteins has been shown to differentially interact with other protein (de Jonge et al., 2000; Zdzalik et al., 2010). Therefore, the magnitude of the induction is likely determined by the relative levels of members of the p53 family of proteins.
It was surprising that the previously reported IE showed little responsiveness to 5-FU (Figure 2). While both elements are predicted to respond to p53, the proximal promoter element is closer to the p53 consensus sequence than the IE (Figure 2B). Whether differences in these nucleotides are responsible for the weaker interaction with p53 remains to be determined. Nevertheless, the IE competed with the promoter element for p53 binding, although the competitive binding was modest (Figure 3A). Consistent with the weaker binding, ChIP detected the abundant presence of p53 in the promoter but not the IE-containing genomic fragment (Figure 3B). To further support the weaker interaction of the IE with p53, our reporter transfection coupled ChIP analysis detected significantly higher enrichment of the promoter – than the intronic – element reporter (Figure 3C). Clearly, the promoter element is critical for the induction of CES2 in response to 5-FU. However, the magnitude of transactivation of all CES2 promoters tested showed only moderate response compared with the induction of CES2 mRNA (Figures 1 and 2). Among all promoter reporters, the maximal activation by 5-FU at 10 μM was approximately twofold, whereas the same concentration induced CES2 mRNA by as many as eightfold (Figures 1 and 2). It is likely that increased stability of CES2 mRNA is at least, in part, responsible for higher magnitude of mRNA induction (Figures 1 and 5).
In summary, our work points to several important conclusions. First, p53 induces CES2 by transactivation and increased mRNA stability. Second, the induction of CES2 provides an example on how p53 family members act differently in regulating gene expression, although they share similar DNA binding specificity. Third, we have shown that induction of CES2 presents a source for hydrolysis-based interactions among commonly used anti-cancer medicines. Fourth, these interactions may favour the anti-cancer activity, but the sequence of administering these drugs may be important for maximizing the therapeutic potentials and minimizing the toxicological responses.
Acknowledgments
We thank Dr Eileen Dolan of the University of Chicago for providing the CES2 promoter reporter, Wei Zhang of the University of Texas MD Anderson Cancer Center for the intronic CES2 reporter and Dr Ted Koch of University of Colorado for PPD. This work was supported by NIH grants R01GM61988 and R01ES07965.
Glossary
- AAT
α-amanitin
- CES
carboxylesterase
- ChIP
chromatin immunoprecipitation
- CHX
cycloheximide
- 5-FU
5-fluorouracil
- PPD
pentyl carbamate of p-aminobenzyl carbamate of doxazolidine
Conflict of interest
The authors indicate no potential conflict of interest.
References
- Barthel BL, Torres RC, Hyatt J, Edwards CC, Hatfield MJ, Potter PM, et al. Identification of human intestinal carboxylesterase as the primary enzyme for activation of a doxazolidine carbamate prodrug. J Med Chem. 2008;51:298–304. doi: 10.1021/jm7011479. [DOI] [PubMed] [Google Scholar]
- Barthel BL, Zhang Z, Rudnicki DL, Coldren CD, Polinkovsky M, Sun H, et al. Preclinical efficacy of a carboxylesterase 2-activated prodrug of doxazolidine. J Med Chem. 2009;52:7678–7688. doi: 10.1021/jm900694z. [DOI] [PMC free article] [PubMed] [Google Scholar]
- Bocci G, Barbara C, Vannozzi F, Di Paolo A, Natale G, Del Tacca M, et al. A pharmacokinetic-based test to prevent severe 5-fluorouracil toxicity. Clin Pharmacol Ther. 2006;80:384–395. doi: 10.1016/j.clpt.2006.06.007. [DOI] [PubMed] [Google Scholar]
- Calvisi DF, Simile MM, Ladu S, Frau M, Evert M, Tomasi ML. Activation of v-Myb avian myeloblastosis viral oncogene homolog-like2 (MYBL2)-LIN9 complex contributes to human hepatocarcinogenesis and identifies a subset of hepatocellular carcinoma with mutant p53. Hepatology. 2011;53:1226–1236. doi: 10.1002/hep.24174. [DOI] [PubMed] [Google Scholar]
- Choi W, Cogdell D, Feng Y, Hamilton SR, Zhang W. Transcriptional activation of the carboxylesterase 2 gene by the p53 pathway. Cancer Biol Ther. 2006;5:1450–1456. doi: 10.4161/cbt.5.11.3271. [DOI] [PubMed] [Google Scholar]
- Di Paolo A, Bocci G, Polillo M, Del Re M, Di Desidero T, Lastella M, et al. Pharmacokinetic and pharmacogenetic predictive markers of irinotecan activity and toxicity. Curr Drug Metab. 2011;12:932–943. doi: 10.2174/138920011798062283. [DOI] [PubMed] [Google Scholar]
- Dötsch V, Bernassola F, Coutandin D, Candi E, Melino G. p63 and p73, the ancestors of p53. Cold Spring Harb Perspect Biol. 2010;2:a004887. doi: 10.1101/cshperspect.a004887. [DOI] [PMC free article] [PubMed] [Google Scholar]
- de Jonge MJ, Verweij J, de Bruijn P, Brouwer E, Mathijssen RH, van Alphen RJ, et al. Pharmacokinetic, metabolic, and pharmacodynamic profiles in a dose-escalating study of irinotecan and cisplatin. J Clin Oncol. 2000;18:195–203. doi: 10.1200/JCO.2000.18.1.195. [DOI] [PubMed] [Google Scholar]
- Kilkenny C, Browne W, Cuthill IC, Emerson M, Altman DG. NC3Rs Reporting Guidelines Working Group. Br J Pharmacol. 2010;160:1577–1579. doi: 10.1111/j.1476-5381.2010.00872.x. [DOI] [PMC free article] [PubMed] [Google Scholar]
- Lee AD, McKay MJ. Symptomatic 5-fluorouracil-induced sinus bradycardia. Intern Med J. 2011;41:566–570. doi: 10.1111/j.1445-5994.2011.02523.x. [DOI] [PubMed] [Google Scholar]
- Li Y, Song X, Ma Y, Liu J, Yang D, Yan B. DNA binding, but not interaction with BmalI, is responsible for DEC1-mediated transcription regulation of the circadian gene Per1. Biochem J. 2004;382:895–904. doi: 10.1042/BJ20040592. [DOI] [PMC free article] [PubMed] [Google Scholar]
- Liu F, Yang D, Song X, Deng R, Yan B. The far and distal enhancers in the CYP3A4 gene coordinates the proximal promoter in responding to the pregnane X receptor similarly but differentially to hepatocyte nuclear factor-4α. Biochem J. 2008;409:243–250. doi: 10.1042/BJ20070613. [DOI] [PMC free article] [PubMed] [Google Scholar]
- Lupp A, Glöckner R, Etzrodt J, Müller D. Pharmacokinetic and pharmacogenetic predictive markers of irinotecan activity and toxicity. Anal Bioanal Chem. 2008;392:1173–1184. doi: 10.1007/s00216-008-2253-z. [DOI] [PubMed] [Google Scholar]
- Ma Y, Sachdeva K, Liu J, Ford M, Yang D, Khan IA, et al. Desmethoxyyangonin and dihydromethysticin are two major pharmacological kavalactones with potent activity on the induction of cytochrome P4503A23. Drug Metab Dispos. 2004;32:1317–1324. doi: 10.1124/dmd.104.000786. [DOI] [PubMed] [Google Scholar]
- McGrath J, Drummond G, McLachlan E, Kilkenny C, Wainwright C. Guidelines for reporting experiments involving animals: the ARRIVE guidelines. Br J Pharmacol. 2010;160:1573–1576. doi: 10.1111/j.1476-5381.2010.00873.x. [DOI] [PMC free article] [PubMed] [Google Scholar]
- Maiyar A, Huang A, Phu P, Cha H, Firestone G. p53 stimulates promoter activity of the sgk serum/glucocorticoid inducible serine/threonine protein kinase gene in rodent mammary epithelial cells. J Biol Chem. 1996;271:12414–12422. doi: 10.1074/jbc.271.21.12414. [DOI] [PubMed] [Google Scholar]
- Marsh S, Hoskins JM. Irinotecan pharmacogenomics. Pharmacogenomics. 2010;11:1003–1010. doi: 10.2217/pgs.10.95. [DOI] [PMC free article] [PubMed] [Google Scholar]
- Moll UM, Marchenko N, Zhang XK. p53 and Nur77/TR3 – transcription factors that directly target mitochondria for cell death induction. Oncogene. 2006;25:4725–4743. doi: 10.1038/sj.onc.1209601. [DOI] [PubMed] [Google Scholar]
- Noureddine MA, Menendez D, Campbell MR, Bandele OJ, Horvath MM, Wang X, et al. Probing the functional impact of sequence variation on p53-DNA interactions using a novel microsphere assay for protein-DNA binding with human cell extracts. PLoS Genet. 2009;5:e1000462. doi: 10.1371/journal.pgen.1000462. [DOI] [PMC free article] [PubMed] [Google Scholar]
- Patel S, Bui TT, Drake AF, Fraternali F, Nikolova PV. The p73 DNA binding domain displays enhanced stability relative to its homologue, the tumor suppressor p53, and exhibits cooperative DNA binding. Biochemistry. 2008;47:3235–3244. doi: 10.1021/bi7023207. [DOI] [PubMed] [Google Scholar]
- Poujol S, Pinguet F, Ychou M, Abderrahim AG, Duffour J, Bressolle FM. A limited sampling strategy to estimate the pharmacokinetic parameters of irinotecan and its active metabolite, SN-38, in patients with metastatic digestive cancer receiving the FOLFIRI regimen. Oncol Rep. 2007;18:1613–1321. [PubMed] [Google Scholar]
- Ray RM, Bhattacharya S, Johnson LR. Mdm2 inhibition induces apoptosis in p53 deficient human colon cancer cells by activating p73- and E2F1-mediated expression of PUMA and Siva-1. Apoptosis. 2011;16:35–44. doi: 10.1007/s10495-010-0538-0. [DOI] [PubMed] [Google Scholar]
- Sanghani SP, Quinney SK, Fredenburg TB, Davis WI, Murry DJ, Bosron WF. Human carboxylesterases: an update on CES1, CES2 and CES3. Drug Metab Dispos. 2004;32:505–511. doi: 10.1124/dmd.32.5.505. [DOI] [PubMed] [Google Scholar]
- Satoh T, Hosokawa M. Structure, function and regulation of carboxylesterases. Chem Biol Interact. 2006;162:195–211. doi: 10.1016/j.cbi.2006.07.001. [DOI] [PubMed] [Google Scholar]
- Shi D, Yang J, Yang D, LeCluyse EL, Black C, You L, et al. Anti-influenza prodrug oseltamivir is activated by carboxylesterase HCE1 and the activation is inhibited by anti-platelet agent clopidogrel. J Pharmacol Exp Ther. 2006;319:1477–1484. doi: 10.1124/jpet.106.111807. [DOI] [PubMed] [Google Scholar]
- Shi D, Yang J, Yang D, You L, Yan B. Dexamethasone suppresses the expression of multiple rat carboxylesterases through transcriptional repression: evidence for an involvement of the glucocorticoid receptor. Toxicology. 2008;254:97–105. doi: 10.1016/j.tox.2008.09.019. [DOI] [PMC free article] [PubMed] [Google Scholar]
- Shi D, Yang D, Yan B. Dexamethasone transcriptionally increases the expression of the pregnane X receptor and synergistically enhances pyrethroid esfenvalerate in the induction of cytochrome P450 3A23. Biochem Pharmacol. 2010;80:1274–1283. doi: 10.1016/j.bcp.2010.06.043. [DOI] [PMC free article] [PubMed] [Google Scholar]
- Shi D, Yang D, Prinssen EP, Davies BE, Yan B. Surge in expression of carboxylesterase-1 during the post-natal stage enables a rapid gain of the capacity to activate the anti-influenza prodrug oseltamivir. J Infect Dis. 2011;203:937–942. doi: 10.1093/infdis/jiq145. [DOI] [PMC free article] [PubMed] [Google Scholar]
- Tamura T, Kuwahara A, Kadoyama K, Yamamori M, Nishiguchi K, Inokuma T, et al. Effects of bolus injection of 5-fluorouracil on steady-state plasma concentrations of 5-fluorouracil in Japanese patients with advanced colorectal cancer. Int J Med Sci. 2011;8:406–412. doi: 10.7150/ijms.8.406. [DOI] [PMC free article] [PubMed] [Google Scholar]
- Tang M, Mukundan M, Yang J, Charpentier N, LeCluyse E, Black C, et al. Anti-platelet agents aspirin and clopidogrel are hydrolyzed by distinct carboxylesterases and clopidogrel is transesterificated in the presence of ethyl alcohol. J Pharmacol Exp Ther. 2006;319:1467–1476. doi: 10.1124/jpet.106.110577. [DOI] [PubMed] [Google Scholar]
- Thottassery JV, Zambetti GP, Arimori K, Schuetz EG, Schuetz JD. p53-dependent regulation of MDR1 gene expression causes selective resistance to chemotherapeutic agents. Proc Natl Acad Sci U S A. 1997;94:11037–11042. doi: 10.1073/pnas.94.20.11037. [DOI] [PMC free article] [PubMed] [Google Scholar]
- Toffoli G, Cecchin E, Gasparini G, D'Andrea M, Azzarello G, Basso U, et al. Genotype-driven phase I study of irinotecan administered in combination with fluorouracil/leucovorin in patients with metastatic colorectal cancer. J Clin Oncol. 2010;28:866–871. doi: 10.1200/JCO.2009.23.6125. [DOI] [PMC free article] [PubMed] [Google Scholar]
- Top 200. 2010. http://www.pharmacytimes.com/media/pdf/26babf64401fed80734dbf8dce471e26 (accessed 21 June 2012)
- Wei E, Ben Ali Y, Lyon J, Wang H, Nelson R, Dolinsky VW, et al. Loss of TGH/Ces3 in mice decreases blood lipids, improves glucose tolerance, and increases energy expenditure. Cell Metab. 2010;11:183–193. doi: 10.1016/j.cmet.2010.02.005. [DOI] [PubMed] [Google Scholar]
- Wu MH, Yan B, Humerickhouse R, Dolan ME. Irinotecan activation by human carboxylesterases in colorectal adenocarcinoma cells. Clin Cancer Res. 2002;8:2696–2700. [PubMed] [Google Scholar]
- Xiao D, Shi D, Yang D, Barthel B, Koch TH, Yan B. Carboxylesterase-2 is a highly sensitive target of the antiobesity agent orlistat with profound implications in the activation of anticancer prodrugs. Biochem Pharmacol. 2013;85:439–447. doi: 10.1016/j.bcp.2012.11.026. [DOI] [PMC free article] [PubMed] [Google Scholar]
- Yamashita K, Nagashima F, Fujita K, Yamamoto W, Endo H, Miya T, et al. Phase I/II study of FOLFIRI in Japanese patients with advanced colorectal cancer. Jpn J Clin Oncol. 2011;41:204–209. doi: 10.1093/jjco/hyq197. [DOI] [PubMed] [Google Scholar]
- Yan B. Hydrolytic enzymes. In: Zanger UM, Anzenbacher P, editors. Metabolism of Drugs and Other Xenobiotics. Weinheim: Wiley-VCH Verlag GmbH & Co. KGaA; 2012. pp. 165–199. [Google Scholar]
- Yan B, Matoney L, Yang D. Human placental carboxylesterases: enzymatic characterization, molecular cloning, and evidence for the existence of multiple forms. Placenta. 1999;20:599–607. doi: 10.1053/plac.1999.0407. [DOI] [PubMed] [Google Scholar]
- Yang D, Li Y, Yuan X, Matoney L, Yan B. Regulation of rat carboxylesterase expression by 2,3,7,8-tetrachlorodibenzo-p-dioxin (TCDD): a dose-dependent decrease in mRNA levels but a biphasic change in protein levels and activity. Toxicol Sci. 2001;64:20–27. doi: 10.1093/toxsci/64.1.20. [DOI] [PubMed] [Google Scholar]
- Yang D, Wang X, Yang D, Yan B. Pyrethroid insecticides: isoform-dependent hydrolysis, induction of cytochrome P450 3A4 and evidence on the involvement of the pregnane X receptor. Toxicol Appl Pharmacol. 2009a;237:49–58. doi: 10.1016/j.taap.2009.02.012. [DOI] [PMC free article] [PubMed] [Google Scholar]
- Yang D, Pearce R, Wang X, Gaedigk R, Wan YJY, Yan B. Human carboxylesterases HCE1 and HCE2: ontogenic expression, inter-individual variability and differential hydrolysis of oseltamivir, aspirin, deltamethrin and permethrin. Biochem Pharmacol. 2009b;77:238–247. doi: 10.1016/j.bcp.2008.10.005. [DOI] [PMC free article] [PubMed] [Google Scholar]
- Yang D, Shi D, Yang J, Deng R, Yan B. Scoparone potentiates transactivation of the bile salt export pump gene and the effect is enhanced by cytochrome P450 metabolism but abolished by a PKC inhibitor. Brit J Pharmacol. 2011;164:1547–1557. doi: 10.1111/j.1476-5381.2011.01522.x. [DOI] [PMC free article] [PubMed] [Google Scholar]
- Yang J, Yan B. Photochemotherapeutic agent 8-methoxypsoralen induces the expression of cytochrome P450 3A4 and carboxylesterase HCE2: evidence on a differential involvement of the pregnane X receptor. Toxicol Sci. 2007;95:13–22. doi: 10.1093/toxsci/kfl120. [DOI] [PMC free article] [PubMed] [Google Scholar]
- Yang J, Shi D, Yang D, Song X, Yan B. Interleukin-6 suppresses the expression of carboxylesterases HCE1 and HCE2 through transcriptional repression. Mol Pharmacol. 2007;72:686–694. doi: 10.1124/mol.107.036889. [DOI] [PubMed] [Google Scholar]
- Zdzalik M, Pustelny K, Kedracka-Krok S, Huben K, Pecak A, Wladyka B, et al. Interaction of regulators Mdm2 and Mdmx with transcription factors p53: p63 and p73. Cell Cycle. 2010;9:4584–4591. doi: 10.4161/cc.9.22.13871. [DOI] [PubMed] [Google Scholar]
- Zhu W, Song L, Zhang H, Matoney L, LeCluyse EL, Yan B. Dexamethasone differentially regulates the expression of carboxylesterase genes in humans and rats. Drug Metab Dispos. 2000;28:186–191. [PubMed] [Google Scholar]