

Abstract
The prototypic second messenger cyclic AMP (cAMP) is essential for controlling cellular metabolism, including glucose and lipid homeostasis. In mammals, the majority of cAMP functions are mediated by cAMP-dependent protein kinase (PKA) and exchange proteins directly activated by cAMP (Epacs). To explore the physiological functions of Epac1, we generated Epac1 knockout mice. Here we report that Epac1 null mutants have reduced white adipose tissue and reduced plasma leptin levels but display heightened leptin sensitivity. Epac1-deficient mice are more resistant to high-fat diet-induced obesity, hyperleptinemia, and glucose intolerance. Furthermore, pharmacological inhibition of Epac by use of an Epac-specific inhibitor reduces plasma leptin levels in vivo and enhances leptin signaling in organotypic hypothalamic slices. Taken together, our results demonstrate that Epac1 plays an important role in regulating adiposity and energy balance.
INTRODUCTION
Obesity is a grave health problem, as it is closely related to the leading causes of morbidity and mortality, such as cardiovascular diseases, type 2 diabetes, hypertension, depression, and cancer (1). Over the last 2 decades, obesity has reached epidemic proportions in the United States: more than 35% of adults in the United States are obese, and more than two-thirds are overweight (2). Furthermore, 500 million people worldwide are obese, representing approximately 12% of the adult population on earth (3). Chronic excessive food/energy intake, mediated by leptin resistance, is a major factor contributing to obesity. To date, few effective treatment options are available for obesity (4). Therefore, a better understanding of the underlying molecular mechanisms of obesity development and effective, safe therapeutic interventions are urgently needed. Cyclic AMP (cAMP)-mediated signaling pathways are important for maintaining metabolic homeostasis and have been implicated in regulating leptin production and secretion (5–7). In mammals, the majority of cAMP functions are mediated by cAMP-dependent protein kinase (PKA) and exchange proteins directly activated by cAMP (Epacs) (8–10). A recent study revealed that activation of Epacs by an Epac-selective cAMP analog, 8-CPT-2′-O-Me-cAMP (11), interferes with leptin signaling in the hypothalamus, suggesting that Epacs may contribute to the pathophysiology of leptin resistance and represent a novel pharmacological target for treatment of obesity (12). To investigate the functional significance of Epac1 in leptin-mediated energy balance in vivo, we generated global loss-of-function mutants for Epac1. Analysis of these animals indicated resistance to high-fat diet (HFD)-induced obesity, heightened leptin signaling in the arcuate nucleus (AN), and improved glucose tolerance. These findings reveal an important role of Epac1 in metabolism and suggest that Epac1 may represent a novel therapeutic target for obesity.
MATERIALS AND METHODS
Mice.
To construct an Epac1 targeting vector, two loxP sites were inserted into introns 2 and 5. A 3.8-kb upstream fragment and a 3.8-kb downstream fragment were used as 5′ and 3′ recombinant arms, respectively. A neomycin resistance cassette flanked by two FRT sites was inserted into intron 5 as a positive-selection marker. The diphtheria toxin A (DTA) cassette was used as a negative-selection marker to assist the rate of positive recombinant events. The linearized targeting DNA was electroporated into R1 mouse embryonic stem (ES) cells at the UCSD Transgenic and Gene Targeting Core. After G418 selection, genomic DNA of ES cells was digested with the restriction enzyme EcoRV and hybridized with a DNA probe amplified from a 470-bp DNA fragment obtained from upstream of the 5′ arm by a PCR using the oligonucleotides 5′-GAAGCCAGGCAACGAGATT-3′ and 5′-AGGCACGAGCTTTACGGTAG-3′. A 17-kb band in gels represented the wild-type allele, and an 8-kb band represented the recombinant allele. All DNA fragments were amplified from mouse ES cell genomic DNA and verified by DNA sequencing.
Two correct recombinant ES cell clones were microinjected into C57BL/6 blastocysts and transferred to pseudopregnant foster mice. Male chimeras were mated with female black Swiss mice, and progenies with germ line transmission (fneo/+) were confirmed by PCR. Heterozygous (Epac1+/−) mice were obtained by crossing with protamine-Cre carrier mice (13). Wild-type (+/+) and Epac1 null (−/−) mice were generated by breeding heterozygous mice. Mice used in this study were backcrossed to the C57BL/6 background for 10 generations and derived from wild-type or homozygous littermates. The mice were housed with a 12-h–12-h light-dark cycle, with free access to water and food. All animal experiments were performed according to protocols approved by the Institutional Animal Care and Use Committee of the University of Texas Medical Branch or the University of California, San Diego.
HFD studies.
Only male mice were used in this study. Wild-type and Epac1 knockout mice were initially fed on a normal chow diet (Teklad 7912; 3.1 kcal/g, with 25% of calories from protein, 17% of calories from fat, and 58% of calories from carbohydrate). On postnatal day 24, the wild-type and Epac1 knockout mice were continued on the chow diet or placed on a specific high-fat diet (HFD) (ResearchDiet D12492; 5.24 kcal/g, with 60% of calories from fat, 20% of calories from protein, and 20% of calories from carbohydrate). Food intake and body weight gain were followed up every 4 days.
Analyses of hypothalamus STAT3 activation in response to leptin administration.
Three-week-old male mice were fasted overnight and administered 5 μg of recombinant murine leptin (PeproTech) or 1× phosphate-buffered saline (PBS) via intracerebroventricular (ICV) injection as described previously (14). Thirty minutes after leptin injection, the mice were perfused intracardially with PBS for 3 min followed by 4% paraformaldehyde (PFA) for 20 min. The mouse brain was carefully removed, put into 4% PFA at 4°C for an additional 1 h, and cryoprotected in a 30% sucrose solution. Brains were embedded in Shandon M-1 embedding matrix (Thermo Scientific) and frozen at −80°C. Thirty-micrometer coronal sections were cut with a cryostat (Leica) and mounted on glass slides. Immunofluorescence staining of pSTAT3 Y705 was done as described previously (15), with minor modifications. Briefly, the tissue were pretreated with 1% NaOH for 20 min, 0.3% glycine for 10 min, and 0.03% sodium dodecyl sulfate for 10 min. After that, sections were blocked for 1 h with 3% normal goat serum in PBS–0.4% Triton X-100 and 1% bovine serum albumin (BSA), and pSTAT3 antibody (rabbit anti-P-STAT3; Cell Signaling) was added at a dilution of 1:500 in blocking solution (PBS–0.4% Triton X-100, 1% BSA, and 3% goat serum) and incubated overnight at 4°C. The slides were washed 3 times for 5 min each with PBS–0.4% Triton X-100 and then incubated with Alexa 488-conjugated goat anti-rabbit secondary antibody (Invitrogen) diluted 1:500 in blocking solution for 1 h at room temperature. After that, the slides were washed again with PBS–0.4% Triton X-100 3 times for 5 min each and then mounted with Vectashield mounting medium with DAPI (4′,6-diamidino-2-phenylindole) (Vector Laboratories). Images were acquired with a Nikon Eclipse C1si confocal microscope.
Dissection of brain hypothalamus tissue for Western blot determination of total STAT3 and pSTAT3 was accomplished as described previously (16). The dissected tissues were frozen and sonicated in lysis buffer (320 mM sucrose, 5 mM HEPES, pH 7.4, 1 mM NaF, and 1% SDS supplemented with 1% phosphatase inhibitor cocktail I, 0.5% phosphatase inhibitor cocktail II, and 1% protease inhibitor cocktail [Sigma-Aldrich, MO]). The specimens were then centrifuged, and supernatants were collected and subjected to immunoblotting analysis using antibodies specific for STAT3 phosphorylated at tyrosine 705 (9131; Cell Signaling, MA), total STAT3 (9139; Cell Signaling), SHP2 (3397; Cell Signaling), Epac1 (4155; Cell Signaling), Epac2 (4156; Cell Signaling), suppressor of cytokine signaling 3 (SOCS3) (2923; Cell Signaling), and α-tubulin (2125; Cell Signaling). AlphaEaseFC software V4.01 (Alpha Innotech, San Jose, CA) was used to quantify Western blotting results.
Hypothalamic organotypic slice culture.
Hypothalamic slices were prepared as described by Fukuda et al. (12). Coronal slices containing the arcuate nucleus were placed on Millicell-CM filters (pore size of 0.4 μm and diameter of 30 mm; Millipore) and maintained at the air-medium interface in minimum essential medium (MEM; Invitrogen) supplemented with 25% heat-inactivated horse serum (Invitrogen), 32 mM glucose, and 2 mM GlutaMAX (Invitrogen) for 7 days, with the medium replaced three times a week. After overnight incubation in low-serum (2.5%) MEM supplemented with GlutaMAX (2 mM), slices were first pretreated with 50 μM Epac-specific inhibitor (ESI-09) or control vehicle for 15 min and subsequently treated with 200 nM leptin in PBS or PBS alone, respectively. After 30 min of additional incubation, protein lysates were prepared from the organotypic slices and subjected to immunoblotting analysis as described above.
Preparation of MEFs and induction of adipogenic differentiation.
Mouse embryonic fibroblasts (MEFs) were isolated from mouse embryos at 12.5 to 13.5 days postcoitum (dpc), as previously described (17). The MEF cells from passage 2 were used for in vitro adipocyte differentiation. For in vitro differentiation of MEFs, MEFs were incubated at 37°C and 5% CO2 in Dulbecco's modified Eagle's medium (DMEM) supplemented with 10% FBS. Adipocyte differentiation was induced 2 days after confluence by use of 5 μg/ml insulin, 0.5 mM IBMX (3-isobutyl-1-methylxanthine), 1 μM thiazolidinedione (TZD), and 1 μM dexamethasone (Dex) for 2 days, followed by DMEM containing 10% FBS, 1 μM TZD, and 5 μg/ml insulin for 2 more days. Subsequently, the cells were maintained in DMEM containing 10% FBS for 5 to 7 days. Oil red staining was performed for the visualization of adipocytes.
Plasma leptin and insulin measurements.
The plasma leptin and insulin concentrations were determined by colorimetric sandwich enzyme-linked immunosorbent assay (ELISA), using R&D Quantikine mouse leptin immunoassay kits (R&D Systems, MN) and an Ultrasensitive Mouse Insulin ELISA kit (Crystal Chem Inc.) following the manufacturers' instructions.
Whole-body micro-CT scan and fat volume measurement.
Mouse whole-body scans were performed using a Siemens Inveon MultiModality micro-computed tomography (micro-CT) system (Siemens Preclinical Solutions, Knoxville, TN). All mice were imaged in a prone position on the scanner radiolucent bed. Anesthesia was provided with 1 to 2% isoflurane carried by O2 through a nose cone during the period of the scan. The high-resolution micro-CT exposure settings were 70 kVp, 500 μA, a 1,000-ms exposure time, and 360° rotation. The images were reconstructed to achieve a voxel size of around 107 μm. Data analysis was done using Siemens Inveon research workplace software (Siemens Preclinical Solutions, Knoxville, TN). The body length between the C1 and L6 vertebrae was measured and expressed in mm. The total volume of the adipose tissue was measured in three-dimensional (3D) volume punch mode, using Siemens Syngo VE36a MultiModality workplace software. The fat tissue was defined as previously described, with Hounsfield units set between −277 and −32 (18). The weight of fat tissue was calculated with a density factor of 0.92 g/ml (19). Coronal reconstruction images from 3D data were rendered with GE Advantage Workstation, version 4.0 (General Electric Medical Systems, Milwaukee, WI).
OGTT and ITT.
Mice were fasted overnight (oral glucose tolerance test [OGTT]) or for 4 h (insulin tolerance test [ITT]). For OGTT, mice were orally administered d-glucose (1g/kg body weight). For ITT, mice received an intraperitoneal (i.p.) injection of human insulin (Eli Lilly) at 0.5 mU/g body weight. The tail blood glucose concentration was measured 0, 15, 30, 60, 90, and 120 min after challenge by use of a OneTouch Ultra blood glucometer and test strips.
Leptin response study.
Mice of an indicated genotype and age were housed individually and acclimated for at least 7 days prior to the experiment. Body weight and food intake were measured daily at 6:00 p.m. (before the start of the dark cycle) and 10:00 p.m. (first 4 h of the dark cycle). The baseline body weight and food intake were established by the averages for 3 consecutive days' measurements. The response to leptin was calculated by measurement of the first 4-h food intake, 24-h food intake, and body weight after injection of the indicated dose of leptin at 6:00 p.m.
Spontaneous locomotor activity measurement.
Five mice of each indicated genotype at 20 weeks old were housed individually in polycarbonate cages, each equipped with a running wheel (ACT-551; Coulbourn Instruments), in a colony room at a constant temperature (21 to 23°C) and humidity (45 to 50%) on a 12-h light-dark cycle (lights on from 5:00 a.m. to 5:00 p.m.). The mice were acclimated in the cage for at least 1 week prior to a 7-day continuous recording of the wheel-running event. Clocklab software (Actimetrics Inc., IL) was used to record and determine the time of activity onset and total activity indices. Data were analyzed by the unpaired t test.
RESULTS
Epac1−/− mice display blunted body weight gain.
Global Epac1 knockout mice were generated using the Cre-loxP system (Fig. 1) and backcrossed to the C57BL/6 background for 10 generations. Epac1 null mutant mice appeared healthy, in general, without any obvious physical abnormalities. They had similar body weights to those of wild-type mice at birth and for up to 3 weeks of age, when the mice were weaned and started on the high-fat diet or standard rodent chow. The body weight gains of Epac1−/− mice on the standard chow diet slowed down and became significantly lower than those of the wild-type mice around week 5, with body weights eventually reaching approximately 85% of those of the wild-type mice (Fig. 2A and B). Similar observations were made for the HFD-fed mice. The body weights of Epac1−/− mice became significantly lower around week 7 and were maintained at about 90% of those of wild-type mice (Fig. 2C and D). The average daily food intake of Epac1−/− mice on the chow diet was significantly lower than that of the wild-type mice. On the other hand, while the average daily food intake of Epac1−/− mice on HFD was lower than that of the wild-type mice on HFD, the difference was not statistically significant (Fig. 2E). To rule out the possibility that the Epac1−/− mice failed to thrive after weaning, we performed whole-body micro-CT scans on HFD-fed mice and measured body lengths from the C1 to L6 vertebrae. As shown in Fig. 2F, the Epac1−/− mice were the same length as the wild-type mice. This suggests that the body weight gain lag in Epac1−/− mice was not the result of overall growth retardation.
Fig 1.

Generation of Epac1 knockout mice. (A) Exons 3 to 5 of the Epac1 gene were flanked by two loxP sites (triangles). A neomycin resistance cassette flanked by two Frt sites (open rectangles) was inserted into intron 5 of the mouse Epac1 gene. A DTA cassette was used to assist in correct recombination. (B) Immunoblotting analysis shows complete deletion of the Epac1 protein in the Epac1−/− (KO) heart, liver, pancreas, and kidney. Wt, wild type.
Fig 2.

Deletion of Epac1 decreases body weight gains of mice on standard chow and a high-fat diet. (A) Appearance of 10-month-old wild-type and Epac1−/− mice. (B) Body weight changes of wild-type and Epac1−/− mice on standard chow diet. Data are means ± standard deviations (SD). *, P < 0.05 by unpaired t test. (C) Appearance of 10-month-old wild-type and Epac1−/− mice on HFD. (D) Body weight changes of wild-type and Epac1−/− mice on HFD. Data are means ± SD. *, P < 0.05 by unpaired t test. (E) Average daily food intakes of wild-type and Epac1−/− mice on high-fat and chow diets. Data are means and SD. (F) Body lengths of wild-type and Epac1−/− mice after 10 weeks on HFD. The body length was measured from the C1 to L6 vertebrae.
Epac1 deficiency reduces adiposity.
To determine why body weight gains were reduced in Epac1−/− mice, we next examined the adiposity of the animals and observed that the epididymal fat pads of Epac1−/− mice were visually smaller and weighed significantly less than those of wild-type mice (Fig. 3A and B). When mice were analyzed by micro-CT imaging, we further observed that the total fat masses of Epac1 null mice on HFD were significantly lower than those of wild-type mice (Fig. 3C and D). This difference was significant even after the fat mass was normalized to body weight. In fact, the difference in total fat mass was larger than the difference in body weight, suggesting that the reduced body weights of Epac1−/− mice were due mainly to reductions in fat mass. A decrease in adipose tissue mass can be the result of impaired adipocyte differentiation, a reduction of adipocyte size, or both. Histological analysis of epididymal white fat tissue (EWAT) revealed that adipocytes from Epac1 null mice were much smaller than those from their wild-type counterparts (Fig. 3E). On the other hand, ex vivo adipocyte differentiation analyses using MEF cells isolated from both wild-type and Epac1−/− mice revealed that the Epac1−/− MEFs were as competent as wild-type MEFs to differentiate into adipocytes (Fig. 3F), suggesting that Epac1 deficiency did not impede normal adipogenesis.
Fig 3.

Epac1 deficiency reduces adiposity. (A) Gross morphology of EWAT of wild-type and Epac1−/− mice after 37 weeks on HFD. (B) Ratios of EWAT to body weight for age-matched 18-week-old wild-type and Epac1−/− mice on HFD. (C) Coronal projection images of 3D reconstructions of micro-CT scans of wild-type and Epac1−/− mice on HFD. The adipose tissue is highlighted in red. (D) Total body fat masses of age-matched 18-week-old wild-type and Epac1−/− mice on HFD, determined by whole-body CT imaging. (E) Hematoxylin and eosin staining of paraffin-embedded EWAT sections from 20-week-old wild-type and Epac1−/− mice on chow. (F) In vitro differentiation of adipocytes from mouse embryonic fibroblasts.
Leptin is secreted by adipose tissue, and the plasma levels of leptin are known to correlate with adipose tissue mass, while plasma leptin levels fall in both humans and mice after weight loss (20–22). To investigate if a reduced fat mass was correlated with reduced plasma leptin in Epac1 null mice, we compared the plasma leptin levels of Epac1−/− and wild-type mice on standard chow and HFD. For mice on the standard chow diet, the average plasma leptin level for 16-week-old wild-type mice was around 3.97 ± 0.78 ng/ml (mean ± standard error of the mean [SEM]), consistent with previous publications (23, 24). However, the plasma leptin level of the age- and gender-matched Epac1−/− mice was significantly lower, at about 1.01 ± 0.26 ng/ml (Fig. 4A). For the wild-type mice on HFD at 28 weeks of age (25 weeks on HFD), the average leptin concentration was about 83.16 ± 5.76 ng/ml, whereas the average leptin level of Epac1−/− mice was about 66.15 ± 3.52 ng/ml (Fig. 4B). These results corroborate the anatomical and morphological observation that Epac1 deficiency reduced white fat tissue adiposity in the standard chow diet- as well as HFD-fed mice.
Fig 4.
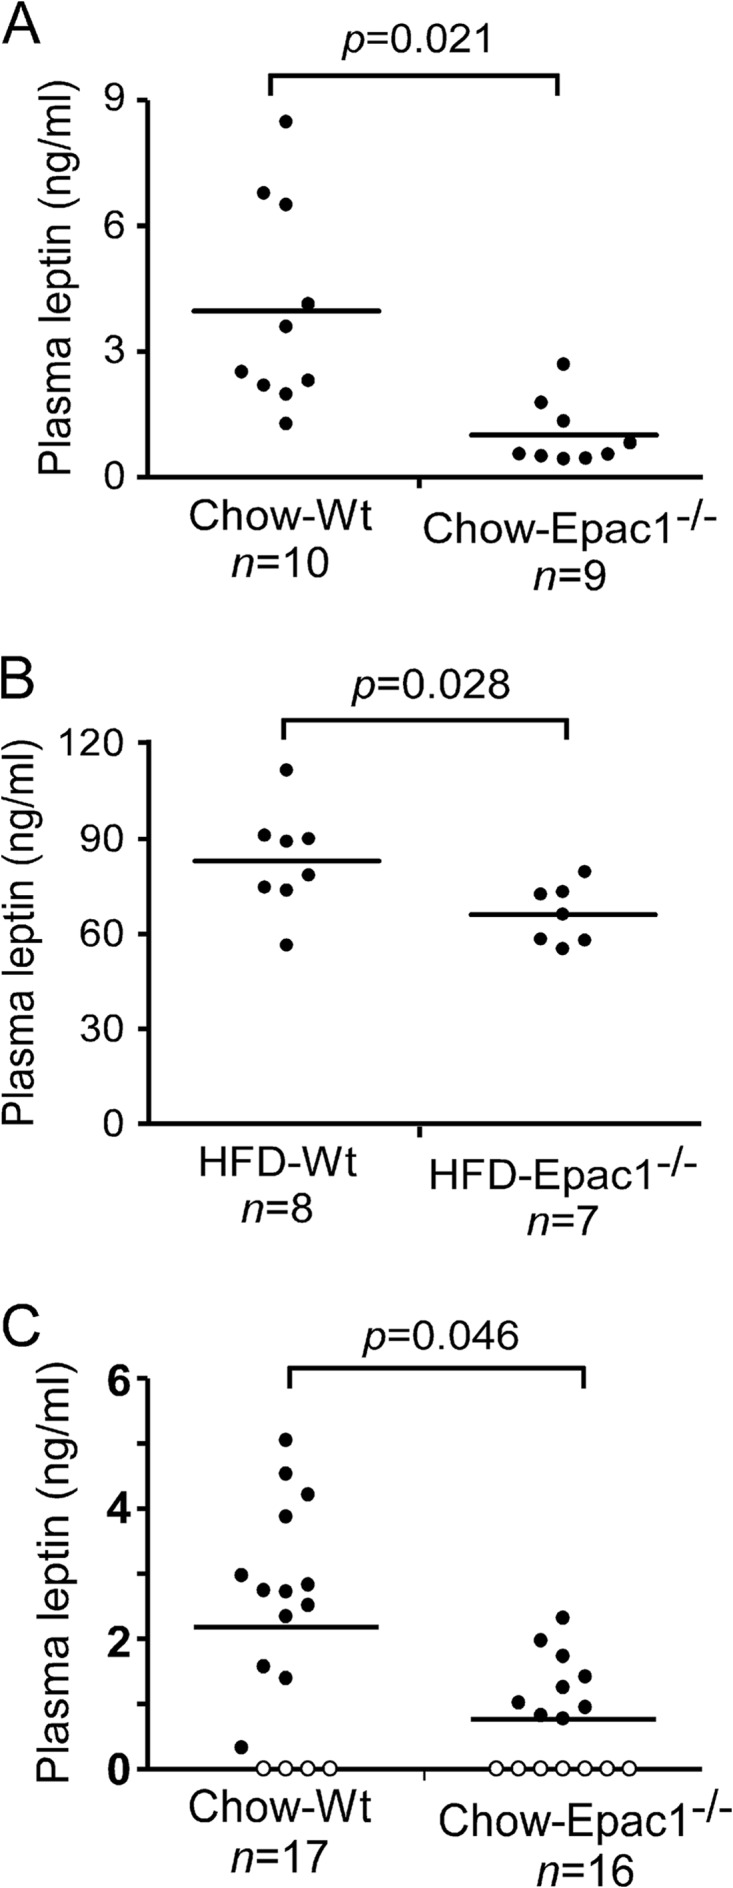
Epac1 deficiency reduces plasma leptin levels. Fasting plasma leptin levels are shown for 16-week-old age-matched wild-type and Epac1−/− mice on chow (A) and 28-week-old age-matched wild-type and Epac1−/− mice on HFD (B). (C) Plasma leptin levels of 3-week-old age-matched wild-type and Epac1−/− mice on chow. Open circles represent levels below the detection limit of the assay.
To determine if the apparent decreases in plasma leptin levels were merely the result of decreased adiposity, we measured the leptin levels of 3-week-old mice, before significant body weight and adiposity differences could be observed between the wild-type and Epac1 mull mice. As shown in Fig. 4C, leptin levels in Epac1−/− mice were already reduced significantly compared to those in age- and gender-matched wild-type mice.
Loss of Epac1 heightens leptin signaling activity and sensitivity in vivo.
In light of the recent finding by Fukuda et al. that activation of Epac-RAP1 with the Epac-selective agonist 8-pCPT-2′-O-Me-cAMP [8-(4-chlorophenylthio)-2′-O-methyladenosine-3′,5′-cyclic monophosphorothioate] blunts leptin signaling in the hypothalamus and causes central leptin resistance (12), we specifically compared the pSTAT3 Y705 localization and immunoreactivity in the arcuate nucleus (AN), with or without Epac1, to determine the consequence of reduced plasma leptin levels associated with the loss of Epac1 on leptin sensitivity in vivo. The proopiomelanocortin neurons are direct targets of leptin in the hypothalamus, and leptin-induced STAT3 Y705 phosphorylation and nuclear translocation in the AN are involved in body weight regulation (23, 25–27). As shown in Fig. 5A, the Epac1−/− AN tissue displayed a slightly enhanced baseline level (PBS vehicle injection) of pSTAT3 Y705 immunoreactivity and a markedly increased nuclear immunostaining of pSTAT3 Y705 in response to ICV injection of leptin compared to wild-type tissue. To further compare the total pSTAT3 Y705 level in the hypothalamus upon stimulation with leptin, we repeated ICV leptin injections and excised the hypothalamus for immunoblotting analysis. Consistent with our immunofluorescence study, the basal and stimulated levels of pSTAT3 Y705 were both increased in the Epac1−/− hypothalamic tissue (Fig. 5B), suggesting that a loss of Epac1 enhances central leptin signaling and sensitivity while decreasing peripheral (plasma) leptin levels in vivo.
Fig 5.

Heightened leptin signaling in Epac1−/− hypothalamus. (A) Immunofluorescence staining of pSTAT3 Y705 in the hypothalamus 30 min after ICV injection of vehicle (PBS) or leptin (5 μg) into the 3rd ventricle (3v) of a 3-week-old wild-type or Epac1−/− mouse. (B) Western blotting of pSTAT3 Y705, total STAT3, SOCS3, SHP2, Epac1, and Epac2 in the hypothalamus 30 min after ICV injection of vehicle (PBS) or leptin (5 μg) into the lateral ventricle of a 3-week-old wild-type or Epac1−/− mouse. (C) Quantitation of SHP2 Western blotting results for 4 pairs of male mice at 3 to 4 weeks of age. Data are means ± SEM.
The effects of heightened leptin signaling and sensitivity are unlikely to be due to the compensation of Epac2 expression, as the Epac2 expression levels were not affected by the lack of Epac1 protein (Fig. 5B). It has been reported that Epac1 activation enhances SOCS3 expression and subsequently suppresses interleukin-6 (IL-6)-mediated STAT3 phosphorylation in vascular endothelial cells (28). However, the level of SOCS3 in the hypothalamus was not significantly affected by deletion of Epac1 (Fig. 5B). SHP2 (also known as protein tyrosine phosphatase 11 [PTP11]) is another important regulator of leptin-Jak2-Stat3 signaling (29). We therefore examined the SHP2 protein levels in hypothalamic tissues from wild-type and Epac1−/− mice. As shown in Fig. 5C, SHP2 was moderately but reproducibly elevated in the Epac1−/− hypothalamus.
To investigate if this increased leptin sensitivity associated with the loss of Epac1 translates into decreased food intake and body weight in response to leptin in vivo, we performed intraperitoneal injections of leptin into 20-week-old mice. We first individually housed the mice for 1 week to acclimate them to the environment. Escalation of leptin was utilized to cover a wide range of doses (30). Due to the nocturnal activity of mice and the short half-life of leptin (31, 32), we measured food intake during the first 4 hours of the dark cycle, food intake during the entire 24-hour period, and body weight at the beginning of each dark cycle. We found that food intake over the first 4 h of the dark cycle decreased in a dose-dependent manner in response to leptin administration. Epac1−/− mice displayed a significant reduction in food intake at the higher doses of leptin versus wild-type mice during the first 4-hour dark cycle (Fig. 6A). Although the 24-hour food intake also decreased with leptin administration, the magnitude of the decrease was not statistically significant (Fig. 6B). Interestingly, leptin injection induced a transient body weight decrease in the wild-type mice, which recovered quickly even with the highest dose of leptin. In contrast, leptin induced a persistent and dose-dependent body weight reduction in Epac1−/− mice (Fig. 6C). These results demonstrate that Epac1 deficiency enhances leptin signaling in the hypothalamus and that Epac1−/− mice are more sensitive to leptin treatment in vivo with regard to the reduction of food intake and body weight.
Fig 6.

Epac1−/− mice are more responsive to leptin treatment. Dose-dependent food intake measurements are shown for the first 4 h of the dark cycle (A) and for 24 h (B) after leptin administration to Epac1−/− and wild-type mice. (C) Dose-dependent body weight measurements in response to leptin administration in Epac1−/− and wild-type mice. Data are means ± SEM. *, P < 0.05. BW, body weight.
To explore the feasibility of increasing leptin sensitivity by targeting Epac1 by use of small molecules, we prepared organotypic brain slice cultures from 11-day-old wild-type C57BL/6 mice. After 7 days of ex vivo culture, treatment of the brain tissue with a novel Epac-specific antagonist developed in our laboratory (33, 34), i.e., ESI-09, led to an enhanced pSTAT3 Y705 level both at the basal state and in response to leptin stimulation. Moreover, Epac-specific inhibitors also increased the cellular level of SHP2 observed in the Epac1−/− mice (Fig. 7A). These pharmacological data are in agreement with the results obtained using Epac1−/− mice shown in Fig. 5 and further confirm that inhibition of Epac1 enhances leptin signaling in the hypothalamus. To further investigate the therapeutic potential of this small molecule, we treated wild-type mice with ESI-09 (50 mg/kg) or vehicle (corn oil) by oral gavage for 3 weeks. Plasma leptin was significantly reduced after ESI-09 treatment relative to vehicle treatment (Fig. 7B).
Fig 7.

Pharmacological inhibition of Epac reduces plasma leptin and enhances leptin signaling in the hypothalamus. (A) Western blotting of pSTAT3 Y705, total STAT3, SOCS3, SHP2, and α-tubulin in organotypic brain slices at the level of the hypothalamus for mice treated with leptin with or without the Epac-specific inhibitor. DMSO, dimethyl sulfoxide. (B) Plasma leptin levels of 8-week-old wild-type mice treated with vehicle or ESI-09 (50 mg/kg) for 3 weeks.
Epac1−/− mice are protected against HFD-induced glucose intolerance.
It has been well documented that enhanced leptin sensitivity confers resistance to HFD-induced obesity and provides improved glucose tolerance (24, 35–37). We therefore compared the glucose-handling capabilities of wild-type and Epac1−/− mice by using the oral glucose tolerance test (OGTT). While similar OGTT results were obtained for wild-type and Epac1−/− mice on the standard chow diet (Fig. 8A), the Epac1−/− mice displayed a markedly enhanced glucose-handling capability after 15 weeks on HFD. First, the fasting glucose levels of HFD-fed Epac1−/− mice were significantly lower than those of wild-type mice; second, Epac1−/− mice cleared glucose from the blood significantly faster than did wild-type mice at every time point after glucose administration. The blood glucose levels of Epac1−/− mice dropped back to baseline in 2 h, while the wild-type blood glucose levels remained elevated (Fig. 8B). In parallel, we also monitored insulin levels after overnight fasting and 15 min after glucose administration. No significant differences were observed between wild-type and Epac1−/− mice on the standard chow diet: both showed similarly low fasting insulin levels that increased to similar extents in response to glucose challenge (Fig. 8C). On the other hand, while HFD-fed Epac−/− mice showed slightly decreased fasting insulin levels, both HFD-fed wild-type and Epac1−/− mice maintained the ability to increase plasma insulin in response to blood glucose concentration elevation (Fig. 8D). These data suggest that Epac1−/− mice are resistant to HFD-induced insulin insensitivity as in the case of the wild-type mice. Taken together, our data show that Epac1−/− mutant mice are largely protected from HFD-induced glucose intolerance and insulin resistance.
Fig 8.

Epac1−/− mice are protected against HFD-induced glucose intolerance. (A) Oral glucose tolerance test results for 18-week-old chow-fed mice. (B) Oral glucose tolerance test results for 18-week-old HFD-fed mice (15 weeks on HFD). (C) Insulin levels after fasting and 15 min after glucose administration (1 g/kg body weight) for chow-fed 18-week-old mice. (D) Insulin levels after fasting and 15 min after glucose administration (1 g/kg body weight) for 18-week-old HFD-fed mice. Data are means ± SEM. #, P < 0.05 compared with wild-type fasting; *, P < 0.05 compared with Epac1−/− fasting.
DISCUSSION
As major intracellular receptors of cAMP, the important roles that Epac proteins play in normal physiological functions and diseases are increasingly being appreciated. The majority of related studies rely on pharmacological activation of Epac by use of the cAMP analog 8-pCPT-2′-O-Me-cAMP or its derivatives to selectively activate Epac. These studies suffer from significant drawbacks due to the direct off-target effects of 8-pCPT-2′-O-Me-cAMP on phosphodiesterases (38). In addition, a series of recent studies demonstrated that 8-CPT-conjugated cAMP analogs and their metabolites can exert diverse biological functions via cAMP-independent mechanisms (39–42). Over the last few years, several studies involving the use of Epac2 or Epac1/2 double knockout mice have been published (43–45). A recent study showed that double knockout of Epac1 and Epac2 in the forebrain of mice disrupts spatial learning and social interactions via upregulation of miR-124 transcription (44). Epac2−/− knockout mice had no significant differences in plasma insulin and blood glucose levels versus wild-type mice in response to a glucose challenge. Furthermore, the insulin response to administration of glucose and sulfonylurea was significantly reduced, with a concomitant increase in blood glucose level, in Epac2−/− mice (43, 45). On the other hand, no detailed analysis of Epac1 knockout mice has been reported.
In this study, we demonstrated that Epac1 plays an essential role in multiple aspects of metabolism in vivo. Epac1−/− mice displayed slower body weight gains on both chow and high-fat diets. The fact that body weights of Epac1−/− mice were not significantly different from those of wild-type mice at birth and for up to 3 weeks of age suggests that the reduced body weights observed for Epac1 null mice are likely not a result of growth retardation due to developmental defects but rather are metabolic in nature. This notion is further supported by the fact that gender- and age-matched wild-type and Epac1−/− mice have identical body lengths. The body weight reduction is due mainly to the reduction of adiposity, as the estimated fat mass reduction observed by CT imaging of the Epac1−/− mice was greater than the total body weight difference. Epac1−/− deficiency also results in smaller epididymal adipocyte size in vivo. Previous studies using 3T3-L1 preadipocytes in vitro suggested that Epac1 is important in regulating adipocyte differentiation (46–48). However, our results using isolated MEF cells ex vivo demonstrate that Epac1 does not play a critical role in adipocyte differentiation. The decreased adiposity observed in Epac1 null mice is most likely due to reduced accumulative food intake, as Epac1 null mice indeed consume less food than their wild-type counterparts. This interpretation is consistent with the fact that there is no indication showing a difference in energy expenditure between Epac1 null and wild-type mice. As shown in Fig. 9, neither the voluntary locomotor activity, expressed as total wheel-running counts, nor the overall circadian rhythm differed significantly between age- and gender-matched wild-type and Epac1−/− mice.
Fig 9.

Epac1−/− and wild-type mice have similar levels of voluntary locomotor activity. (A) Wheel-running activity profiles of wild-type and Epac1−/− mice, presented as a double plot. Each line represents the average 5-day activity for 5 mice. (B) Average wheel-running counts for a 24-h period. Data are means ± SEM.
In line with the fact that Epac1−/− mice have reduced adiposity and are protected from HFD-induced obesity, Epac1−/− mice are also partially protected from the development of hyperleptinemia, as the plasma leptin levels of Epac1−/− mice on chow and HFD were both significantly lower than those of wild-type control mice. The reduced plasma leptin levels in Epac1 null mice were not due simply to reduced adiposity, as studies of 3-week-old mice also showed significantly reduced leptin levels in Epac1 null mice. This suggests that Epac1 is directly linked with leptin production/secretion, as there are no significant differences in body weight and adiposity between wild-type and Epac1 null mice at such a young age. In addition, we also demonstrated that pharmacological inhibition of Epac by an Epac-specific inhibitor leads to a reduction in plasma leptin levels similar to that observed in Epac1 null mice. The ability to recapitulate the genetic phenotype of Epac1 null mice with pharmacological intervention in age- and weight-matched wild-type mice convincingly demonstrates a direct role for Epac1 in regulating leptin levels in vivo. Interestingly, despite the lower plasma leptin level, the leptin signaling activity in the AN as measured by immunostaining of pSTAT3 was enhanced in Epac1−/− mice under steady-state conditions in vivo, which is a sign of a heightened basal level of leptin signaling activity. Moreover, ICV injection of exogenous leptin induced an even more robust nuclear staining of pSTAT3 in the Epac1−/− hypothalamus, which is an indication of enhanced leptin sensitivity. It has been reported that Epac1 activation in vascular endothelial cells upregulates SOCS3, which subsequently suppresses IL-6-mediated STAT3 phosphorylation (28). Therefore, it is possible that the apparent heightened leptin signaling observed in Epac1−/− mice was due to the decrease of SOCS3 in response to the loss of Epac1. However, we were not able to detect significant changes in the level of SOCS3 in hypothalami of Epac1−/− mice. On the other hand, SHP2, another important signaling molecule involved in regulating leptin signaling, was significantly upregulated in Epac1−/− mice. While SHP2 can act as both a positive and a negative regulator of leptin signaling in vitro (49), several in vivo studies using tissue-specific SHP2 null mouse models demonstrated that SHP2 functions as a positive regulator to sensitize leptin signaling in the brain (50–52). Therefore, our study reveals a novel mechanism by which inactivation of Epac1 promotes leptin signaling via upregulation of SHP2. This heightened basal leptin signaling activity and sensitivity were further validated by the more pronounced food intake and body weight reductions of Epac1−/− mice in response to high-dose intraperitoneal leptin injection. It has been well documented that enhanced leptin sensitivity confers resistance to diet-induced obesity and improves glucose tolerance (24, 35–37). Indeed, our studies show that Epac1−/− mice are markedly protected from HFD-induced fasting hyperglycemia and glucose intolerance. Therefore, Epac1 may be a critical intermediate by which HFD causes impaired glucose control.
In summary, we are the first to discover that Epac1 null mutants display decreased leptin production or secretion in peripheral tissues but heightened hypothalamic leptin sensitivity. Furthermore, Epac1 knockout mice are more resistant to high-fat diet-induced obesity, hyperleptinemia, glucose intolerance, and insulin resistance. Previous studies have focused on mechanisms of leptin resistance related to leptin transport or direct modification of the leptin receptor (53–55). Our work demonstrates the relevance of intracellular cAMP to leptin resistance. Specifically, Epac1 appears to blunt leptin signaling, thus decreasing the responsiveness of the leptin receptor and perpetuating a cycle leading to increased body weight. This cycle could theoretically be reversed in obese people by use of an Epac1-specific inhibitor causing increased leptin sensitivity and decreased body fat. Our findings show that a small-molecule Epac-specific inhibitor developed in our lab can reduce plasma leptin levels but enhance leptin signaling in an organotypic brain slice culture system, supporting the notion that Epac1 may be a potential therapeutic target for treatment of obesity or diabetes.
ACKNOWLEDGMENTS
We are in debt to Maki Wakamiya for help and advice on animal breeding and handling and to Ping Wu for access to a confocal microscope. We thank Ron Tilton for providing metabolic cages for the food intake study, Marxa Figueiredo for advice and assistance in isolating adipose stem cells, John Wang for advice and assistance in preparing organotypic brain slices, and Caterina M. Hernandez and Sarah Bullard for assistance in mouse stereotaxic surgery and glucose tolerance experiments. Animal behavior experiments were conducted in the Rodent In Vivo Assessment Core of the Center for Addiction Research at the University of Texas Medical Branch.
This work was supported in part by grants from the National Institutes of Health to Xiaodong Cheng (5R01GM066170), Ju Chen (P01 HL080101 and P01 HL46345), and Kathryn A. Cunningham (K05DA020087), as well as by institutional funds from the Department of Pharmacology and Toxicology and the Center of Addiction Research at the University of Texas Medical Branch.
We declare that we have no competing financial interests.
Footnotes
Published ahead of print 21 December 2012
REFERENCES
- 1. Dixon JB. 2010. The effect of obesity on health outcomes. Mol. Cell. Endocrinol. 316: 104–108 [DOI] [PubMed] [Google Scholar]
- 2. Flegal KM, Carroll MD, Kit BK, Ogden CL. 2012. Prevalence of obesity and trends in the distribution of body mass index among US adults, 1999–2010. JAMA 307: 491–497 doi:10.1001/jama.2012.39 [DOI] [PubMed] [Google Scholar]
- 3. Finucane MM, Stevens GA, Cowan MJ, Danaei G, Lin JK, Paciorek CJ, Singh GM, Gutierrez HR, Lu Y, Bahalim AN, Farzadfar F, Riley LM, Ezzati M. 2011. National, regional, and global trends in body-mass index since 1980: systematic analysis of health examination surveys and epidemiological studies with 960 country-years and 9.1 million participants. Lancet 377: 557–567 doi:10.1016/S0140-6736(10)62037-5 [DOI] [PMC free article] [PubMed] [Google Scholar]
- 4. Bray GA, Ryan DH. 2012. Medical therapy for the patient with obesity. Circulation 125: 1695–1703 doi:10.1161/CIRCULATIONAHA.111.026567 [DOI] [PubMed] [Google Scholar]
- 5. Fried SK, Ricci MR, Russell CD, Laferrere B. 2000. Regulation of leptin production in humans. J. Nutr. 130: 3127S–3131S [DOI] [PubMed] [Google Scholar]
- 6. Li H, Matheny M, Scarpace PJ. 1997. β3-Adrenergic-mediated suppression of leptin gene expression in rats. Am. J. Physiol. 272: E1031–E1036 [DOI] [PubMed] [Google Scholar]
- 7. Ricci MR, Fried SK. 1999. Isoproterenol decreases leptin expression in adipose tissue of obese humans. Obes. Res. 7: 233–240 [DOI] [PubMed] [Google Scholar]
- 8. Cheng X, Ji Z, Tsalkova T, Mei F. 2008. Epac and PKA: a tale of two intracellular cAMP receptors. Acta Biochim. Biophys. Sin. (Shanghai) 40: 651–662 [DOI] [PMC free article] [PubMed] [Google Scholar]
- 9. de Rooij J, Zwartkruis FJ, Verheijen MH, Cool RH, Nijman SM, Wittinghofer A, Bos JL. 1998. Epac is a Rap1 guanine-nucleotide-exchange factor directly activated by cyclic AMP. Nature 396: 474–477 [DOI] [PubMed] [Google Scholar]
- 10. Kawasaki H, Springett GM, Mochizuki N, Toki S, Nakaya M, Matsuda M, Housman DE, Graybiel AM. 1998. A family of cAMP-binding proteins that directly activate Rap1. Science 282: 2275–2279 [DOI] [PubMed] [Google Scholar]
- 11. Enserink JM, Christensen AE, de Rooij J, van Triest M, Schwede F, Genieser HG, Doskeland SO, Blank JL, Bos JL. 2002. A novel Epac-specific cAMP analogue demonstrates independent regulation of Rap1 and ERK. Nat. Cell Biol. 4: 901–906 [DOI] [PubMed] [Google Scholar]
- 12. Fukuda M, Williams KW, Gautron L, Elmquist JK. 2011. Induction of leptin resistance by activation of cAMP-Epac signaling. Cell Metab. 13: 331–339 doi:10.1016/j.cmet.2011.01.016 [DOI] [PMC free article] [PubMed] [Google Scholar]
- 13. O'Gorman S, Dagenais NA, Qian M, Marchuk Y. 1997. Protamine-Cre recombinase transgenes efficiently recombine target sequences in the male germ line of mice, but not in embryonic stem cells. Proc. Natl. Acad. Sci. U. S. A. 94: 14602–14607 [DOI] [PMC free article] [PubMed] [Google Scholar]
- 14. El-Haschimi K, Pierroz DD, Hileman SM, Bjorbaek C, Flier JS. 2000. Two defects contribute to hypothalamic leptin resistance in mice with diet-induced obesity. J. Clin. Invest. 105: 1827–1832 doi:10.1172/JCI9842 [DOI] [PMC free article] [PubMed] [Google Scholar]
- 15. Munzberg H, Huo L, Nillni EA, Hollenberg AN, Bjorbaek C. 2003. Role of signal transducer and activator of transcription 3 in regulation of hypothalamic proopiomelanocortin gene expression by leptin. Endocrinology 144: 2121–2131 [DOI] [PubMed] [Google Scholar]
- 16. Ruiter M, Duffy P, Simasko S, Ritter RC. 2010. Increased hypothalamic signal transducer and activator of transcription 3 phosphorylation after hindbrain leptin injection. Endocrinology 151: 1509–1519 doi:10.1210/en.2009-0854 [DOI] [PMC free article] [PubMed] [Google Scholar]
- 17. Conner DA. 2001. Mouse embryonic stem (ES) cell culture. Curr; Protoc. Mol. Biol. Chapter 23:Unit 23.3: doi:10.1002/0471142727.mb2303s51 [DOI] [PubMed] [Google Scholar]
- 18. Rasouli N, Raue U, Miles LM, Lu T, Di Gregorio GB, Elbein SC, Kern PA. 2005. Pioglitazone improves insulin sensitivity through reduction in muscle lipid and redistribution of lipid into adipose tissue. Am. J. Physiol. Endocrinol. Metab. 288: E930–E934 doi:10.1152/ajpendo.00522.2004 [DOI] [PubMed] [Google Scholar]
- 19. Hillebrand JJ, Langhans W, Geary N. 2010. Validation of computed tomographic estimates of intra-abdominal and subcutaneous adipose tissue in rats and mice. Obesity (Silver Spring) 18: 848–853 doi:10.1038/oby.2009.341 [DOI] [PubMed] [Google Scholar]
- 20. Considine RV, Sinha MK, Heiman ML, Kriauciunas A, Stephens TW, Nyce MR, Ohannesian JP, Marco CC, McKee LJ, Bauer TL. 1996. Serum immunoreactive-leptin concentrations in normal-weight and obese humans. N. Engl. J. Med. 334: 292–295 doi:10.1056/NEJM199602013340503 [DOI] [PubMed] [Google Scholar]
- 21. Friedman JM, Halaas JL. 1998. Leptin and the regulation of body weight in mammals. Nature 395: 763–770 doi:10.1038/27376 [DOI] [PubMed] [Google Scholar]
- 22. Maffei M, Halaas J, Ravussin E, Pratley RE, Lee GH, Zhang Y, Fei H, Kim S, Lallone R, Ranganathan S. 1995. Leptin levels in human and rodent: measurement of plasma leptin and ob RNA in obese and weight-reduced subjects. Nat. Med. 1: 1155–1161 [DOI] [PubMed] [Google Scholar]
- 23. Bates SH, Stearns WH, Dundon TA, Schubert M, Tso AW, Wang Y, Banks AS, Lavery HJ, Haq AK, Maratos-Flier E, Neel BG, Schwartz MW, Myers MG., Jr 2003. STAT3 signalling is required for leptin regulation of energy balance but not reproduction. Nature 421: 856–859 doi:10.1038/nature01388 [DOI] [PubMed] [Google Scholar]
- 24. Kievit P, Howard JK, Badman MK, Balthasar N, Coppari R, Mori H, Lee CE, Elmquist JK, Yoshimura A, Flier JS. 2006. Enhanced leptin sensitivity and improved glucose homeostasis in mice lacking suppressor of cytokine signaling-3 in POMC-expressing cells. Cell Metab. 4: 123–132 doi:10.1016/j.cmet.2006.06.010 [DOI] [PubMed] [Google Scholar]
- 25. Cheung CC, Clifton DK, Steiner RA. 1997. Proopiomelanocortin neurons are direct targets for leptin in the hypothalamus. Endocrinology 138: 4489–4492 [DOI] [PubMed] [Google Scholar]
- 26. Hubschle T, Thom E, Watson A, Roth J, Klaus S, Meyerhof W. 2001. Leptin-induced nuclear translocation of STAT3 immunoreactivity in hypothalamic nuclei involved in body weight regulation. J. Neurosci. 21: 2413–2424 [DOI] [PMC free article] [PubMed] [Google Scholar]
- 27. Schwartz MW, Seeley RJ, Campfield LA, Burn P, Baskin DG. 1996. Identification of targets of leptin action in rat hypothalamus. J. Clin. Invest. 98: 1101–1106 doi:10.1172/JCI118891 [DOI] [PMC free article] [PubMed] [Google Scholar]
- 28. Sands WA, Woolson HD, Milne GR, Rutherford C, Palmer TM. 2006. Exchange protein activated by cyclic AMP (Epac)-mediated induction of suppressor of cytokine signaling 3 (SOCS-3) in vascular endothelial cells. Mol. Cell. Biol. 26: 6333–6346 [DOI] [PMC free article] [PubMed] [Google Scholar]
- 29. Carpenter LR, Farruggella TJ, Symes A, Karow ML, Yancopoulos GD, Stahl N. 1998. Enhancing leptin response by preventing SH2-containing phosphatase 2 interaction with Ob receptor. Proc. Natl. Acad. Sci. U. S. A. 95: 6061–6066 [DOI] [PMC free article] [PubMed] [Google Scholar]
- 30. Heymsfield SB, Greenberg AS, Fujioka K, Dixon RM, Kushner R, Hunt T, Lubina JA, Patane J, Self B, Hunt P, McCamish M. 1999. Recombinant leptin for weight loss in obese and lean adults: a randomized, controlled, dose-escalation trial. JAMA 282: 1568–1575 [DOI] [PubMed] [Google Scholar]
- 31. Ahren B, Baldwin RM, Havel PJ. 2000. Pharmacokinetics of human leptin in mice and rhesus monkeys. Int. J. Obes. Relat. Metab. Disord. 24: 1579–1585 [DOI] [PubMed] [Google Scholar]
- 32. Hill RA, Margetic S, Pegg GG, Gazzola C. 1998. Leptin: its pharmacokinetics and tissue distribution. Int. J. Obes. Relat. Metab. Disord. 22: 765–770 [DOI] [PubMed] [Google Scholar]
- 33. Almahariq M, Tsalkova T, Fang MC, Chen H, Zhou J, Sastry S, Schwede F, Cheng X. 2013. A novel EPAC specific inhibitor suppresses pancreatic cancer cell migration and invasion. Mol. Pharmacol. 83: 122–128 doi:10.1124/mol.112.080689 [DOI] [PMC free article] [PubMed] [Google Scholar]
- 34. Tsalkova T, Mei FC, Li S, Chepurny OG, Leech CA, Liu T, Holz GG, Woods VL, Jr, Cheng X. 2012. Isoform-specific antagonists of exchange proteins directly activated by cAMP. Proc. Natl. Acad. Sci. U. S. A. 109: 18613–18618 doi:10.1073/pnas.1210209109 [DOI] [PMC free article] [PubMed] [Google Scholar]
- 35. Berglund ED, Vianna CR, Donato J, Jr, Kim MH, Chuang JC, Lee CE, Lauzon DA, Lin P, Brule LJ, Scott MM, Coppari R, Elmquist JK. 2012. Direct leptin action on POMC neurons regulates glucose homeostasis and hepatic insulin sensitivity in mice. J. Clin. Invest. 122: 1000–1009 doi:10.1172/JCI59816 [DOI] [PMC free article] [PubMed] [Google Scholar]
- 36. Howard JK, Cave BJ, Oksanen LJ, Tzameli I, Bjorbaek C, Flier JS. 2004. Enhanced leptin sensitivity and attenuation of diet-induced obesity in mice with haploinsufficiency of Socs3. Nat. Med. 10: 734–738 doi:10.1038/nm1072 [DOI] [PubMed] [Google Scholar]
- 37. Mori H, Hanada R, Hanada T, Aki D, Mashima R, Nishinakamura H, Torisu T, Chien KR, Yasukawa H, Yoshimura A. 2004. Socs3 deficiency in the brain elevates leptin sensitivity and confers resistance to diet-induced obesity. Nat. Med. 10: 739–743 doi:10.1038/nm1071 [DOI] [PubMed] [Google Scholar]
- 38. Poppe H, Rybalkin SD, Rehmann H, Hinds TR, Tang XB, Christensen AE, Schwede F, Genieser HG, Bos JL, Doskeland SO, Beavo JA, Butt E. 2008. Cyclic nucleotide analogs as probes of signaling pathways. Nat. Methods 5: 277–278 [DOI] [PubMed] [Google Scholar]
- 39. Enyeart JA, Enyeart JJ. 2009. Metabolites of an Epac-selective cAMP analog induce cortisol synthesis by adrenocortical cells through a cAMP-independent pathway. PLoS One 4: e6088 doi:10.1371/journal.pone.0006088 [DOI] [PMC free article] [PubMed] [Google Scholar]
- 40. Enyeart JA, Liu H, Enyeart JJ. 2010. cAMP analogs and their metabolites enhance TREK-1 mRNA and K+ current expression in adrenocortical cells. Mol. Pharmacol. 77: 469–482 doi:10.1124/mol.109.061861 [DOI] [PMC free article] [PubMed] [Google Scholar]
- 41. Enyeart JA, Liu H, Enyeart JJ. 2011. 8-Phenylthio-adenines stimulate the expression of steroid hydroxylases, Cav3.2 Ca(2) channels, and cortisol synthesis by a cAMP-independent mechanism. Am. J. Physiol. Endocrinol. Metab. 301: E941–E954 doi:10.1152/ajpendo.00282.2011 [DOI] [PMC free article] [PubMed] [Google Scholar]
- 42. Sand C, Grandoch M, Borgermann C, Oude Weernink PA, Mahlke Y, Schwindenhammer B, Weber AA, Fischer JW, Jakobs KH, Schmidt M. 2010. 8-pCPT-conjugated cyclic AMP analogs exert thromboxane receptor antagonistic properties. Thromb. Haemost. 103: 662–678 doi:10.1160/TH09-06-0341 [DOI] [PubMed] [Google Scholar]
- 43. Shibasaki T, Takahashi H, Miki T, Sunaga Y, Matsumura K, Yamanaka M, Zhang C, Tamamoto A, Satoh T, Miyazaki J, Seino S. 2007. Essential role of Epac2/Rap1 signaling in regulation of insulin granule dynamics by cAMP. Proc. Natl. Acad. Sci. U. S. A. 104: 19333–19338 [DOI] [PMC free article] [PubMed] [Google Scholar]
- 44. Yang Y, Shu X, Liu D, Shang Y, Wu Y, Pei L, Xu X, Tian Q, Zhang J, Qian K, Wang YX, Petralia RS, Tu W, Zhu LQ, Wang JZ, Lu Y. 2012. EPAC null mutation impairs learning and social interactions via aberrant regulation of miR-124 and Zif268 translation. Neuron 73: 774–788 doi:10.1016/j.neuron.2012.02.003 [DOI] [PMC free article] [PubMed] [Google Scholar]
- 45. Zhang CL, Katoh M, Shibasaki T, Minami K, Sunaga Y, Takahashi H, Yokoi N, Iwasaki M, Miki T, Seino S. 2009. The cAMP sensor Epac2 is a direct target of antidiabetic sulfonylurea drugs. Science 325: 607–610 [DOI] [PubMed] [Google Scholar]
- 46. Ji Z, Mei FC, Cheng X. 2010. Epac, not PKA catalytic subunit, is required for 3T3-L1 preadipocyte differentiation. Front. Biosci. 2: 392–398 [DOI] [PMC free article] [PubMed] [Google Scholar]
- 47. Martini CN, Plaza MV, Vila MC. 2009. PKA-dependent and independent cAMP signaling in 3T3-L1 fibroblasts differentiation. Mol. Cell. Endocrinol. 298: 42–47 doi:10.1016/j.mce.2008.10.023 [DOI] [PubMed] [Google Scholar]
- 48. Petersen RK, Madsen L, Pedersen LM, Hallenborg P, Hagland H, Viste K, Doskeland SO, Kristiansen K. 2008. Cyclic AMP (cAMP)-mediated stimulation of adipocyte differentiation requires the synergistic action of Epac- and cAMP-dependent protein kinase-dependent processes. Mol. Cell. Biol. 28: 3804–3816 doi:10.1128/MCB.00709-07 [DOI] [PMC free article] [PubMed] [Google Scholar]
- 49. Feng GS. 2006. Shp2 as a therapeutic target for leptin resistance and obesity. Expert Opin. Ther. Targets 10: 135–142 doi:10.1517/14728222.10.1.135 [DOI] [PubMed] [Google Scholar]
- 50. Banno R, Zimmer D, De Jonghe BC, Atienza M, Rak K, Yang W, Bence KK. 2010. PTP1B and SHP2 in POMC neurons reciprocally regulate energy balance in mice. J. Clin. Invest. 120: 720–734 doi:10.1172/JCI39620 [DOI] [PMC free article] [PubMed] [Google Scholar]
- 51. Krajewska M, Banares S, Zhang EE, Huang X, Scadeng M, Jhala US, Feng GS, Krajewski S. 2008. Development of diabesity in mice with neuronal deletion of Shp2 tyrosine phosphatase. Am. J. Pathol. 172: 1312–1324 doi:10.2353/ajpath.2008.070594 [DOI] [PMC free article] [PubMed] [Google Scholar]
- 52. Zhang EE, Chapeau E, Hagihara K, Feng GS. 2004. Neuronal Shp2 tyrosine phosphatase controls energy balance and metabolism. Proc. Natl. Acad. Sci. U. S. A. 101: 16064–16069 doi:10.1073/pnas.0405041101 [DOI] [PMC free article] [PubMed] [Google Scholar]
- 53. Bjorbaek C, Elmquist JK, Frantz JD, Shoelson SE, Flier JS. 1998. Identification of SOCS-3 as a potential mediator of central leptin resistance. Mol. Cell 1: 619–625 [DOI] [PubMed] [Google Scholar]
- 54. Caro JF, Kolaczynski JW, Nyce MR, Ohannesian JP, Opentanova I, Goldman WH, Lynn RB, Zhang PL, Sinha MK, Considine RV. 1996. Decreased cerebrospinal-fluid/serum leptin ratio in obesity: a possible mechanism for leptin resistance. Lancet 348: 159–161 doi:10.1016/S014067369603173X [DOI] [PubMed] [Google Scholar]
- 55. Myers MG, Cowley MA, Munzberg H. 2008. Mechanisms of leptin action and leptin resistance. Annu. Rev. Physiol. 70: 537–556 doi:10.1146/annurev.physiol.70.113006.100707 [DOI] [PubMed] [Google Scholar]