Abstract
Interferon-gamma (IFNγ) plays a key role in macrophage activation, T helper and regulatory cell differentiation, defense against intracellular pathogens, tissue remodeling, and tumor surveillance. The diverse biological functions of IFNγ are mediated by direct activation of signal transducer and activator of transcription 1 (STAT1) as well as numerous downstream effector genes. Because a perturbation in STAT1 target gene networks is closely associated with development of autoimmune diseases and cancers, it is important to characterize the global picture of these networks. Chromatin immunoprecipitation followed by deep sequencing (ChIP-Seq) provides a highly efficient method for genome-wide profiling of DNA-binding proteins. We analyzed the STAT1 ChIP-Seq dataset of IFNγ-stimulated HeLa S3 cells derived from the ENCODE project, along with transcriptome analysis on microarray. We identified 1,441 stringent ChIP-Seq peaks of protein-coding genes. They were located in the promoter (21.5%) and more often in intronic regions (72.2%) with an existence of IFNγ-activated site (GAS) elements. Among the 1,441 STAT1 target genes, 212 genes are known IFN-regulated genes (IRGs) and 194 genes (13.5%) are actually upregulated in response to IFNγ by transcriptome analysis. The panel of upregulated genes constituted IFN-signaling molecular networks pivotal for host defense against infections, where interferon-regulatory factor (IRF) and STAT transcription factors serve as a hub on which biologically important molecular connections concentrate. The genes with the peak location in intronic regions showed significantly lower expression levels in response to IFNγ. These results indicate that the binding of STAT1 to GAS is not sufficient to fully activate target genes, suggesting the high complexity of STAT1-mediated gene regulatory mechanisms.
Keywords: binding sites, ChIP-seq, GenomeJack, interferon-gamma, STAT1
Introduction
Interferons (IFNs) constitute a group of cytokines with antiviral, antiproliferative, and immunomodulatory effects on diverse cell types.1 The IFN family proteins are classified into two major groups: type I IFNs, composed of various IFNα subtypes, IFNβ, IFNδ, IFNɛ, IFNκ, IFNτ, and IFNω, and type II IFNs, composed solely of IFNγ. Type I IFNs interact with the IFNα/β receptor (IFNAR) subunits composed of IFNAR1 and IFNAR2 associated with tyrosine kinase 2 (TYK2) and Janus kinase 1 (JAK1), while IFNγ binds to the IFNγ receptor (IFNGR) receptor subunits composed of IFNGR1 and IFNGR2 associated with JAK1 and JAK2.
The ligand-dependent dimerization of the receptor subunits rapidly activates the associated JAKs by autophosphorylation, which provide docking sites for signal transducer and activator of transcription (STAT) proteins. Type I IFNs phosphorylate the C-terminal tyrosine residues Y701 in STAT1 and Y690 in STAT2 via TYK2 and JAK1, leading to the formation of the IFN-stimulated gene factor 3 (ISGF3) complex, composed of STAT1, STAT2, and interferon regulatory factor 9 (IRF9). After nuclear translocation, ISGF3 binds to IFN-stimulated response elements (ISREs) on target genes. Type II IFN, along with type I IFNs, induces the formation and nuclear translocation of STAT1-STAT1 homodimer that binds to IFNγ-activated site (GAS) elements on target genes. Thus, IFNs induce the expression of hundreds of IFN-regulated genes (IRGs) via the JAK-STAT pathway.2 Some of IRGs are regulated by both types of IFNs, whereas others are selectively induced by distinct IFNs through drastic changes in genomic binding locations in a manner dependent on the combinational involvement of STAT1 and STAT2.3
IFNγ plays a key role in a wide range of immune responses, such as macrophage activation, T helper and regulatory cell differentiation, defense against intracellular pathogens, tissue remodeling, and tumor surveillance.4 The diverse biological functions of IFNγ are mediated by direct activation of STAT1 and downstream effector genes that encode cytokines, chemokines, phagocytotic receptors, antiviral proteins, antigen-presenting molecules, and microbicidal molecules. STAT1 knockout mice exhibit severe defects in biological responses to both types of IFNs.5 In the human STAT1 gene, loss-of-function mutations enhance susceptibility to mycobacterial and viral infections, while gain-of-function mutations causes chronic mucocutaneous candidiasis attributable to impaired development and function of Th17 cells.6 Increasing numbers of genome-wide association studies (GWAS) showed that common disease-associated variants are enriched in the recognition sequences of transcription factors, and deregulated activation of STAT1, by perturbing the regulatory network shared by core transcription factors, is closely associated with development of autoimmune diseases and cancers.7 Therefore, it is highly important to characterize the global picture of STAT1 target gene networks.
Recently, the rapid progress in the next-generation sequencing (NGS) technology has revolutionized the field of genome research. As a NGS application, chromatin immunoprecipitation followed by deep sequencing (ChIP-Seq) provides a highly efficient method for genome-wide profiling of DNA-binding proteins, histone modifications, and nucleosomes.8 ChIP-Seq has the advantages of higher resolution, less noise, and greater coverage of the genome, compared with the microarray-based ChIP-Chip method, and serves as an innovative tool for studying the comprehensive gene regulatory networks.9 Since the NGS analysis produces extremely high-throughput experimental data, it is often difficult to extract the meaningful biological implications. Recent advances in systems biology enable us to illustrate the cell-wide map of the complex molecular interactions by using the literature-based knowledgebase of molecular pathways.10 The logically arranged molecular networks make up the whole system characterized by robustness, which maintains the proper function of the system in the face of genetic and environmental perturbations. Therefore, the integration of high dimensional NGS data with underlying molecular networks offers a rational approach to characterize the network-based molecular mechanisms of gene regulation in the whole genome scale.
To study the global picture of STAT1 target gene network, we analyzed the STAT1 ChIP-Seq dataset of the Encyclopedia of DNA Elements (ENCODE) project,11 derived from IFNγ-stimulated HeLa S3 cells, along with our original transcriptome study on microarray. Overall, we identified 1,441 stringent ChIP-Seq peaks of protein-coding genes. Surprisingly, only a small set of ChIP-Seq-based STAT1 target genes are actually upregulated in response to IFNγ, suggesting the complexity of STAT1-mediated gene regulatory mechanisms.
Methods
ChIP-seq dataset of STAT1-binding sites
To extract a comprehensive set of STAT1-target genes, we investigated a ChIP-Seq dataset retrieved from DDBJ Sequence Read Archive (DRA) under the accession number of SRP000703. We utilized the dataset of the ENCODE project (encodeproject. org/ENCODE) derived from the experiments, in which HeLa S3 cells were exposed for 30 minutes to 50 ng/mL recombinant human IFNγ (R & D systems). They were processed for ChIP with a rabbit anti-STAT1 alpha p91 antibody (sc-345; Santa Cruz Biotechnology). NGS libraries constructed from ChIP DNA fragments and from input DNA samples were processed for deep sequencing on Genome Analyzer II (Illumina).
We evaluated the quality of short reads by searching them on the FastQC program (www.bioinformatics.babraham.ac.uk/projects/fastqc). We considered the quality score greater than 30 in per base sequence quality as sufficient quality. We mapped them on the human genome reference sequence hg19 by using Bowtie 0.12.7 (bowtie-bio.sourceforge.net). Then we detected statistically significant peaks of mapped reads by using the MACS program (liulab.dfci.harvard.edu/MACS) under the highly stringent condition that satisfies fold enrichment ≥20 and the false discovery rate (FDR) ≤1%, according to the methods described previously.12 Next, we identified genomic locations of MACS peaks by importing the processed data into GenomeJack v1.3, a novel genome viewer for NGS platforms developed by Mitsubishi Space Software (www.mss.co.jp/businessfield/bioinformatics). Based on RefSeq ID, MACS peaks were categorized into the following: the peaks located on protein-coding genes with NM-heading numbers, the peaks located on non-coding genes with NR-heading numbers, and the peaks located in intergenic regions with no relevant neighboring genes. The genomic locations of the peaks were further classified into the following: the promoter region defined by the location within a 5 kb upstream from the 5′ end of genes, the 5′ untranslated region (5′ UTR), the exon, the intron, and the 3′UTR. The locations outside these were defined as intergenic regions.
The consensus motif sequences were identified by importing a 400 bp-length sequence surrounding the summit of MACS peaks into the MEME-ChIP program (meme.sdsc.edu/meme/cgi-bin/meme-chip.cgi).13 The information of IFN-regulated genes (IRGs) was extracted from Interferome (www.interferome.org/index.php), the most comprehensive database that collects type I, II and III IRGs manually curated from more than 28 publicly available microarray datasets.14
Microarray analysis
HeLa cells were maintained in Dulbecco’s Modified Eagle’s medium (DMEM; Invitrogen) supplemented with 10% fetal bovine serum (FBS), 100 U/mL penicillin, and 100 μg/mL streptomycin (feeding medium). They were incubated for 6 hours with or without inclusion of 50 ng/mL human recombinant IFNγ (Pepro- Tech) in the medium. Total cellular RNA was then isolated by using the TRIZOL Plus RNA Purification kit (Invitrogen). The quality of total RNA was evaluated on Agilent 2100 Bioanalyzer (Agilent Technologies). Three hundred ng of total RNA was processed for cRNA synthesis, fragmentation, and terminal labeling with the GeneChip Whole Transcript Sense Target Labeling and Control Reagents (Affymetrix). The labeled cRNA was then processed for hybridization at 45 °C for 17 hours with Human Gene 1.0 ST Array (28,869 genes; Affymetrix). The arrays were washed in the GeneChip Fluidic Station 450 (Affymetrix), and scanned by the GeneChip Scanner 3000 7G (Affymetrix). The raw data was expressed as CEL files and normalized by the robust multiarray average (RMA) method with the Expression Console software (Affymetrix).
To investigate possible differences in gene expression profiles among different sources and concentrations of IFNγ on distinct microarray platforms, we also retrieved the transcriptome data of HeLa cells treated for 6 hours with 100 U/mL recombinant human IFNγ (Roche) from Gene Expression Omnibus (GEO) under the accession number of GSE21760 for comparison. In their experiments, the data analyzed on Human Genome U133 Plus 2.0 Array (38,500 genes; Affymetrix) were normalized by the GCRMA method. We considered the genes exhibiting ≥2-fold change as upregulation and those exhibiting ≤0.5- fold change as downregulation when compared with the signal intensities of untreated cells.
Molecular network analysis
To identify biologically relevant molecular networks and pathways, we imported Entrez Gene IDs of STAT1 target genes into the Functional Annotation tool of Database for Annotation, Visualization and Integrated Discovery (DAVID) v6.7 (david.abcc.ncifcrf.gov).15 DAVID identifies the most relevant pathway constructed by Kyoto Encyclopedia of Genes and Genomes (KEGG), composed of the genes enriched in the given set with an output of statistical significance evaluated by the modified Fisher’s exact test. KEGG (www.kegg.jp) is a publicly accessible knowledgebase containing manually curated reference pathways that cover a wide range of metabolic, genetic, environmental, and cellular processes as well as human diseases. It is currently composed of 224,601 pathways generated from 436 reference pathways. We also imported Entrez Gene IDs into Ingenuity Pathways Analysis (IPA) (Ingenuity Systems, Redwood City, CA, USA; www.ingenuity.com) and KeyMolnet (Institute of Medicinal Molecular Design, Tokyo, Japan; www.immd.co.jp), both of which are provided as a commercial tool for molecular network analysis.
IPA is a knowledgebase that contains approximately 2,500,000 biological and chemical interactions and functional annotations with definite scientific evidence. By uploading the list of Gene IDs and expression values, the network-generation algorithm identifies focused genes integrated in a global molecular network. IPA calculates the score P-value that reflects the statistical significance of association between the genes and the networks by the Fisher’s exact test.
KeyMolnet contains knowledge-based contents on 150,500 relationships among human genes and proteins, small molecules, diseases, pathways, and drugs.16 They are categorized into the core contents collected from selected review articles with the highest reliability or the secondary contents extracted from abstracts of PubMed and Human Reference Protein database (HPRD). By importing the list of Gene ID and expression values, KeyMolnet automatically provides corresponding molecules as a node on networks. The neighboring network-search algorithm selected one or more molecules as starting points to generate a network of all kinds of molecular interactions around starting molecules, including direct activation/ inactivation, transcriptional activation/repression, and the complex formation within the designated number of paths from starting points. The generated network was compared side by side with 484 human canonical pathways of the KeyMolnet library. The algorithm counting the number of overlapping molecular relations between the extracted network and the canonical pathway makes it possible to identify the canonical pathway showing the most significant contribution to the extracted network.
Results
Identification of 1,441 ChIP-Seq-based STAT1 target genes
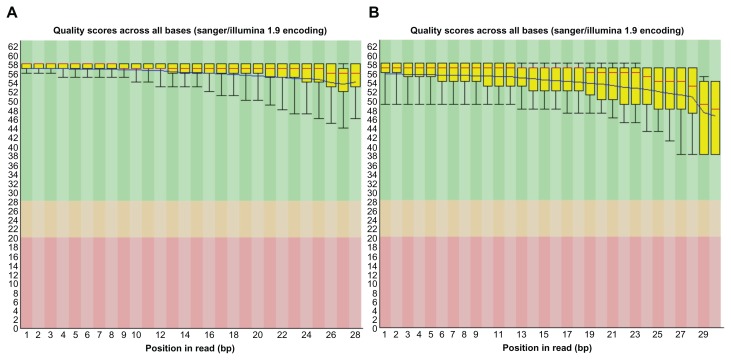
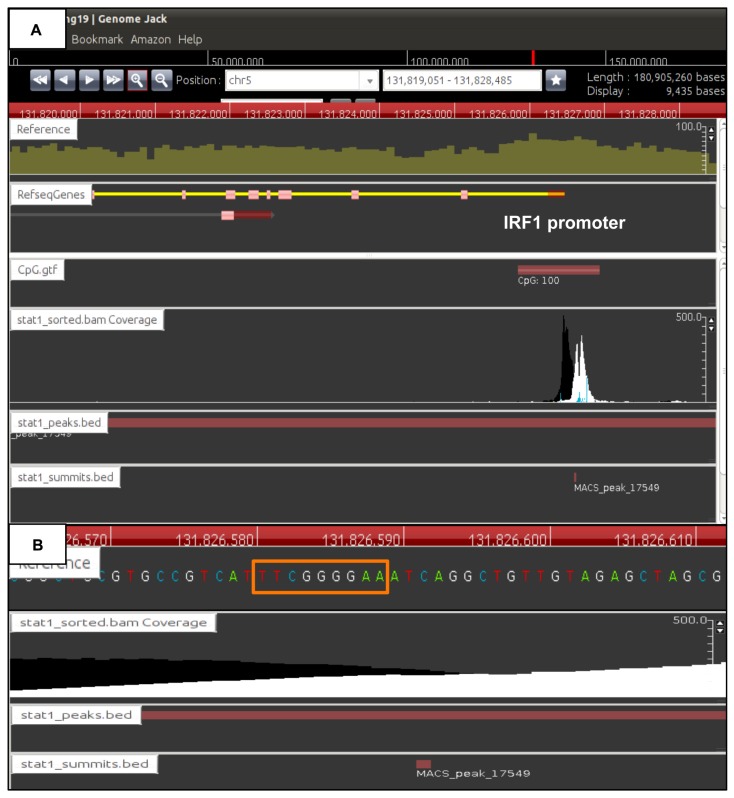
We first evaluated the quality of short read NGS data of STAT1-ChIP-treated DNA and input DNA. The quality scores across all bases exceeded 30 on FastQC, indicating that these data are acceptable for downstream analysis (Fig. 1, Panels A and B). After mapping them on hg19, we identified totally 3,744 stringent ChIP-Seq peaks that meet the criteria of fold enrichment ≥20 and FDR ≤1%. The genomic locations of the peaks were determined by using GenomeJack (Fig. 2, Panels A and B). We omitted the peaks located in non-coding genes (n = 157), those in intergenic regions (n = 1917), and redundant genes. Finally, we identified 1,441 ChIP-Seq peaks of protein-coding genes. The summits of the peaks were located in the promoter (n = 310; 21.5%), 5′UTR (n = 48; 3.3%), exon (n = 22; 1.5%), intron (n = 1,041; 72.2%), or 3′UTR (n = 20; 1.4%). The comprehensive list of 1,441 genes is shown inSupplementary Table 1. Top 20 significant genes based on fold enrichment are shown in Table 1.
Figure 1.
FastQC analysis of ChIP-Seq data. FASTQ format files are derived from short read NGS data of STAT1-ChIP-treated DNA (Panel A) and input DNA (Panel B).
Notes: They were imported into the FastQC program. The per base sequence quality score is shown with the median (red line), the mean (blue line), and the interquatile range (yellow box).
Figure 2.
Identification of genomic locations of ChIP-Seq peaks by GenomeJack. By analyzing the ChIP-Seq dataset of STAT1-binding sites, we identified totally 3,744 stringent peaks showing fold enrichment ≥20 and FDR ≤1%. The genomic locations of the peaks were determined by importing the processed data into GenomeJack. An example of interferon-regulatory factor 1 (IRF1) (yellow line) listed in Table 2 is shown, where a MACS peak in the stat1_sorted.bam Coverage lane is located in the promoter region of IRF1 (Panel A) with a GAS element highlighted by an orange square (Panel B).
Table 1.
Top 20 significant genes based on fold enrichment in ChIP-Seq data.
| Chromosome | Start | End | FE | FDR (%) | Location | Entrez gene ID | Gene symbol | IRG | Gene ST1.0 Array FC | U133 Plus 2.0 Array FC | Gene name |
|---|---|---|---|---|---|---|---|---|---|---|---|
| chr1 | 159046093 | 159048290 | 349.81 | 0.39 | Promoter | 9447 | AIM2 | Yes | 1.49 | 4.26 | Absent in melanoma 2 |
| chr18 | 42304771 | 42306267 | 218.62 | 0.39 | Intron | 26040 | SETBP1 | 1.23 | 0.67 | SET binding protein 1 | |
| chr1 | 89738814 | 89742202 | 216 | 0.39 | Promoter | 115362 | GBP5 | Yes | 19.14 | 8.33 | Guanylate binding protein 5 |
| chr14 | 103893373 | 103894934 | 207.63 | 0.39 | Intron | 4140 | MARK3 | 0.98 | 1.27 | MAP/microtubule affinity-regulating kinase 3 | |
| chr22 | 36653881 | 36655602 | 201.52 | 0.39 | Intron | 8542 | APOL1 | Yes | 5.51 | 2.54 | Apolipoprotein L, 1 |
| chr15 | 101136222 | 101138145 | 200.76 | 0.39 | Intron | 55180 | LINS | 1.6 | 1.37 | Lines homolog (Drosophila) | |
| chr4 | 170486989 | 170488616 | 197.65 | 0.39 | Intron | 4750 | NEK1 | 0.96 | 1.36 | NIMA (never in mitosis gene a)-related kinase 1 | |
| chr14 | 24981772 | 24983259 | 186.08 | 0.39 | Promoter | 1215 | CMA1 | 1 | 1.08 | Chymase 1, mast cell | |
| chr1 | 243602656 | 243604716 | 181.84 | 0.39 | Intron | 10806 | SDCCAG8 | 1.02 | 1.58 | Serologically defined colon cancer antigen 8 | |
| chr11 | 76621502 | 76622964 | 179.28 | 0.39 | Intron | 55331 | ACER3 | 1.07 | 1.27 | Alkaline ceramidase 3 | |
| chr4 | 113217720 | 113220103 | 178.46 | 0.39 | Promoter | 80216 | ALPK1 | Yes | 2.99 | 2.47 | Alpha-kinase 1 |
| chr7 | 143411541 | 143413217 | 172.08 | 0.39 | Intron | 285966 | FAM115C | 1.63 | 1.3 | Family with sequence similarity 115, member C | |
| chr16 | 48264820 | 48266548 | 171.26 | 0.39 | 5′UTR | 85320 | ABCC11 | 0.97 | 1.42 | ATP-binding cassette, sub-family C (CFTR/ MRP), member 11 | |
| chr15 | 57027345 | 57031166 | 170.16 | 0.39 | Promoter | 54816 | ZNF280D | 1.15 | 1.24 | Zinc finger protein 280D | |
| chrX | 104941773 | 104943192 | 168.58 | 0.39 | Intron | 26280 | IL1RAPL2 | 0.9 | 1.01 | Interleukin 1 receptor accessory protein-like 2 | |
| chrX | 11527367 | 11528830 | 160.49 | 0.39 | Intron | 395 | ARHGAP6 | 1.22 | 1.22 | Rho GTPase activating protein 6 | |
| chr2 | 134083039 | 134085251 | 160 | 0.39 | Intron | 344148 | NCKAP5 | 1.38 | 0.34 | Nck-associated protein 5 | |
| chr6 | 31949161 | 31950466 | 158.61 | 0.39 | Promoter | 720 | C4A | 4.59 | 7.27 | Complement component 4A (Rodgers blood group) | |
| chr11 | 86152542 | 86154846 | 158.29 | 0.39 | Intron | 10873 | ME3 | 1.04 | 2.12 | Malic enzyme 3, NADP(+)-dependent, mitochondrial | |
| chr1 | 196407167 | 196408295 | 155.99 | 0.39 | Intron | 343450 | KCNT2 | 1.43 | 1.14 | Potassium channel, subfamily T, member 2 |
Notes: By analyzing the dataset SRP000703, we identified 1,441 stringent peaks of protein-coding genes exhibiting fold enrichment (FE) ≥20 and the false discovery rate (FDR) ≤1%. Top 20 significant genes based on FE are listed with the chromosome, the position (start, end), FE, FDR, the location (promoter, 5′UTR, exon, intron, 3′UTR), Entrez Gene ID, Gene Symbol, IFN-regulated genes (IRGs) on Interferome, transcriptome data presenting with fold change (FC) on Human Gene 1.0 ST Array (our experiments), FC on Human Genome U133 Plus 2.0 Array (GSE21760), and gene name.
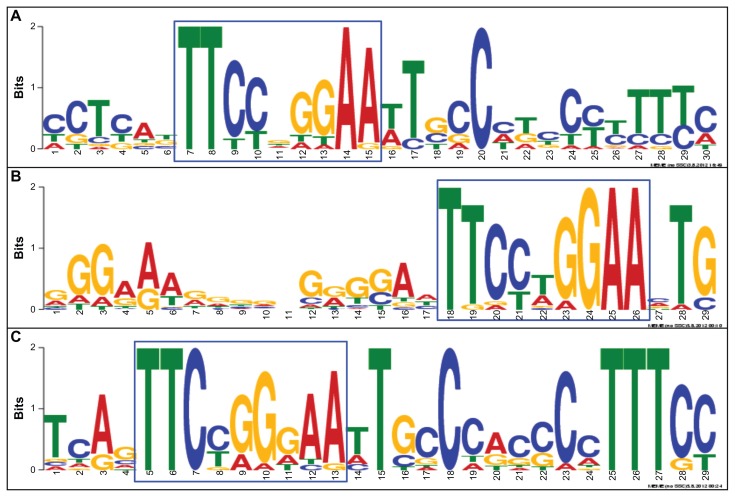
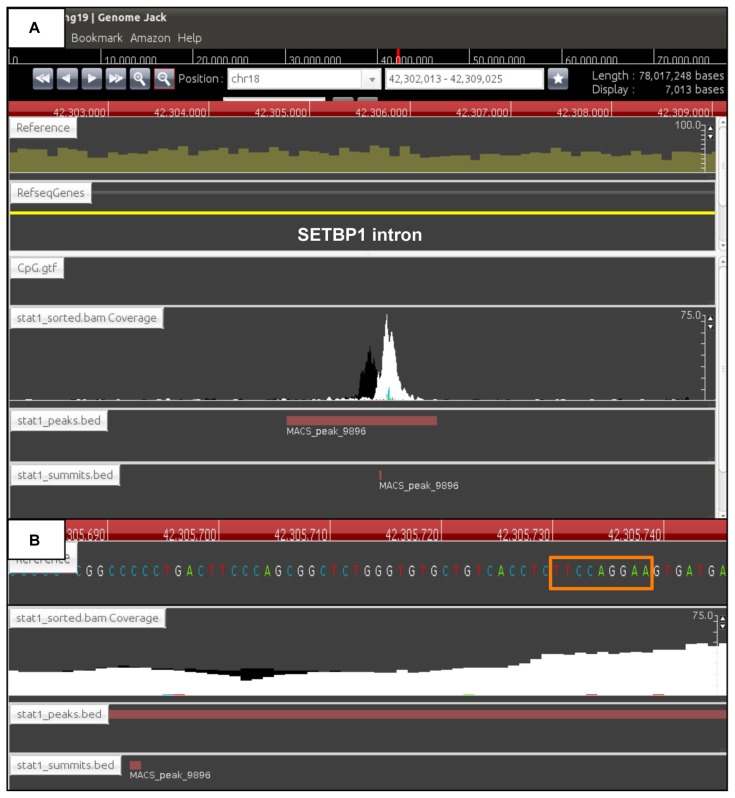
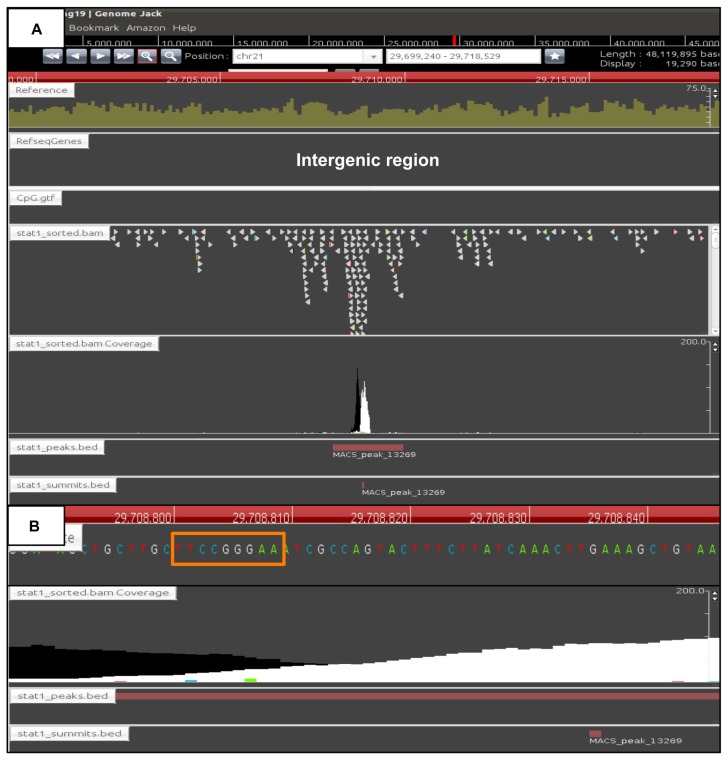
Among 1,441 STAT1 target genes, 212 genes (14.7%) were categorized into IFN-regulated genes (IRGs) on Interferome. By motif analysis with MEME-ChIP, the genes with top 20 fold enrichment scores exhibited an existence of the GAS element comprising TTCCNGGAA (Fig. 3, Panels A–C), irrespective of the location of the peaks in the promoter or the intron, and even in intergenic regions (Fig. 4, Panels A and B; Fig. 5, Panels A and B). These results validated the specific mapping of ChIP-Seq short reads to the genomic regions of the GAS consensus sequence motif.
Figure 3.
Identification of GAS consensus sequences in the promoter, intron, and intergenic regions. The consensus motif sequences were identified by importing a 400 bp-length sequence surrounding the summit of MACS peaks of the genes with top 20 fold enrichment scores into the MEME-ChIP program. The GAS elements located in the promoter (A), intron (B), and intergenic regions (C) are highlighted by an blue square.
Figure 4.
Identification of ChIP-Seq peaks in intronic regions. The genomic locations of the ChIP-Seq peaks were determined by importing the processed data into GenomeJack. An example of SET binding protein 1 (SETBP1) (yellow line) listed in Table 1 is shown, where a MACS peak in the stat1_sorted.bam Coverage lane is located in the intronic region of SETBP1 (Panel A) with a GAS element highlighted by an orange square (Panel B).
Figure 5.
Identification of ChIP-Seq peaks in intergenic regions. The genomic locations of the ChIP-Seq peaks were determined by importing the processed data into GenomeJack. A MACS peak in the stat1_sorted.bam Coverage lane with fold enrichment of 333 and FDR of 0.39% is located in the intergenic region of chromosome 21 (Panel A) with a GAS element highlighted by an orange square (Panel B).
A small set of STAT1 target genes were transcriptionally activated by IFNγ
In general, the STAT1 homodimer serves as a transcriptional activator of numerous IRGs.1 To determine whether ChIP-Seq-based STAT1 target genes are actually upregulated by IFNγ, we studied the genome-wide gene expression profile of HeLa cells exposed for 6 hours to IFNγ on Human Gene 1.0 ST Array. Among top 20 upregulated genes based on fold change, 16 genes (80%) were categorized into IRGs on Interferome (Table 2), supporting the validity of the experimental protocol. We also compared our results with publicly available transcriptome data of IFNγ-treated HeLa cells on Human Genome U133 Plus 2.0 Array numbered GSE21760. Overall, two distinct microarray data showed a trend toward concordant regulation in individual STAT1 target genes (Supplementary Table 1). Therefore, we identified upregulated or downregulated genes at least in one of these studies.
Table 2.
Top 20 upregulated genes based on fold change in transcriptome data.
| Chromosome | Start | End | FE | FDR (%) | Location | Entrez gene ID | Gene symbol | IRG | Gene ST1.0 Array FC | U133 Plus 2.0 Array FC | Gene name |
|---|---|---|---|---|---|---|---|---|---|---|---|
| chr8 | 39767141 | 39768199 | 38.82 | 0.39 | Promoter | 3620 | IDO1 | Yes | 149.57 | 43.92 | Indoleamine 2,3- dioxygenase 1 |
| chr4 | 76949148 | 76950321 | 27.42 | 0.54 | Promoter | 3627 | CXCL10 | Yes | 117.22 | 1.1 | Chemokine (C-X-C motif) ligand 10 |
| chr5 | 131818750 | 131828691 | 53.98 | 0.39 | Promoter | 3659 | IRF1 | Yes | 19.81 | 21.09 | Interferon regulatory factor 1 |
| chr1 | 89738814 | 89742202 | 216 | 0.39 | Promoter | 115362 | GBP5 | Yes | 19.14 | 8.33 | Guanylate binding protein 5 |
| chr5 | 156649035 | 156650353 | 53.67 | 0.44 | Intron | 3702 | ITK | Yes | 16.37 | 93.96 | IL2-inducible T-cell kinase |
| chr19 | 10379656 | 10384589 | 66.15 | 0.39 | 5′UTR | 3383 | ICAM1 | Yes | 13.83 | 11.42 | Intercellular adhesion molecule 1 |
| chr22 | 36042373 | 36045743 | 59.61 | 0.39 | 5′UTR | 80830 | APOL6 | 10.82 | 35.4 | Apolipoprotein L, 6 | |
| chr7 | 134832148 | 134833386 | 67.12 | 0.3 | 5′UTR | 55281 | TMEM140 | Yes | 9.8 | 2.86 | Transmembrane protein 140 |
| chr3 | 122281432 | 122284479 | 82.92 | 0.39 | Intron | 83666 | PARP9 | 8.96 | 14.73 | Poly (ADP-ribose) polymerase family, member 9 | |
| chr1 | 89594075 | 89595527 | 24.35 | 0.62 | Promoter | 2634 | GBP2 | Yes | 8.2 | 7.18 | Guanylate binding protein 2, interferon-inducible |
| chr1 | 150736054 | 150738936 | 40.22 | 0.36 | Intron | 1520 | CTSS | Yes | 7.07 | 13.79 | Cathepsin S |
| chr4 | 76928268 | 76929257 | 29.17 | 0.48 | Promoter | 4283 | CXCL9 | Yes | 6.68 | 1.27 | Chemokine (C-X-C motif) ligand 9 |
| chr11 | 4413853 | 4415591 | 39.26 | 0.39 | 5′UTR | 6737 | TRIM21 | Yes | 6.31 | 5.24 | Tripartite motif-containing 21 |
| chr1 | 89535324 | 89536653 | 40.25 | 0.5 | Promoter | 2633 | GBP1 | Yes | 6.03 | 12.65 | Guanylate binding protein 1, interferon-inducible, 67 kDa |
| chr17 | 32581480 | 32582732 | 45.48 | 0.47 | Promoter | 6347 | CCL2 | Yes | 5.84 | 0.28 | Chemokine (C-C motif) ligand 2 |
| chr3 | 122281432 | 122284479 | 82.92 | 0.39 | Promoter | 151636 | DTX3L | Yes | 5.77 | 7.12 | Deltex 3-like (Drosophila) |
| chr6 | 32819471 | 32822798 | 46.79 | 0.39 | Promoter | 5698 | PSMB9 | 5.77 | 31.71 | Proteasome (prosome, macropain) subunit, beta type, 9 (large multifunctional peptidase 2) | |
| chr18 | 52612923 | 52614118 | 41.03 | 0.4 | Intron | 80323 | CCDC68 | 5.61 | 5.28 | Coiled-coil domain containing 68 | |
| chr22 | 36653881 | 36655602 | 201.52 | 0.39 | Intron | 8542 | APOL1 | Yes | 5.51 | 2.54 | Apolipoprotein L, 1 |
| chr9 | 5509442 | 5510324 | 28.26 | 0.47 | Intron | 80380 | PDCD1LG2 | 5.28 | 1.67 | Programmed cell death 1 ligand 2 |
Notes: By analyzing the dataset SRP000703, we identified 1,441 stringent peaks of protein-coding genes exhibiting fold enrichment (FE) ≥ 20 and the false discovery rate (FDR) ≤1%. Top 20 upregulated genes based on fold change (FC) in transcriptome data on Human Gene 1.0 ST array (our experiments) are listed with the position (start, end), FE, FDR, the location (promoter, 5′UTR, exon, intron, 3′UTR), Entrez Gene ID, Gene Symbol, IFN-regulated genes (IRGs) on Interferome, FC on Human Gene 1.0 ST Array, FC on Human Genome U133 Plus 2.0 Array (GSE21760), and Gene name.
Among 1,441 STAT1 target genes, a set of 194 genes (13.5%) that contained 70 IRGs were upregulated by IFNγ, while 42 genes (2.9%) were downregulated, suggesting that ChIP-Seq-based STAT1 target genes are not always followed by transcriptional activation by IFNγ. Thus, approximately 85% of ChIP-Seq-based STAT1 targets are poorly responsive to IFNγ in terms of expression levels on microarray.
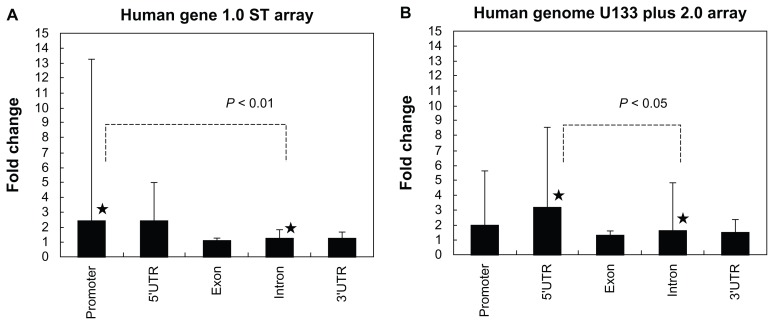
Among 1,441 genes, the genes with the location of ChIP-Seq peaks in intronic regions showed significantly lower expression levels in response to IFNγ, compared to those with the location of peaks in the promoter or in the 5′UTR, regardless of the great variation in expression levels (Fig. 6, Panels A and B). These results suggest that the binding of STAT to the region corresponding to intronic ChIP-Seq peaks could less effectively activate target gene expression.
Figure 6.
The expression levels of 1,441 STAT1 target genes with distinct genomic locations of ChIP-Seq peaks. To determine whether ChIP-Seq-based STAT1 target genes are actually upregulated by IFNγ, we studied the gene expression profile of HeLa cells exposed for 6 hours to IFNγ on Human Gene 1.0 ST Array (Panel A), compared with publicly available transcriptome data GSE21760 of HeLa cells exposed for 6 hours to IFNγ on Human Genome U133 Plus 2.0 Array (Panel B). The location of ChIP-Seq peaks on 1,441 STAT1 target genes was classified into the promoter, 5′UTR, exon, intron, and 3′UTR. The fold change in expression levels is shown with the average, standard deviation, and statistical significance evaluated by one-way analysis of variance (ANOVA) followed by post-hoc Tukey’s test.
Molecular networks of ChIP-Seq-based STAT1 target genes
Finally, we studied the molecular network of the set of 194 upregulated genes by pathway analysis tools of bioinformatics. By using DAVID, we identified functionally associated gene ontology (GO) terms (Table 3). They include “immune response” (GO:0006955; P = 1.09E-07), “positive regulation of immune system process” (GO:000268; P = 7.54E-07), “response to wounding” (GO:0009611; P = 3.64E-06), and “response to virus” (GO:0009615; P = 4.06E-05), all of which represent key biological functions of IFNγ. They showed the closest association with chemokine signaling pathway (hsa04062; P = 0.0059, FDR = 6.29) on KEGG.
Table 3.
Top 10 gene ontology terms associated with 194 upregulated STAT1 target genes.
| Rank | GO terms | Focused genes | P-value | FDR |
|---|---|---|---|---|
| 1 | GO:0006955~immune response | AIM2, APOL1, C1S, C3, C4A, CCL2, CIITA, CTSS, CXCL10, CXCL9, GBP1, GBP2, GBP5, GCH1, HLA-E, ICAM1, IFI35, IL7, IL4R, LYN, ORAI1, PDCD1LG2, PSMB8, PSMB9, RNF19B, TAP1, TAP2 | 1.09E-07 | 0.0002 |
| 2 | GO:0002684~positive regulation of immune system process | BCL6, C1S, C3, C4A, F2RL1, FYN, ICAM1, IDO1, IL4R, IL7, LYN, PDCD1LG2, PVR, TAP2, TGFB2 | 7.54E-07 | 0.0013 |
| 3 | GO:0009611~response to wounding | A2M, APOL3, C1S, C3, C4A, CCL2, CIITA, CXCL10, CXCL9, F2RL1, IDO1, IRF7, KLF6, LYN, NMI, PLSCR1, PLSCR4, SCARB1, SLC1A3, SOD2, TGFB2 | 3.64E-06 | 0.0061 |
| 4 | GO:0009615~response to virus | IFI16, IFI35, IRF7, IRF9, MX1, PLSCR1, STAT1, STAT2, ZC3HAV1 | 4.06E-05 | 0.0683 |
| 5 | GO:0048584~positive regulation of response to stimulus | C1S, C3, C4A, F2RL1, FYN, IDO1, IRF7, LYN, PVR, TAP2, TGFB2, TGM2 | 1.02E-04 | 0.1717 |
| 6 | GO:0000267~cell fraction | ABCC4, ANK3, BCL2L11, CALD1, CASP7, CYP1B1, DMD, DTNA, GCH1, IDO1, LYN, MCTP1, NRP2, PML, PSD3, RDH10, SCARB1, SH3KBP1, SLC16A1, SLC1A3, SLC7A2, SOD2, TAP1, TAP2, TRIM27, WARS | 1.18E-04 | 0.1503 |
| 7 | GO:0051272~positive regulation of cell motion | BCL6, CSF1, CXCL10, F2RL1, ICAM1, LYN, SCARB1 | 1.47E-04 | 0.2479 |
| 8 | GO:0048534~hemopoietic or lymphoid organ development | BAK1, BCL2L11, BCL6, CSF1, IFI16, IL7, IRF1, KLF6, LYN, PML, SOD2, TGFB2 | 2.38E-04 | 0.4005 |
| 9 | GO:0050778~positive regulation of immune response | C1S, C3, C4A, FYN, IDO1, LYN, PVR, TAP2, TGFB2 | 2.97E-04 | 0.4979 |
| 10 | GO:0006952~defense response | A2M, APOL1, APOL3, C1S, C3, C4A, CCL2, CIITA, CXCL10, CXCL9, GCH1, IDO1, IRF7, ITK, LYN, MX1, NMI, TAP1, TAP2 | 3.02E-04 | 0.5075 |
Notes: Gene ontology (GO) terms were studied by importing Entrez Gene IDs of 194 upregulated STAT1 target genes into DAVID. They are listed with GO terms, focused genes, P-value of the modified Fisher’s exact test, and false discovery rate (FDR).
By using the core analysis tool of IPA, we identified “interferon signaling” (P = 9.99E-11) and “antigen presentation pathway” (P = 2.80E-06) as the most significant canonical pathways associated with the set of genes. Furthermore, the functional networks of IPA defined by “Infectious Disease, Dermatological Diseases and Conditions, Organismal Development” (P = 1.00E-36) and “Infectious Disease, Respiratory Disease, Gastrointestinal Disease” (P = 1.00E-34) served as the networks with the most significant relationship ( Supplementary Table 2), supporting a key role of STAT1 target genes in host defense against infections. Next, with respect to the conventional location of transcriptional factor-binding sites, we extracted a set of 69 STAT1 target genes located either in the promoter or the 5′UTR and upregulated at ≥2-fold in at least one of the microarray studies described above. They constituted the functional network defined by “Infectious Disease, Antimicrobial Response, Inflammatory Response” (P = 1.00E-47), verifying a key role of the core STAT1 target genes in immune response to infections.
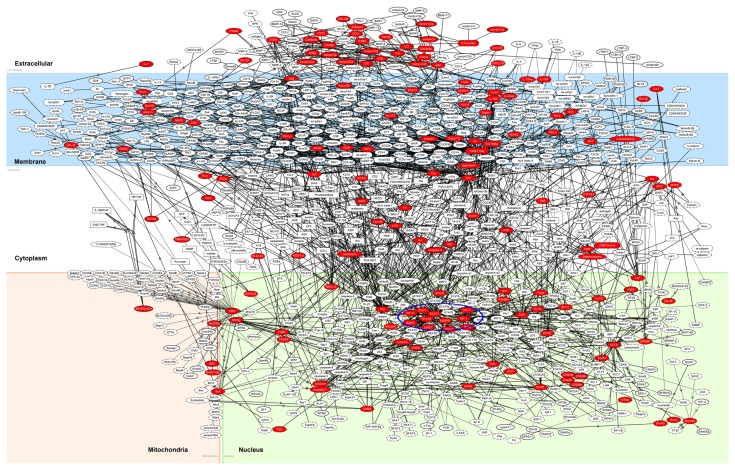
By using KeyMolnet, the neighboring network-search algorithm operating on the core contents extracted the highly complex molecular network composed of 1,077 molecules and 1,298 molecular relations. These exhibited the most significant relationships with the canonical pathways termed “transcriptional regulation by estrogen-related receptor (ERR)” (P = 1.99E-132), “transcriptional regulation by interferon-regulatory factor (IRF)” (P = 3.08E-130), “transglutaminase 2 (TG2) signaling pathway” (P = 2.03E-100), “complement pathway” (P = 1.58E-069), and “transcriptional regulation by STAT” (P = 4.08E-069), validating a key role of IRF and STAT transcription factors in the molecular network of 194 IFNγ-upregulated STAT1 target genes (Fig. 7, blue circle). When the set of 69 upregulated STAT1 target genes with location of the peaks in the promoter or the 5′UTR were imported into KeyMolnet, it extracted the complex network composed of 337 molecules and 439 molecular relations. The network again showed the most significant relationship with the canonical pathways termed “transcriptional regulation by IRF” (P = 4.46E-174) and “transcriptional regulation by STAT” (P = 2.37E-094).
Figure 7.
Molecular networks of ChIP-Seq-based STAT1 target genes.
Notes: Entrez Gene IDs of 194 upregulated STAT1 target genes were imported into KeyMolnet. The neighboring network-search algorithm extracted the highly complex molecular network composed of 1,077 molecules and 1,298 molecular relations. The cluster of IRF and STAT transcription factors is highlighted by blue circle. Red nodes represent STAT1 target genes, whereas white nodes exhibit additional nodes extracted automatically from the core contents of KeyMolnet to establish molecular connections. The molecular relation is indicated by solid line with arrow (direct binding or activation), solid line with arrow and stop (direct inactivation), solid line without arrow (complex formation), dash line with arrow (transcriptional activation), and dash line with arrow and stop (transcriptional repression).
Discussion
To study the global picture of STAT1 target gene network, we identified 1,441 stringent STAT1 ChIP-Seq peaks of protein-coding genes from the dataset SRP000703. They were located in the promoter (21.5%) and more often in intronic regions (72.2%) with an existence of IFNγ-activated site (GAS) elements. Among 1,441 ChIP-Seq-based STAT1 target genes, 212 genes (14.7%) are known IRGs on Interferome and only 194 genes (13.5%) are actually upregulated in response to IFNγ by transcriptome analysis. The panel of upregulated genes constituted IFN-signaling molecular networks pivotal for host defense against infections, where IRF and STAT transcription factors serve as a hub on which the biologically important molecular connections concentrate. The genes with the peak location in intronic regions showed significantly lower expression levels in response to IFNγ, compared to those with the peak location in the promoter or in the 5′UTR. These results indicate that the binding of STAT1 homodimer to GAS is not sufficient to fully activate target genes, suggesting the complexity of regulatory mechanisms involving STAT1-mediated gene activation. This view is supported by the most recent study of the ENCODE project performed on genomic binding sites of 119 transcription-related factors in over 450 experiments, which reveals that human transcription factors often show different co-association patterns in proximal and distal binding sites, and the binding of one transcriptional factor affects the preferred binding partners of others.9
The STAT family transcription factors are composed of highly conserved seven members. Their common structure is divided into seven structural domains: the amino terminal domain, the coiledChIP-coil domain, the DNA binding domain that mediates a direct binding to GAS elements, the linker domain, the SH2 domain that mediates specific recruitment to receptor subunits and the formation of active STAT dimers, the tyrosine activation motif, and the transcriptional activation domain (TAD) with conserved serine phosphorylation sites in the carboxyl terminus.17 STAT1 and STAT3 are affected by alternative splicing to produce α and β species, which differ at their C-terminal segments. Increasing evidence showed that efficient transcriptional activation of STAT1 target genes requires posttranslational modification of STAT1 and the recruitment of coactivators and histone and chromatin modifying complexes.1,4,17 Notably, nuclear translocation of STAT1 triggered by Y701 phosphorylation is pivotal for stable association with chromatin during IFNγ-driven transcriptional activation.18
Phosphorylated STAT1 in the nucleus directly interacts with the CREB-binding protein (CBP)/p300 family of transcriptional coactivators.19 STAT1β lacking TAD incapable of recruiting p300 to chromatin sites is defective in transcriptional activation from a chromatin template.20 Acetylation of STAT1 lysine residues 410 and 413 mediated by CBP in the nucleus plays a negative role in signaling via the mechanisms involving enhanced interaction with T-cell protein tyrosine phosphatase (TCP45; PTPN2) and increased dephosphorylation of STAT1, while histone deacetylase 3 (HDAC3) catalyzes STAT1 deacetylation.21 BRG1 (SMARCA4), an ATP-dependent helicase of the SWI/SNF chromatin remodeling complex, plays a pivotal role in IFNγ-induced expression of CIITA, the master regulator of major histocompatibility (MHX) class II complex.22 Both type I and type II IFNs phosphorylate the C-terminal serine residue S727 located in STAT1 TAD, which promotes recruitment of minichromosome maintenance deficient 5 (MCM5).23 STAT1 S727 phosphorylation is not required for nuclear translocation of STAT1 and the DNA binding capacity, but is indispensable for maximum transcriptional activation of target genes for achievement of optimum IFNγ-dependent immune response.24 Intricately, recent evidence indicated that a substantial part of STAT1 is present in the nuclei independently of tyrosine phosphorylation in a cell type-specific manner.25 Unphosphorylated STAT1 (U-STAT1) prolongs and increases the expression of a subset of genes induced initially by phosphorylated STAT1, suggesting that persistent transcriptional activation of target genes via DNA binding of STAT1 is not essentially dependent on the status of phosphorylation of STAT1.
Conclusions
We identified 1,441 stringent ChIP-Seq peaks of protein-coding genes. Among them, a small subset composed of 194 genes are actually upregulated in response to IFNγ. These results indicate that the binding of STAT1 to GAS is not sufficient to fully activate target genes, suggesting the complexity of STAT1- mediated gene regulatory mechanisms.
Supplementary Tables
Supplementary Table 1. The list of 1,441 ChIP-Seq-based STAT1 target genes.
Supplementary Table 2. Top 10 significant functional networks of IPA associated with 194 upregulated STAT1 target genes.
Acknowledgements
The authors thank Ms. Midori Ohta for her invaluable help.
Footnotes
Competing Interests
Authors disclose no potential conflicts of interest.
Author Contributions
JS designed the methods, analyzed the data, and drafted the manuscript. HT helped the data analysis. All authors reviewed and approved of the final manuscript.
Disclosures and Ethics
As a requirement of publication author(s) have provided to the publisher signed confirmation of compliance with legal and ethical obligations including but not limited to the following: authorship and contributorship, conflicts of interest, privacy and confidentiality and (where applicable) protection of human and animal research subjects. The authors have read and confirmed their agreement with the ICMJE authorship and conflict of interest criteria. The authors have also confirmed that this article is unique and not under consideration or published in any other publication, and that they have permission from rights holders to reproduce any copyrighted material. The external blind peer reviewers report no conflicts of interest.
Funding
This work was supported by grants from the Research on Intractable Diseases (H21-Nanchi- Ippan-201; H22-Nanchi-Ippan-136), the Ministry of Health, Labour and Welfare (MHLW), Japan, and the High-Tech Research Center Project (S0801043) and the Grant-in-Aid (C22500322), the Ministry of Education, Culture, Sports, Science and Technology (MEXT), Japan.
References
- 1.Platanias LC. Mechanisms of type-I- and type-II-interferon-mediated signaling. Nat Rev Immunol. 2005;5(5):375–86. doi: 10.1038/nri1604. [DOI] [PubMed] [Google Scholar]
- 2.Der SD, Zhou A, Williams BR, Silverman RH. Identification of genes differentially regulated by interferon α, β, or γ using oligonucleotide arrays. Proc Natl Acad Sci U S A. 1998;95(26):15623–8. doi: 10.1073/pnas.95.26.15623. [DOI] [PMC free article] [PubMed] [Google Scholar]
- 3.Hartman SE, Bertone P, Nath AK, et al. Global changes in STAT target selection and transcription regulation upon interferon treatments. Genes Dev. 2005;19(24):2953–68. doi: 10.1101/gad.1371305. [DOI] [PMC free article] [PubMed] [Google Scholar]
- 4.Hu X, Ivashkiv LB. Cross-regulation of signaling pathways by interferon-γ: implications for immune responses and autoimmune diseases. Immunity. 2009;31(4):539–50. doi: 10.1016/j.immuni.2009.09.002. [DOI] [PMC free article] [PubMed] [Google Scholar]
- 5.Durbin JE, Hackenmiller R, Simon MC, Levy DE. Targeted disruption of the mouse Stat1 gene results in compromised innate immunity to viral disease. Cell. 1996;84(3):443–50. doi: 10.1016/s0092-8674(00)81289-1. [DOI] [PubMed] [Google Scholar]
- 6.Liu L, Okada S, Kong XF, et al. Gain-of-function human STAT1 mutations impair IL-17 immunity and underlie chronic mucocutaneous candidiasis. J Exp Med. 2011;208(8):1635–48. doi: 10.1084/jem.20110958. [DOI] [PMC free article] [PubMed] [Google Scholar]
- 7.Maurano MT, Humbert R, Rynes E, et al. Systematic localization of common disease-associated variation in regulatory DNA. Science. 2012;337(6099):1190–5. doi: 10.1126/science.1222794. [DOI] [PMC free article] [PubMed] [Google Scholar]
- 8.Park PJ. ChIP-seq: advantages and challenges of a maturing technology. Nat Rev Genet. 2009;10(10):669–80. doi: 10.1038/nrg2641. [DOI] [PMC free article] [PubMed] [Google Scholar]
- 9.Gerstein MB, Kundaje A, Hariharan M, et al. Architecture of the human regulatory network derived from ENCODE data. Nature. 2012;489(7414):91–100. doi: 10.1038/nature11245. [DOI] [PMC free article] [PubMed] [Google Scholar]
- 10.Satoh J. Bioinformatics approach to identifying molecular biomarkers and networks in multiple sclerosis. Clin Exp Neuroimmunol. 2010;1(3):127–40. [Google Scholar]
- 11.Rozowsky J, Euskirchen G, Auerbach RK, et al. PeakSeq enables systematic scoring of ChIP-seq experiments relative to controls. Nat Biotechnol. 2009;27(1):66–75. doi: 10.1038/nbt.1518. [DOI] [PMC free article] [PubMed] [Google Scholar]
- 12.Ramagopalan SV, Heger A, Berlanga AJ, et al. A ChIP-seq defined genome-wide map of vitamin D receptor binding: associations with disease and evolution. Genome Res. 2010;20(10):1352–60. doi: 10.1101/gr.107920.110. [DOI] [PMC free article] [PubMed] [Google Scholar]
- 13.Machanick P, Bailey TL. MEME-ChIP: motif analysis of large DNA datasets. Bioinformatics. 2011;27(12):1696–7. doi: 10.1093/bioinformatics/btr189. [DOI] [PMC free article] [PubMed] [Google Scholar]
- 14.Samarajiwa SA, Forster S, Auchettl K, Hertzog PJ. INTERFEROME: the database of interferon regulated genes. Nucleic Acids Res. 2009;37(Database issue):D852–7. doi: 10.1093/nar/gkn732. [DOI] [PMC free article] [PubMed] [Google Scholar]
- 15.Huang da W, Sherman BT, Lempicki RA. Systematic and integrative analysis of large gene lists using DAVID bioinformatics resources. Nat Protoc. 2009;4(1):44–57. doi: 10.1038/nprot.2008.211. [DOI] [PubMed] [Google Scholar]
- 16.Satoh J, Tabunoki H. Comprehensive analysis of human microRNA target networks. Bio Data Min. 2011;4:17. doi: 10.1186/1756-0381-4-17. [DOI] [PMC free article] [PubMed] [Google Scholar]
- 17.Schindler C, Plumlee C. Inteferons pen the JAK-STAT pathway. Semin Cell Dev Biol. 2008;19(4):311–8. doi: 10.1016/j.semcdb.2008.08.010. [DOI] [PMC free article] [PubMed] [Google Scholar]
- 18.Sadzak I, Schiff M, Gattermeier I, et al. Recruitment of Stat1 to chromatin is required for interferon-induced serine phosphorylation of Stat1 transactivation domain. Proc Natl Acad Sci U S A. 2008;105(26):8944–9. doi: 10.1073/pnas.0801794105. [DOI] [PMC free article] [PubMed] [Google Scholar]
- 19.Zhang JJ, Vinkemeier U, Gu W, Chakravarti D, Horvath CM, Darnell JE., Jr Two contact regions between Stat1 and CBP/p300 in interferon γ signaling. Proc Natl Acad Sci U S A. 1996;93(26):15092–6. doi: 10.1073/pnas.93.26.15092. [DOI] [PMC free article] [PubMed] [Google Scholar]
- 20.Zakharova N, Lymar ES, Yang E, et al. Distinct transcriptional activation functions of STAT1α and STAT1β on DNA and chromatin templates. J Biol Chem. 2003;278(44):43067–73. doi: 10.1074/jbc.M308166200. [DOI] [PubMed] [Google Scholar]
- 21.Krämer OH, Knauer SK, Greiner G, et al. A phosphorylation-acetylation switch regulates STAT1 signaling. Genes Dev. 2009;23(2):223–35. doi: 10.1101/gad.479209. [DOI] [PMC free article] [PubMed] [Google Scholar]
- 22.Pattenden SG, Klose R, Karaskov E, Bremner R. Interferon-γ-induced chromatin remodeling at the CIITA locus is BRG1 dependent. EMBO J. 2002;21(8):1978–86. doi: 10.1093/emboj/21.8.1978. [DOI] [PMC free article] [PubMed] [Google Scholar]
- 23.Zhang JJ, Zhao Y, Chait BT, et al. Ser727-dependent recruitment of MCM5 by Stat1α in IFN-γ-induced transcriptional activation. EMBO J. 1998;17(23):6963–71. doi: 10.1093/emboj/17.23.6963. [DOI] [PMC free article] [PubMed] [Google Scholar]
- 24.Varinou L, Ramsauer K, Karaghiosoff M, et al. Phosphorylation of the Stat1 transactivation domain is required for full-fledged IFN-γ-dependent innate immunity. Immunity. 2003;19(6):793–802. doi: 10.1016/s1074-7613(03)00322-4. [DOI] [PubMed] [Google Scholar]
- 25.Cheon H, Yang J, Stark GR. The functions of signal transducers and activators of transcriptions 1 and 3 as cytokine-inducible proteins. J Interferon Cytokine Res. 2011;31(1):33–40. doi: 10.1089/jir.2010.0100. [DOI] [PMC free article] [PubMed] [Google Scholar]
Associated Data
This section collects any data citations, data availability statements, or supplementary materials included in this article.
Supplementary Materials
Supplementary Table 1. The list of 1,441 ChIP-Seq-based STAT1 target genes.
Supplementary Table 2. Top 10 significant functional networks of IPA associated with 194 upregulated STAT1 target genes.


