

Abstract
Theiler murine encephalomyelitis virus (TMEV) infection of a mouse's central nervous system is biphasic: first the virus infects motor neurons (acute phase), and this is followed by a chronic phase in which the virus infects glial cells (primarily microglia and macrophages [Mϕ]) of the spinal cord white matter, leading to inflammation and demyelination. As such, TMEV-induced demyelinating disease in mice provides a highly relevant experimental animal model for multiple sclerosis. Mathematical models have proven valuable in understanding the in vivo dynamics of persistent virus infections, such as HIV-1, hepatitis B virus, and hepatitis C virus infections. However, viral dynamic modeling has not been used for understanding TMEV infection. We constructed the first mathematical model of TMEV-host kinetics during acute and early chronic infections in mice and fit measured viral kinetic data with the model. The data fitting allowed us to estimate several unknown parameters, including the following: the rate of infection of neurons, 0.5 × 10⁻⁸ to 5.6 × 10⁻⁸ day−1; the percent reduction of the infection rate due to the presence of virus-specific antibodies, which reaches 98.5 to 99.9% after day 15 postinfection (p.i.); the half-life of infected neurons, 0.1 to 1.2 days; and a cytokine-enhanced macrophage source rate of 25 to 350 Mϕ/day into the spinal cord starting at 10.9 to 12.9 days p.i. The model presented here is a first step toward building a comprehensive model for TMEV-induced demyelinating disease. Moreover, the model can serve as an important tool in understanding TMEV infectious mechanisms and may prove useful in evaluating antivirals and/or therapeutic modalities to prevent or inhibit demyelination.
INTRODUCTION
One of the few available experimental animal models of virus-induced demyelination is Theiler murine encephalomyelitis virus (TMEV) infection in mice, which has been recognized as an experimental analog of multiple sclerosis (MS) (1, 2). TMEV belongs to the genus Cardiovirus in the family Picornaviridae (3, 4). It is a highly cytolytic nonenveloped (or naked) virus which consists of a spherical protein shell that encapsidates a single positive-strand RNA genome of about 8,100 nucleotides (3, 4). TMEV strains have been divided into two groups: high neurovirulence and Theiler original (TO) (5), or low neurovirulence. The high-neurovirulence group includes virus strains that cause a rapidly fatal encephalitis in mice, whereas members of the TO group have much lower virulence and establish chronic (or persistent) viral infection, inflammation, and demyelinating disease.
Persistent infection with virus strains of the TO group is characterized by a biphasic central nervous system (CNS) disease (6). During the first phase (termed here the acute phase), the virus infects sensory and motor neurons and causes an acute but mild encephalomyelitis that lasts for 1 to 2 weeks. The acute phase is followed by a second phase (termed here the chronic phase), during which the virus infects glial cells, primarily microglia and macrophages (Mϕ), of the spinal cord white matter (7, 8). Unlike viral infections with agents such as human immunodeficiency virus type 1 (HIV-1), hepatitis B virus (HBV), and hepatitis C virus (HCV), the unique feature of TMEV infection is that the dominant cell type of infection changes during the transition from the acute to the chronic phase of infection. The temporal dynamics of TMEV RNA replication in the CNS of susceptible and resistant strains of mice has been examined by quantitative RT-PCR and correlated with host immune responses (9). During the acute phase of infection in both susceptible and resistant mice, levels of viral replication peak and then decrease at approximately 5 days postinfection (p.i.) in parallel with the appearance of virus-specific antibodies (9) and CD8+ T cells (10–12). However, after about 2 weeks p.i., viral RNA numbers begin to increase again only in the spinal cords of susceptible mice. High-viral-genome equivalents in spinal cords are observed only in susceptible strains of mice, such as SJL/J mice developing demyelinating disease (9, 13).
During the acute phase, TMEV epitopes are presented to Th1 CD4+ lymphocytes by antigen-presenting cells in peripheral lymphoid organs, which causes them to divide and expand to effector CD4+ T cells, which in turn secrete cytokines and chemokines (14). As a result, monocytes that are recruited into the CNS differentiate into Mϕ, some of which become susceptible to TMEV infection, while others are activated and become resistant to TMEV infection (because they produce type I IFN [15, 16]) and are lost due to death and/or emigration from the spinal cord (reviewed in reference 17). A restriction of TMEV infectious virus production was observed in Mϕ isolated from mouse CNS (18) and also in murine-infected Mϕ in culture. Interestingly, this restriction is likely to reflect a block later in the virus life cycle rather than in TMEV RNA replication, translation, and polyprotein processing (19, 20). Thus, infection of Mϕ is characterized by unaffected levels of TMEV RNA replication and protein synthesis but with markedly reduced levels of infectious virus. Because TMEV is a cytolytic virus and leads to apoptosis, persistence of the infection requires continuous virus spread in the face of host immune responses (e.g., virus-specific antibodies and CD8+ T cells) and markedly reduced production of free infectious particles. Thus, infection via phagocytosis of infected apoptotic debris (or blebs) containing infectious viral RNA by Mϕ and other glial cells such as oligodendrocytes has been hypothesized, as the presence of virus-neutralizing antibodies (36) does not seem to prevent virus spread during the chronic phase (reviewed in reference 17).
Mathematical models have proven valuable in understanding the in vivo dynamics of HIV-1 (21–23), HBV (24–26), and HCV (27, 28), viruses that all cause persistent infections, as well as the dynamics of influenza A (29–31) that causes an acute infection. Mathematical modeling is also improving our understanding of intracellular viral genome dynamics (32–34), T-cell dynamics, and the quantitative events that underlie the immune response to pathogens (21). By comparing mathematical models with the data obtained from patients being treated with antiviral drugs, it has been possible to determine many quantitative features of these infections. The most dramatic finding has been that even though HIV-1-, HBV-, and HCV-induced diseases occur on a time scale of one or more decades, there are also very rapid dynamic processes that occur in hours to days, as well as slower processes that occur in weeks to months. Dynamic modeling and parameter estimation techniques have uncovered these important features of HIV-1, HBV, and HCV infections, with a subsequent impact on treatment protocols in patients. A mathematical model of chronic herpes simplex virus infection, which resides in neurons that innervate the mucosal tissue of the genital tract in infected humans, was also developed and suggested a control point of viral infectivity that could serve as a vulnerable target for therapeutic intervention (35).
In this paper, we describe a mathematical model of TMEV infection and estimate unknown viral and host parameters. The results provide insight into early (i.e., during the first 30 days p.i.) TMEV-host dynamics and may serve as an important starting point in modeling long-term (beyond 30 days of infection) demyelinating disease and possibly inform future therapeutic approaches for MS.
MATERIALS AND METHODS
Model description.
Our model of TMEV infection is based on the infection scheme shown in Fig. 1. We assume that during acute phase of infection TMEV primarily infects motor neurons (36), and equations 1 to 3 apply, while during the chronic (or persistent) phase TMEV mainly infects Mϕ via phagocytosis of infectious debris, and equations 4 to 6 apply. The infectious debris units are generated upon death of infected neurons and Mϕ.
| (1) |
| (2) |
| (3) |
| (4) |
| (5) |
| (6) |
Fig 1.
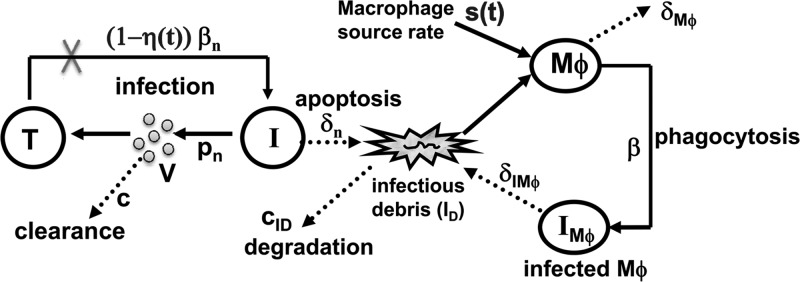
Schematic model of TMEV infection during the acute and chronic phases. The acute infection phase is plotted on the left (equations 1 to 3): uninfected motor neurons (T) are infected by free viruses (V) at rate βnV and become infected neurons (I). After 5 days p.i. virus-specific antibodies block infection with effectiveness η(t) (equations 7 and 8). Free virus is produced at rate constant pn and cleared at rate constant c. Motor neurons die only after they become infected at rate constant δn. The death of infected neurons generate infectious debris, ID. Within approximately 11 days p.i., TMEV-chemokine-recruited monocytes enter the CNS and differentiate into susceptible macrophages, Mϕ, at rate s(t) (equation 9). Uninfected Mϕ become infected, IMϕ, via phagocytosis of infectious debris, ID, at rate constant b. TMEV infection in Mϕ represents the transition from the acute to chronic phase and is plotted on the right (equations 4 to 6). Uninfected Mϕ, infected Mϕ, and infectious debris die or are lost at rate constants δMϕ, δIMϕ, and cID, respectively. Loss and death rates are represented by dashed lines.
Our model of the acute phase of infection considers uninfected motor neurons (T), infected motor neurons (I), and free virions (V). Uninfected motor neurons survive for essentially the life of the host, and hence a death term is not included in equation 1. Motor neurons, when infected by TMEV at rate βn, release virions at rate pn per cell and die by cytolysis at rate δn. Free virions are cleared from the CNS at rate c per virion. The factor η(t), where 0 ≤ η(t) ≤ 1, describes the reduction of the infection rate due to virus-specific antibodies (equations 7 and 8), which are detected as early as day 5 p.i. (9).
Due to acute TMEV infection, monocytes are recruited into the CNS and differentiate into susceptible Mϕ at rate s(t) (equation 9) at time tM p.i. (9, 37), triggering the transition from the acute to the persistent phase of infection. Our model of the chronic phase infection includes susceptible Mϕ, infected Mϕ (IMϕ), and infectious debris (ID). Susceptible Mϕ are lost at rate δMϕ due to activation of Mϕ, degradation/death and/or emigration out of the spinal cord. Infected Mϕ are lost at rate δIMϕ, due to apoptosis and/or emigration out of spinal cord. The viral RNA (vRNA) present in apoptotic remnants (or blebs) of infected cells allow infection of susceptible Mϕ at rate β via phagocytosis (based on the hypothetical mechanism described in Fig. 2 in reference 17). Infectious debris units (ID) are produced upon death/apoptosis of infected Mϕ or neurons and are cleared at rate cID per unit. The numbers of ID units produced per infected neuron (I) and per infected Mϕ (IMϕ) upon their death are αI and αIMϕ, respectively. Since TMEV production of infectious viral particles is markedly reduced in infected Mϕ, due to a block in viral assembly, we did not consider virus release from infected Mϕ.
Fig 2.
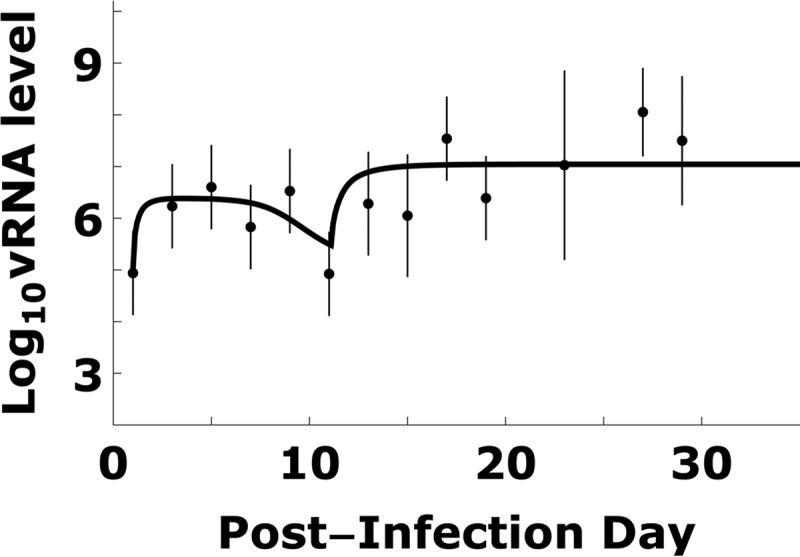
TMEV kinetics and model simulation. Total TMEV RNA kinetic data (dots) can be patterns divided into 4 stages: (i) viral increase during the first 6 days p.i., (ii) viral decrease 6 to 11 days p.i., (iii) viral increase 11 to 13 days p.i., and (iv) steady state after approximately 15 day p.i. The viral RNA kinetic data were fitted by a mathematical model (equations 1 to 9) using a Monte Carlo filtering approach as described in Materials and Methods and Fig. 4. An example of good fit curve is shown by the solid line. Dots and bars represent means and one standard deviation of log10-transformed vRNA copy equivalents measured in spinal cords of infected mice (9).
Experimental data.
We fit our model to our previously published data on BeAn strain TMEV RNA levels measured in susceptible SJL/J mouse spinal cords (Fig. 2) and serum virus-specific antibody titers (Fig. 3) (9). In some infected mice, typical acute/chronic infection symptoms were not observed, as the viral RNA (vRNA) level was probably too low to generate symptoms. This may be due to the low infection titers used in that study. In general, with low infection titers or low viral loads, 10 to 15% of mice either do not develop persistent infection or have delayed kinetics of persistent infection by several months (9, 38). As such, we excluded the data points corresponding to <700 copy equivalents/μg of total spinal cord RNA for simulation and model fits (i.e., the cutoff observed in Fig. 5 in reference 9). The term “copy equivalents” is used because viral genome copies are measured by real-time RT-PCR for short viral genome sequences, which are assumed to represent the full-length viral genome (∼8,100 nucleotides). Since a mouse is sacrificed to measure its vRNA level, there are no longitudinal kinetic data for an individual mouse. Because there is variation between mice, the data are noisy, and thus we used the mean of log10 vRNA copy equivalents/mg of spinal cord RNA at each measurement time. To quantify the variation, we calculated the standard deviation (SD) of log10 vRNA copy equivalents. Some measurement time points included four vRNA measurements. When this was the case, the SD of log10 vRNA copy equivalents was generally higher than 0.8. When there was only one vRNA measurement at a given time point, or two vRNA measurements at a given time point that differ by less than 0.8, we used 0.8 as the default SD. The means and SDs of log10 vRNA copy equivalents are shown in Fig. 2.
Fig 3.
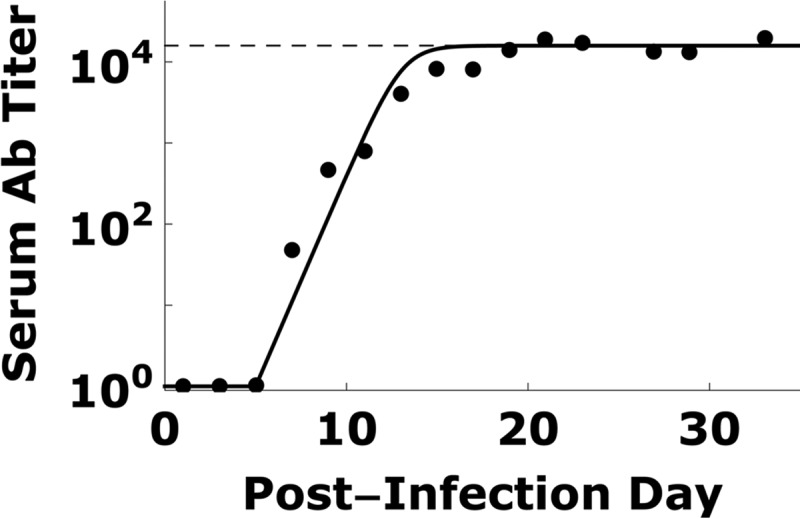
TMEV-specific antibody titers and modeling. Serum TMEV-specific antibody titers (dots; data are from reference 9) can be fitted using equation 7 (solid line). Antibody titers increased exponentially on day 5 p.i. and approached saturation (dashed line) by day 15 p.i.
Fig 5.
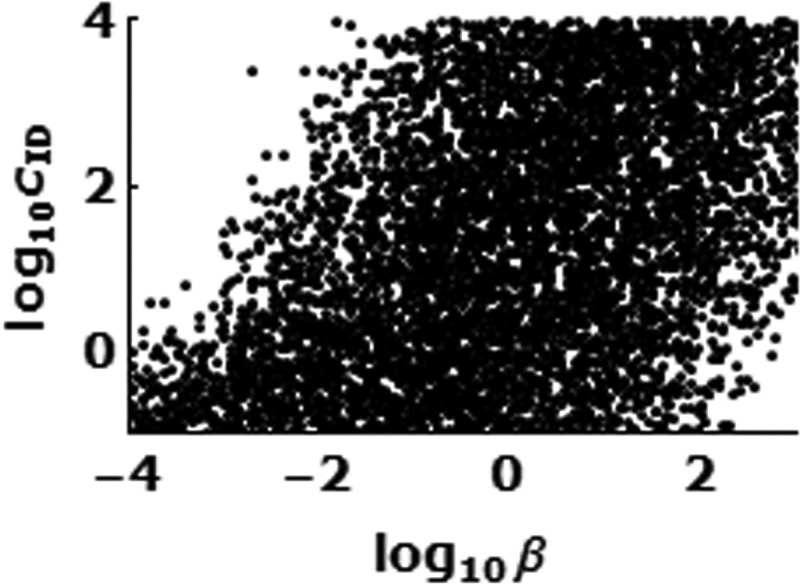
The rate constant (b) of infection of Mϕ by infectious debris via phagocytosis is strongly correlated with the rate constant (cID) of clearance of infectious debris.
Time-dependent immune responses.
We assume that the measured serum virus-specific antibody titer (Fig. 3) reflects the total virus-specific antibody in the spinal cord (36). In order to estimate h(t) in equations 1 and 2, i.e., the effect of virus-specific antibody in reducing TMEV infection in the spinal cord, we fit the virus-specific antibody levels shown in Fig. 3 by
| (7) |
where for a value of t that is <5, Ab(t) = 0 (since virus-specific antibody is only detected after day 5), κ is the maximum antibody expansion rate, and Abmax is the maximum antibody level in the spinal cord. We used Mathematica 8.0 to find the values of κ and Abmax that generated the best fit curve of the virus-specific antibody data (Fig. 3).
We assume that the main effect of antibodies is to block the infection of susceptible cells, with blocking efficacy determined as
| (8) |
where KA is the association constant between virus-specific antibody and free virions in the spinal cord, as previously used (39).
The influx of monocytes into the CNS results from virus-specific Th1 and Th17 T lymphocyte responses leading to cytokine and chemokine recruitment of monocytes into the CNS, which then differentiate into susceptible Mϕ (40). Thus, the susceptible Mϕ source rate in the model is
| (9) |
where tM is time of immune-mediated Mϕ influx, s0 is baseline source rate, and s+ is source rate after tM. Since before tM there is no immune-mediated influx of susceptible Mϕ, we set s0 at 0. The time of immune-mediated Mϕ influx, tM, is about 2 weeks p.i. (9, 37) and was estimated here while fitting the model to the experimental data.
Estimation of fixed parameters and fitting procedures.
The number of motor neurons in the spinal cord before infection is approximately 30,000 (41). The spinal cord contains ∼100 μg of total RNA. The first vRNA data, collected on day 1 p.i. (9), were 103 copy equivalents/μg or 105 copies in the whole spinal cord, so we started the simulations with a value for V of 105 copies on day 1 p.i., assuming there are no infected neurons, susceptible Mϕ, infected Mϕ, or infectious debris at the beginning of a simulation. An infected neuron contains about 105 copy equivalents of viral RNA (42), and each infected Mϕ also contains about 105 copy equivalents of viral RNA (18, 37). For simplicity, we assumed here that this level is reached immediately once a neuron or a macrophage is infected, since vRNA reaches its intracellular maximum levels (105) within 4 to 8 h p.i. in vitro (43). The loss rate of uninfected Mϕ in mouse spinal cord is unknown. Here we adopted a loss rate constant of 0.1/day, measured in the irises of rat eyes (44), in our calculations. We also assumed that infected Mϕ die faster than uninfected ones, i.e., δIMϕ > δMϕ, as estimated in vitro (45). Trottier et al. (37) found that TMEV-infected cell lines such as BHK-21 (baby hamster kidney cells) and M1-D (macrophages) produce 3.5 × 10⁵ and 2.6 × 10⁵ copy equivalents of vRNA/cell, respectively. Assuming that neurons produce slightly higher numbers of viral genomes than BHK-21 or M1-D cells (e.g., because neurons are larger cells than BHK-21), we chose a value for pn of 5 × 10⁵ δn. We also confirmed that changing 5 × 10⁵ to 1 × 10⁵ copy equivalents/cell leads to a negligible change in the results. Since the system is finite, if the number of cells of a particular type or infectious debris units in a mouse spinal cord is less than 1, it may generate unrealistic results. To avoid such an artifact, we treated the change of the number as 0 if the change was less than a cutoff value of Δt/10 days, where Δt is the time step in the simulations and 10 days is the approximate time of the acute phase or transition phase in our simulations. In other words, if the time step was 1 day, then if the number of cells changed by less than 0.1 during that time step, the change was assumed to be negligible. Further, if the rate of change was constant, this would imply that the change in number was less than 1 over the full 10-day acute phase. This cutoff value differs from 1, allowing accumulation of cell and debris numbers during the small time steps in the simulation.
Since total vRNA was measured in the spinal cord, the total vRNA computed by the model is
| (10) |
assuming that each virion has a single vRNA copy, an infected neuron contains 105 vRNA copies (42), an infected Mϕ contains 105 vRNA copies (18, 37), and the average number of vRNA copies a unit of infectious debris contains is defined as nD. Flaccid paralysis was not observed in the infected mice (9). Although the exact association between flaccid paralysis symptoms and the magnitude of damaged/lost sensory and motor neurons is not known, we considered only simulation runs where the total loss of motor neurons due to acute TMEV infection in SJL mice did not exceed 50%.
Monte Carlo filtering.
To estimate a reasonable range of the unknown model parameters, we randomly chose many sets of parameters and calculated V(t) numerically. We claim a set of parameters is good if the predicted V(t) generated a small enough weighted root mean squared error when compared with the average measured values (V̂) i.e.,
| (11) |
where log10 V(ti) is the predicted values, log10 V̂(ti) is the average of experimental values, σ(ti) is the SD of the data at ti, and n is the number of data points to fit. We used Latin hypercube sampling; i.e., the logarithmic values of parameters were first chosen randomly from an assigned interval, e.g., [0, 5]. We performed a large number (>104) of simulations to collect histograms of parameter values that give good fits of the data in equation 11. If the histogram of a given parameter is bell-shaped, the range of the parameter we report (Table 1) is given by the half-peak positions in the histogram (Fig. 4). There are three parameters for which we assign knowledge-based intervals. The interval [−1, 1] was chosen for log10 δIMϕ, because we expect that δIMϕ is slightly larger than the death rate constant of uninfected Mϕ (δMϕ) of 0.1/day. The interval [0, 3] is chosen for log10 αI and log10 αIMϕ, where αI and αIMϕ are the number of debris units created upon the death of an infected neuron and Mϕ, respectively. The number of vRNA copies in a debris unit (nD) is f × 105/αIMϕ, where f, chosen from among [1, 0.5, 0.1, 0.01], is the average fraction of the ∼105 vRNA copies in an infected Mϕ that remain intact upon loss of the cell. The logarithmic values of the other parameters, βn, c, δn, KA, tM, s0, β, cID, and s+, were chosen randomly from assigned large intervals in the first round as described in Table 1. To optimize the choice of parameter intervals in the next rounds of simulations, we adjusted the parameter intervals in every round, aiming to determine the ranges of parameters more precisely. For instance, if the peak of the histogram fell out of the chosen parameter interval, we moved the interval to cover the peak; if the half peak range occupied only a small part of the interval, we shrank the interval. Because there are many unknown parameters, we estimated their values in two steps. The viral dynamics during the acute phase (i.e., t < tM) is controlled by parameters βn, pn, c, δn, and KA (Fig. 1). With the chosen parameter intervals, we performed 1.7 × 10⁶ simulations of the model up to 11 days p.i. in order to collect 2 × 10⁵ sets of the five acute phase parameters mentioned above that generated good fits with the expression J < 0.55. Here we used a lower cutoff than in equation 11, because the data during acute phase are less noisy than those during the chronic phase. The estimation of these five unknown parameters concluded the first step of model fit with the data. In the second step, we used these 2 × 10⁵ sets of acute-phase parameters and varied the other model parameters (β, cID, and s+) randomly to look for parameter sets that fit the overall data with good quality. We ran 7.0 × 10⁴ simulations in order to collect 6,000 sets of parameters that met the fitting criteria (equation 11). As a result, we produced a histogram of 6,000 values for each parameter (Fig. 4).
Table 1.
Parameter estimates of TMEV infection during acute and chronic phases
| Phase | Parameter | Definition | Fixed value (reference[s]) | Rangea |
|---|---|---|---|---|
| Acute | T0 | No. of spinal cord motor neurons | ∼30,000 (41) | |
| nRNA | No. of viral RNA per infected neuron | 105 (42) | ||
| βn | Neuron infection rate | 0.5 × 10⁻⁸–5.6 × 10⁻⁸ day−1 | ||
| c | Free virion clearance rate | 0.01–0.3 day−1 | ||
| δn | Death rate of infected neurons | 0.6–7.1 day−1 | ||
| pn | Production rate of virions per infected neuron | 0.3–3.5 × 10⁶ virion/day | ||
| KA | Ab-virion association constant | 0.4 × 10⁻²–5.0 × 10⁻²/antibody/spinal cord | ||
| tM | Time that Mϕ source rate is tuned up | 10.9–12.9 days | ||
| Chronic | δMϕ | Mϕ loss rate | 0.1 day−1 (44) | |
| nIMϕ | No. of viral RNA/infected mϕ | 105 (18, 37) | ||
| β | Rate for ID to infect Mϕ | 3.2 × 10⁻³–1.6 × 10² day−1 | ||
| cID | ID clearance rate | 1.0 × 10⁻²–1.3 × 10² day−1 | ||
| f | Fraction of vRNA that remains upon loss of infected Mϕ | 0.01–1 | ||
| δIMϕ | Death rate of infected Mϕ | 0.1–10 day−1 | ||
| αI | No. of ID per infected neuron death | 1–103 | ||
| αIMϕ | No. of ID per infected Mϕ death | 1–103 | ||
| s+ | Enhanced Mϕ source rate | 25–350 macrophages/day |
Estimated by Monte Carlo filtering.
Fig 4.
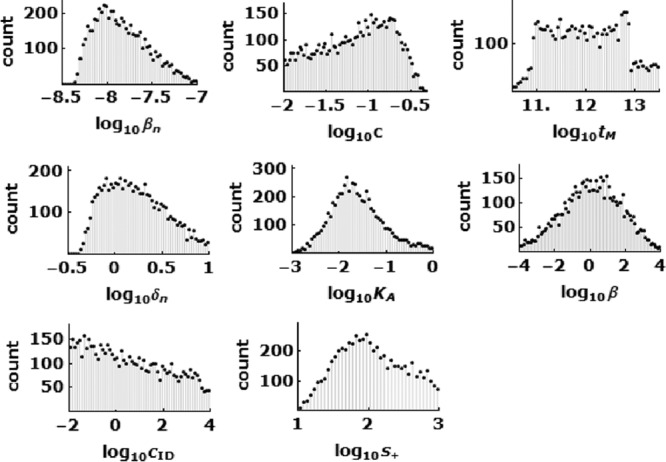
Parameter histograms from 6,000 sets of parameters which fit the data shown in Fig. 2 well using equation 10, as described in Materials and Methods. These histograms were used for the estimation of the range of unknown viral and host parameters (Table 1).
RESULTS
The model described by equations 1 to 9 and Fig. 1 characterize the dynamic transition of TMEV infection from acute to chronic phases in the mouse spinal cord. We fit the model to published data (9) of vRNA copy equivalents in mouse spinal cords (Fig. 2) and serum virus-specific antibody titers (Fig. 3). Using a Monte Carlo filtering approach, as described in Materials and Methods, we obtained a range of parameters that generated good fits of the model to the data; an example of a good fit is shown in Fig. 2, and the histograms of representative parameters that can generate fits of good quality are shown in Fig. 4. The parameter ranges obtained are summarized in Table 1. Importantly, some key parameters fall within a narrow range, as described below.
Rate of infection of neurons by free TMEV particles.
During the first 5 days of infection, before virus-specific antibodies were detected, viral RNA increased steadily due to an increase in infection of neurons. The rate constant that describes neuron infection, βn, was found to be constrained to a limited range, 0.5 × 10⁻⁸ to 5.6 × 10⁻⁸ day−1. A higher or lower value of βn fails to fit the data. To get an intuitive understanding of this rate constant, consider what happens on day 1 p.i., when there are approximately 105 virions in the spinal cord, which contains approximately 30,000 motor neurons. Using this value of βn, an infection event occurs every 0.14 to 1.6 h on average. Thus, the model predicts that the initial infection events are slow but then occur more rapidly as the viral load increases.
Effectiveness of TMEV-specific antibodies in blocking infection.
Between days 6 and 11 p.i., the average total vRNA level decreased (Fig. 2), which is explained in the model to be due to blocking of new virus infection of motor neurons by virus-specific antibodies and the TMEV-induced cytolytic loss of already-infected neurons. To estimate the virus-specific antibody kinetic parameters during TMEV infection, we obtained the best fit of equation 7 to the virus-specific level shown in Fig. 3. We estimate that the antibody levels increased after day 5 p.i. at a rate (κ) of 1.2/day and reached a maximum titer of Abmax = 104.2 after day 15 p.i. From the Monte Carlo filtering, KA is in the range 0.4 × 10⁻² to 5.0 × 10⁻²/antibody/spinal cord volume. From equation 8, this range of KA corresponds to a value of η of 98.5 to 99.9% reduction of the infection rate after day 15 p.i.
Death rate and virion production rate of infected neurons.
The death rate constant of infected neurons (δn) was found to be in the range 0.6 day−1 to 7.1 day−1, which corresponds to a half-life of 0.1 to 1.2 days. From this quantity, we deduce that the infected neurons produce virions at a rate (pn) of 0.3 × 10⁶ to 3.5 × 10⁶ virions/cell/day.
Timing of Mϕ source activation.
The TMEV-immune-mediated activation of the Mϕ source rate (tM) is estimated to occur between 10.9 and 12.9 days p.i. This is in agreement with the observation that the vRNA level was lowest at day 11 p.i. and became significantly higher at day 13. The increased Mϕ source rate provides more target cells, and hence vRNA would be expected to increase.
Activated source of susceptible Mϕ.
The total viral RNA reaches a steady state after about 15 days p.i. (Fig. 2). The simulation results suggest that the source rate of susceptible Mϕ (s+) is in the range 25 to 350 macrophages/day. Assuming that the infection of susceptible Mϕ is much faster than death/loss of Mϕ, we expect that almost all susceptible Mϕ become infected; hence, the source rate of infected Mϕ is also s+. Since an infected Mϕ dies at rate δIMϕ, the steady-state number of infected Mϕ is s+/δIMϕ. At steady state, there are ∼107 vRNA molecules in the spinal cord, which corresponds to an s+/δIMϕ of ∼102 infected Mϕ assuming each infected Mϕ contains 105 copy equivalents of vRNA (18, 37). If s+/δIMϕ is 102 and δIMϕ is 0.1 to 10 day−1, the source of Mϕ needs to be 10 to 1,000 day−1, in agreement with the result for s+ of 25 to 350 day−1.
Parameters without narrowed-range estimates.
Some parameters are not estimated well by our model and simulations. The fraction of vRNA that remains in infectious debris, f, is chosen from [1, 0.5, 0.1, 0.01], but all four values have similar likelihood based on fitting the model to the data. We find large ranges (over 4 log units) of possible values for the infection rate constant β of Mϕ by infectious debris via phagocytosis and for the clearance rate constant cID of infectious debris. We also find that significant correlation exists between these two rate constants (Fig. 5). Obviously, a higher clearance rate of infectious debris can be compensated for by a higher rate at which infectious debris infects Mϕ; therefore, the values for one can span a large range as long as the other value changes accordingly.
DISCUSSION
TMEV infection in the mouse has been extensively studied for more than 3 decades. In order to provide new insights into the virus-host dynamics during the acute and early chronic phases, we developed a mathematical model of TMEV infection and estimated unknown viral and host parameters. These parameter estimates include the neuron infection rate (βn), which is 0.5 × 10⁻⁸ to 5.6 × 10⁻⁸ day−1, the reduction of infection by virus-specific antibodies (η), which reaches 98.5 to 99.9% after day 15 p.i., the half-life of infected neurons, which is 0.1 to 1.2 days, and the immune-mediated Mϕ source rate, which is 25 to 350 macrophages/day starting at 10.9 to 12.9 days p.i.
In contrast to a chronic infection by a noncytolytic RNA virus (such as HCV), in which the host cells may live for days or weeks (27), persistence of cytolytic RNA viruses (in which host cells die rapidly, i.e., on a time scale of hours) requires dynamic cell-to-cell infection in the presence of host immunity in order to maintain the infection (46). Here we predict that virus-specific antibodies efficiently block cell-free infection by more than 98.4%. This model prediction may be supported by a prior study that indicated the presence of virus-neutralizing antibodies (36), but further studies are needed to verify that neutralizing-antibody kinetics approximate the measured virus-specific antibodies modeled here. However, we cannot rule out the possibility that virus-specific antibodies also enhance the clearance of virus, as has been observed with antibodies to HBV (33). Indeed, model simulations cannot distinguish between enhanced virus clearance and the blocking of infection by virus-specific antibodies (data not shown). Together with a significant reduction of infectious virus production by infected Mϕ compared to that by infected motor neurons, TMEV hypothetically needs to have an alternative route of infection in the presence of adaptive immune responses, such as phagocytosis of infectious debris, which is modeled here.
There is no available estimate of the influx rate of Mϕ into the spinal cord (or their basal number) before infection or during the acute phase (i.e., before a tM of ∼11 days p.i.). If their basal influx number is >2 Mϕ/day and they are susceptible to infection and productive, as are immune-recruited Mϕ that enter the spinal cord after tM, then our model simulations predict that the transient viral decline observed during the transition from acute to chronic phases will disappear (data not shown). It is plausible that most susceptible Mϕ have already died during the acute phase and that without an enhanced influx rate of new Mϕ, their number is very low at the time of transition to the chronic phase. Thus, for simplicity, we assumed here that no Mϕ susceptible to TMEV infection were present (and that their influx rate [s0] is 0/day) during the acute phase. Interestingly, Rossi et al. (8) selectively depleted Mϕ in infected SJL mice by intravenously administering mannosylated liposomes containing dichloromethylene diphosphonate, which are phagocytosed by Mϕ and then kill them, at various times from days 7 to 19 p.i. when macrophage infiltration of the CNS occurs and then sacrificing the mice on day 21 p.i. No viral RNA was detected by hybridization in 70% of treated mice (n = 16), but viral RNA was detected in 100% of untreated mice (n = 13), suggesting that Mϕ infiltration into the CNS early in the chronic phase plays an important role in viral persistence.
Acute TMEV infection is initiated by intracerebral inoculation of mice. The infection is characterized by a transition from an acute neural stage in the gray matter (brain and spinal cord) to a chronic macrophage and glial infection in the white matter (spinal cord) (13). After 30 to 60 days, high viral RNA and proinflammatory cytokine mRNA levels were observed only in susceptible SJL mice that developed demyelinating disease (9). Therefore, we modeled the CNS site, i.e., the spinal cord, where TMEV infection takes place both acutely and then chronically.
We assumed in the model that motor neurons are the primary site of acute infection, due to a prior study in which we showed that more virus is present in anterior horn (motor) neurons than in sensory neurons (36). In addition, although we modeled viral persistence in Mϕ, which is considered the main site of persistence, TMEV has been found also to replicate in other cells, such as oligodendrocytes (47–49) and astrocytes (47). However, since the dynamics of TMEV infection in these cells and the type of virus-induced death (apoptosis versus necrosis) are still under investigation, the role of these cells in TMEV persistence is unknown. It is anticipated that future studies will shed light on the role of sensory neurons, oligodendrocytes, and astrocytes, and the model here will be modified accordingly.
During the acute phase, the majority of CNS-infiltrating CD8+ T cells in susceptible mice are TMEV capsid specific (10, 12, 50). Interestingly, Lyman et al. (12) showed that at day 8 p.i., ≤1% of splenic CD8+ T cells are reactive to any of the TMEV-capsid epitopes in susceptible SJL/J mice, compared to 12% in resistant C57BL/6 mice. The lower level of peripheral virus-specific CD8+ T cells in susceptible SJL/J mice resulted in >3-fold more infiltrating virus-specific CD8+ T cells in the CNS in resistant C57BL/6 mice than in susceptible mice. As CD8+ T cells can kill TMEV-infected neurons, our estimate of the short infected-neuron half-life (0.1 to 1.2 days) may not be due solely to TMEV cytopathic effects but may also include effects of infiltrating virus-specific CD8+ T cells. The limited amount of data obtained to date on the temporal relationship between virus-specific CD8+ T cells and viral RNA copies during the acute and chronic phases of infection precluded incorporating the role of CD8+ T cells into the current mathematical model. In future studies, it will be necessary to fully characterize and model both TMEV RNA and virus-specific CD8+ T cell kinetics during the transition from the acute to the chronic phase in both susceptible and resistant mice.
In summary, we have developed a mathematical model for TMEV during the acute and early chronic phases of infection in a susceptible strain of mice. The model reproduces the virus-host dynamics during the transition from the acute to the chronic phase of infection and allowed us to estimate, for the first time, dynamic parameters of TMEV infection. Since the mouse model of TMEV infection provides an experimental analog of MS in humans, which is a chronic immune-mediated demyelinating disease of the CNS, the next step will be to incorporate later virus-host events (beyond ∼30 days) to create one comprehensive model of the complete TMEV infection process, including the clinical expression of demyelinating disease. The model developed here (and the future comprehensive one) can serve as an important tool in understanding TMEV kinetics, the antiviral immune response(s) (9, 51), and demyelinating disease during therapeutic modalities (38, 52–58), and it may prove useful in designing and evaluating new drugs for use against MS, should a viral cause be established.
ACKNOWLEDGMENTS
This work was performed under the auspices of the U.S. Department of Energy and was supported by NIH grants R56/R01-AI078881, P20-GM103452, AI028433, NS065945, and OD011095, as well as NSF grant PHY11-25915.
Footnotes
Published ahead of print 30 January 2013
REFERENCES
- 1. Ercolini AM, Miller SD. 2006. Mechanisms of immunopathology in murine models of central nervous system demyelinating disease. J. Immunol. 176:3293–3298 [DOI] [PubMed] [Google Scholar]
- 2. Brahic M, Bureau JF, Michiels T. 2005. The genetics of the persistent infection and demyelinating disease caused by Theiler's virus. Annu. Rev. Microbiol. 59:279–298 [DOI] [PubMed] [Google Scholar]
- 3. Pevear DC, Calenoff M, Rozhon E, Lipton HL. 1987. Analysis of the complete nucleotide sequence of the picornavirus Theiler's murine encephalomyelitis virus indicates that it is closely related to cardioviruses. J. Virol. 61:1507–1516 [DOI] [PMC free article] [PubMed] [Google Scholar]
- 4. Ohara Y, Stein S, Fu JL, Stillman L, Klaman L, Roos RP. 1988. Molecular cloning and sequence determination of DA strain of Theiler's murine encephalomyelitis viruses. Virology 164:245–255 [DOI] [PubMed] [Google Scholar]
- 5. Theiler M. 1937. Spontaneous encephalomyelitis of mice, a new virus disease. J. Exp. Med. 65:705–719 [DOI] [PMC free article] [PubMed] [Google Scholar]
- 6. Lipton HL. 1975. Theiler's virus infection in mice: an unusual biphasic disease process leading to demyelination. Infect. Immun. 11:1147–1155 [DOI] [PMC free article] [PubMed] [Google Scholar]
- 7. Lipton HL, Twaddle G, Jelachich ML. 1995. The predominant virus antigen burden is present in macrophages in Theiler's murine encephalomyelitis virus (TMEV)-induced demyelinating disease. J. Virol. 69:2525–2533 [DOI] [PMC free article] [PubMed] [Google Scholar]
- 8. Rossi CP, Delcroix M, Huitinga I, McAllister A, van Rooijen N, Claassen E, Brahic M. 1997. Role of macrophages during Theiler's virus infection. J. Virol. 71:3336–3340 [DOI] [PMC free article] [PubMed] [Google Scholar]
- 9. Trottier M, Schlitt BP, Kung AY, Lipton HL. 2004. Transition from acute to persistent Theiler's virus infection requires active viral replication that drives proinflammatory cytokine expression and chronic demyelinating disease. J. Virol. 78:12480–12488 [DOI] [PMC free article] [PubMed] [Google Scholar]
- 10. Dethlefs S, Brahic M, Larsson-Sciard EL. 1997. An early, abundant cytotoxic T-lymphocyte response against Theiler's virus is critical for preventing viral persistence. J. Virol. 71:8875–8878 [DOI] [PMC free article] [PubMed] [Google Scholar]
- 11. Mendez-Fernandez YV, Johnson AJ, Rodriguez M, Pease LR. 2003. Clearance of Theiler's virus infection depends on the ability to generate a CD8+ T cell response against a single immunodominant viral peptide. Eur. J. Immunol. 33:2501–2510 [DOI] [PubMed] [Google Scholar]
- 12. Lyman MA, Myoung J, Mohindru M, Kim BS. 2004. Quantitative, not qualitative, differences in CD8(+) T cell responses to Theiler's murine encephalomyelitis virus between resistant C57BL/6 and susceptible SJL/J. mice. Eur. J. Immunol. 34:2730–2739 [DOI] [PubMed] [Google Scholar]
- 13. Njenga MK, Asakura K, Hunter SF, Wettstein P, Pease LR, Rodriguez M. 1997. The immune system preferentially clears Theiler's virus from the gray matter of the central nervous system. J. Virol. 71:8592–8601 [DOI] [PMC free article] [PubMed] [Google Scholar]
- 14. Clatch RJ, Melvold RW, Miller SD, Lipton HL. 1985. Theiler's murine encephalomyelitis virus (TMEV)-induced demyelinating disease in mice is influenced by the H-2D region: correlation with TEMV-specific delayed-type hypersensitivity. J. Immunol. 135:1408–1414 [PubMed] [Google Scholar]
- 15. Jelachich ML, Lipton HL. 2001. Theiler's murine encephalomyelitis virus induces apoptosis in gamma interferon activated M1 differentiated myelomonocytic cells through a mechanism involving tumor necrosis factor alpha (TNF-α) and TNF-α-related apoptosis-inducing ligand. J. Virol. 75:5930–5938 [DOI] [PMC free article] [PubMed] [Google Scholar]
- 16. Stavrou S, Feng Z, Lemon SM, Roos RP. 2010. Different strains of Theiler's murine encephalomyelitis virus antagonize different sites in the type I interferon pathway. J. Virol. 84:9181–9189 [DOI] [PMC free article] [PubMed] [Google Scholar]
- 17. Lipton HL, Kumar AS, Trottier M. 2005. Theiler's virus persistence in the central nervous system of mice is associated with continuous viral replication and a difference in outcome of infection of infiltrating macrophages versus oligodendrocytes. Virus Res. 111:214–223 [DOI] [PubMed] [Google Scholar]
- 18. Clatch RJ, Miller SD, Metzner R, Dal Canto MC, Lipton HL. 1990. Monocytes/macrophages isolated from the mouse central nervous system contain infectious Theiler's murine encephalomyelitis virus (TMEV). Virology 176:244–254 [DOI] [PubMed] [Google Scholar]
- 19. Shaw-Jackson C, Michiels T. 1997. Infection of macrophages by Theiler's murine encephalomyelitis virus is highly dependent on their activation or differentiation state. J. Virol. 71:8864–8867 [DOI] [PMC free article] [PubMed] [Google Scholar]
- 20. Jelachich ML, Bandyopadhyay P, Blum K, Lipton HL. 1995. Theiler's virus growth in murine macrophage cell lines depends on the state of differentiation. Virology 209:437–444 [DOI] [PubMed] [Google Scholar]
- 21. Perelson AS. 2002. Modelling viral and immune system dynamics. Nat. Rev. Immunol. 2:28–36 [DOI] [PubMed] [Google Scholar]
- 22. Ho DD, Neumann AU, Perelson AS, Chen W, Leonard JM, Markowitz M. 1995. Rapid turnover of plasma virions and CD4 lymphocytes in HIV-1 infection. Nature 373:123–126 [DOI] [PubMed] [Google Scholar]
- 23. Perelson AS, Neumann AU, Markowitz M, Leonard JM, Ho DD. 1996. HIV-1 dynamics in vivo: virion clearance rate, infected cell life-span, and viral generation time. Science 271:1582–1586 [DOI] [PubMed] [Google Scholar]
- 24. Ciupe SM, Riberio RM, Nelson PW, Dusheiko G, Perelson AS. 2007. The role of cells refractory to productive infection in acute hepatitis B viral dynamics. Proc. Natl. Acad. Sci. U. S. A. 104:5050–5055 [DOI] [PMC free article] [PubMed] [Google Scholar]
- 25. Dahari H, Shudo E, Riberio RM, Perelson AS. 2009. Modeling complex decay profiles of hepatitis B virus during antiviral therapy. Hepatology 49:32–38 [DOI] [PMC free article] [PubMed] [Google Scholar]
- 26. Nowak MA, Bonhoeffer S, Hill AM, Boehme R, Thomas HC, McDade H. 1996. Viral dynamics in hepatitis B virus infection. Proc. Natl. Acad. Sci. U. S. A. 93:4398–4402 [DOI] [PMC free article] [PubMed] [Google Scholar]
- 27. Neumann AU, Lam NP, Dahari H, Gretch DR, Wiley TE, Layden TJ, Perelson AS. 1998. Hepatitis C viral dynamics in vivo and the antiviral efficacy of interferon-alpha therapy. Science 282:103–107 [DOI] [PubMed] [Google Scholar]
- 28. Dahari H, Major M, Zhang X, Mihalik K, Rice CM, Perelson AS, Feinstone SM, Neumann AU. 2005. Mathematical modeling of primary hepatitis C infection: noncytolytic clearance and early blockage of virion production. Gastroenterology 128:1056–1066 [DOI] [PubMed] [Google Scholar]
- 29. Baccam P, Beauchemin C, Macken CA, Hayden FG, Perelson AS. 2006. Kinetics of influenza A virus infection in humans. J. Virol. 80:7590–7599 [DOI] [PMC free article] [PubMed] [Google Scholar]
- 30. Pawelek KA, Huynh GT, Quinlivan M, Cullinane A, Rong L, Perelson AS. 2012. Modeling within-host dynamics of influenza virus infection including immune responses. PLoS Comput. Biol. 8:e1002588 doi:10.1371/journal.pcbi.1002588 [DOI] [PMC free article] [PubMed] [Google Scholar]
- 31. Beauchemin CA, Handel A. 2011. A review of mathematical models of influenza A infections within a host or cell culture: lessons learned and challenges ahead. BMC Public Health 11(Suppl 1):S7. [DOI] [PMC free article] [PubMed] [Google Scholar]
- 32. Dahari H, Saniz B, Perelson AS, Upritchard SL. 2009. Modeling of subgenomic hepatitis C virus RNA kinetics during treatment with alpha interferon. J. Virol. 83:6383–6390 [DOI] [PMC free article] [PubMed] [Google Scholar]
- 33. Neumann AU, Phillips S, Levine I, Ijaz S, Dahari H, Eren R, Dagan S, Naoumov NV. 2010. Novel mechanism of antibodies to hepatitis B virus in blocking viral particle release from cells. Hepatology 52:875–885 [DOI] [PMC free article] [PubMed] [Google Scholar]
- 34. Dixit NM, Perelson AS. 2005. HIV dynamics with multiple infections of target cells. Proc. Natl. Acad. Sci. U. S. A. 102:8198–8203 [DOI] [PMC free article] [PubMed] [Google Scholar]
- 35. Schiffer JT, Abu-Raddad L, Mark KE, Zhu J, Selke S, Magaret A, Wald A, Corey L. 2009. Frequent release of low amounts of herpes simplex virus from neurons: results of a mathematical model. Sci. Transl. Med. 1:7ra16. doi:10.1126/scitranslmed.3000193 [DOI] [PMC free article] [PubMed] [Google Scholar]
- 36. Lipton HL, Gonzalez-Scarano F. 1978. Central nervous system immunity in mice infected with Theiler's virus. I. Local neutralizing antibody response. J. Infect. Dis. 137:145–151 [DOI] [PubMed] [Google Scholar]
- 37. Trottier M, Kallio P, Wang W, Lipton HL. 2001. High numbers of viral RNA copies in the central nervous system of mice during persistent infection with Theiler's virus. J. Virol. 75:7420–7428 [DOI] [PMC free article] [PubMed] [Google Scholar]
- 38. Rodriguez M, Pavelko KD, McKinney CW, Leibowitz JL. 1994. Recombinant human IL-6 suppresses demyelination in a viral model of multiple sclerosis. J. Immunol. 153:3811–3821 [PubMed] [Google Scholar]
- 39. Liu P, Overman RG, Yates NL, Alam SM, Vandergrift N, Chen Y, Graw F, Freel SA, Kappes JC, Ochsenbauer C, Montefiori DC, Gao F, Perelson AS, Cohen MS, Haynes BF, Tomaras GD. 2011. Dynamic antibody specificities and virion concentrations in circulating immune complexes in acute to chronic HIV-1 infection. J. Virol. 85:11196–11207 [DOI] [PMC free article] [PubMed] [Google Scholar]
- 40. Hou W, Kang HS, Kim BS. 2009. Th17 cells enhance viral persistence and inhibit T cell cytotoxicity in a model of chronic virus infection. J. Exp. Med. 206:313–328 [DOI] [PMC free article] [PubMed] [Google Scholar]
- 41. Weber UJ, Bock T, Buschard K, Pakkenber B. 1997. Total number and size distribution of motor neurons in the spinal cord of normal and EMC-virus infected mice: a stereological study. J. Anat. 191:347–353 [DOI] [PMC free article] [PubMed] [Google Scholar]
- 42. Trottier M, Schlitt BP, Lipton HL. 2002. Enhanced detection of Theiler's virus RNA copy equivalents in the mouse central nervous system by real-time RT-PCR. J. Virol. Methods 103:89–99 [DOI] [PubMed] [Google Scholar]
- 43. Son KN, Becker RP, Kallio P, Lipton HL. 2008. Theiler's virus-induced intrinsic apoptosis in M1-D macrophages is Bax mediated and restricts virus infectivity: a mechanism for persistence of a cytolytic virus. J. Virol. 82:4502–4510 [DOI] [PMC free article] [PubMed] [Google Scholar]
- 44. Steptoe RJ, Holt PG, McMenamin PG. 1996. Origin and steady-state turnover of major histocompatibility complex class II-positive dendritic cells and resident-tissue macrophages in the iris of the rat eye. J. Neuroimmunol. 68:67–76 [DOI] [PubMed] [Google Scholar]
- 45. Jelachich ML, Lipton HL. 1996. Theiler's murine encephalomyelitis virus kills restrictive but not permissive cells by apoptosis. J. Virol. 70:6856–6861 [DOI] [PMC free article] [PubMed] [Google Scholar]
- 46. Lipton HL, Gilden DH. 1996. Viral diseases of the central nervous system: persistent infection, p 853–867 In Nathanson N. (ed), Viral pathogenesis. Lippincott-Raven, Philadelphia, PA [Google Scholar]
- 47. Aubert C, Chamorro M, Brahic M. 1987. Identification of Theiler's virus infected cells in the central nervous system of the mouse during demyelinating disease. Microb. Pathog. 3:319–326 [DOI] [PubMed] [Google Scholar]
- 48. Blakemore WF, Welsh CJ, Tonks P, Nash AA. 1988. Observations on demyelinating lesions induced by Theiler's virus in CBA mice. Acta Neuropathol. 76:581–589 [DOI] [PubMed] [Google Scholar]
- 49. Rodriguez M, Leibowitz JL, Lampert PW. 1983. Persistent infection of oligodendrocytes in Theiler's virus-induced demyelination. Ann. Neurol. 13:426–433 [DOI] [PubMed] [Google Scholar]
- 50. Kang BS, Lyman MA, Kim BS. 2002. The majority of infiltrating CD8+ T cells in the central nervous system of susceptible SJL/J. mice infected with Theiler's virus are virus specific and fully functional. J. Virol. 76:6577–6585 [DOI] [PMC free article] [PubMed] [Google Scholar]
- 51. Herder V, Gerhauser I, Klein SK, Almeida P, Kummerfeld M, Ulrich R, Seehusen F, Rohn K, Schaudien D, Baumgartner W, Huehn J, Beineke A. 2012. Interleukin-10 expression during the acute phase is a putative prerequisite for delayed viral elimination in a murine model for multiple sclerosis. J. Neuroimmunol. 249:27–39 [DOI] [PubMed] [Google Scholar]
- 52. Lipton HL, Canto CD. 1977. Contrasting effects of immunosuppression on Theiler's virus infection in mice. Infect. Immun. 15:903–909 [DOI] [PMC free article] [PubMed] [Google Scholar]
- 53. Roos RP, Firestone S, Wollmann R, Variakojis D, Arnason BG. 1982. The effect of short-term and chronic immunosuppression on Theiler's virus demyelination. J. Neuroimmunol. 2:223–234 [DOI] [PubMed] [Google Scholar]
- 54. Rodriguez M, Quddus J. 1986. Effect of cyclosporin A, silica quartz dust, and protease inhibitors on virus-induced demyelination. J. Neuroimmunol. 13:159–174 [DOI] [PubMed] [Google Scholar]
- 55. Rodriguez M, Lafuse WP, Leibowitz J, David CS. 1986. Partial suppression of Theiler's virus-induced demyelination in vivo by administration of monoclonal antibodies to immune-response gene products (Ia antigens). Neurology 36:964–970 [DOI] [PubMed] [Google Scholar]
- 56. Friedmann A, Frankel G, Lorch Y, Steinman L. 1987. Monoclonal anti-I-A antibody reverses chronic paralysis and demyelination in Theiler's virus-infected mice: critical importance of timing of treatment. J. Virol. 61:898–903 [DOI] [PMC free article] [PubMed] [Google Scholar]
- 57. Rodriguez M, Sriram S. 1988. Successful therapy of Theiler's virus-induced demyelination (DA strain) with monoclonal anti-Lyt-2 antibody. J. Immunol. 140:2950–2955 [PubMed] [Google Scholar]
- 58. Welsh CJ, Tonks P, Nash AA, Blakemore WF. 1987. The effect of L3T4 T cell depletion on the pathogenesis of Theiler's murine encephalomyelitis virus infection in CBA mice. J. Gen. Virol. 68(Pt 6):1659–1667 [DOI] [PubMed] [Google Scholar]