

Background: The evolutionarily conserved E3 ubiquitin ligase COP1 modulates hepatic glucose metabolism, but the underlying mechanisms remain unexplored.
Results: COP1 physically interacts with PTP1B, suppresses PTP1B activity, and enhances insulin action in hepatic cells.
Conclusion: COP1 modulates insulin singling via interaction with PTP1B.
Significance: This study provides further evidence that COP1 functions as a regulator of hepatic glucose metabolism.
Keywords: Akt PKB, Cell Signaling, E3 Ubiquitin Ligase, Insulin, Tyrosine Protein Phosphatase (Tyrosine Phosphatase), COP1, PTP1B, Recombinant Protein
Abstract
Recent studies reveal that COP1 suppresses the expression of gluconeogenetic genes and prohibits hepatic glucose production. To get more insight into COP1 in hepatic cells, we examined the impact of COP1 on insulin-responsive genes and insulin signaling. We found that COP1 increased the responsiveness of insulin-modulated genes to insulin in that it promoted the expression of insulin-induced genes and inhibited that of insulin-suppressed genes and that COP1 enhanced insulin signaling as it promoted phosphorylation of Akt and ERK as well as tyrosine phosphorylation of IRβ induced by insulin. To delineate the mechanism under which COP1 modulates insulin signaling, we examined the possibility that COP1 modulates the activity of PTP1B, the major insulin receptor tyrosine phosphatase. The results indicated that COP1 physically interacted with PTP1B and suppressed PTP1B phosphatase activity as well as the association of PTP1B with IRβ. We suggest that COP1 is a positive regulator of hepatic insulin signaling.
Introduction
Constitutive photomorphogenesis 1 (COP1), also known as ring finger WD motif protein 2 (RFWD2) in mammals) is an E3 ubiquitin ligase conserved from higher plants to humans (for a review, see Ref. 1). In plants, COP1 modulates the stability of transcription factors, including LAF1, HY5, HY5-HOMOLOG, HFR1, and photoreceptor phytochrome and cryptochrome (1, 2), and acts as the central switch in light signal transduction during plant development (3). In mammals, COP1 has been implicated in regulating the stability of different factors, including c-Jun (4, 5), ACC1 (6), FoxO1 (7), CRTC2 (8), metastasis-associated protein (9), and PEA3 (10). By modulating these different factors, COP1 is believed to play a role in cell growth and glucose/lipid metabolism. Recently, COP1 knockout mice and COP1 hypomorphic mice that expressed ∼5–10% of normal COP1 levels were created (11, 12). COP1-null mice were embryonic lethal, suggesting that COP1 is essential for mouse development (11). COP1 hypomorphic mice were viable but exhibited growth retardation and were prone to tumorigenesis (11). The growth retardation of COP1 hypomorphic mice was attributed to the involvement of COP1 in metabolism, as indicated by the studies where COP1 was found to modulate glucose (7, 8) and lipid metabolism (6). The tumor susceptibility of COP1 hypomorphic mice suggests that COP1 functions as a tumor suppressant, a view supported by the findings that COP1 modulates the stabilities of proto-oncogenes, including metastasis-associated protein (9), c-Jun (4, 5), and PEA3 (10), although none of them was able to provide mechanistic explanation for the COP1 knockout mouse phenotype (11, 12).
Insulin is the primary hormone that modulates body glucose homeostasis. Abnormal insulin signaling is directly associated with different pathological conditions, in particular diabetes. Insulin exerts its biological function through activation of a series of protein kinases. In physiological conditions, binding of insulin stimulates intrinsic tyrosine kinase activity of the insulin receptor (IR)2, leading to tyrosine phosphorylation of the insulin receptor substrates (IRS1 and IRS2) (13, 14). Once phosphorylated, IRSs recruit the p85 subunit of PI3K that recognizes tyrosine-phosphorylated IRS proteins and activates PI3K (15, 16). Activation of PI3K leads to the accumulation of phosphatidylinositol (3,4,5)-trisphosphate, which interacts with the plekstrin homology domain of Akt and recruits Akt onto membrane (17, 18). Once on the membrane, Akt is activated through phosphorylation at Thr-308 and Ser-473 by phosphoinositide-dependent kinase 1 (19) and the kinase complex that consists of mammalian target of rapamycin, G protein b subunit-like protein and Rictor (20–22). Once activated, Akt exerts its effects on liver glucose production and glucose transport in adipose tissue and muscle, thereby maintaining body glucose homeostasis (for a review, see Ref. 23). In both humans and rodents, impaired Akt activity is associated with the development of insulin resistance (24, 25).
PTP1B (also termed PTPN1) is a non-receptor tyrosine phosphatase that acts as the principal phosphatase for IRs (for a review, see Ref. 26). PTP1B interacts with and dephosphorylates tyrosine phospho-(active) IRs (27–29). The essential role of PTP1B in the regulation of insulin signaling is highlighted in the studies of PTP1B knockout mice, where it was found that inactivation of PTP1B enhanced insulin sensitivity (30, 31).
In this report, we have examined the impact of COP1 on the expression of insulin-responsive genes in hepatic cells. These studies lead us the novel finding that COP1 modulates insulin signaling through interaction with PTP1B.
EXPERIMENTAL PROCEDURES
Reagents
Insulin, anti-FLAG M2 affinity gel, HRP-conjugated mouse monoclonal anti-HA, anti-FLAG, and anti-β-tubulin antibodies were from Sigma. Kinase inhibitors and protease inhibitors were from Calbiochem. Sypro Ruby was from Lonza. Anti-C/EBPβ, anti-GST and anti-MKP2 antibodies were from Santa Cruz Biotechnology, Inc. Anti-PTP1B antibody, human EGF, and TNFα were from Novus Biologicals and R&D Systems. Anti-phospho-Akt at Thr-308 and Ser-473, anti-Akt, anti-phospho-ERK, anti-ERK, anti-IR, anti-phospho-IR, anti-IRS2, and anti-phospho-tyrosine antibodies were from Cell Signaling Technology, Inc. Anti-COP1 and anti-TRB3 rabbit antibodies have been described previously (7, 32).
Plasmids and Virus Production
COP1 expression vectors including COP1 adenoviruses and FLAG-tagged COP1 have been described previously (7). The HA-tagged wild-type, D181A, and C215S PTP1B expression vectors were from Dr. Ben Neel of Harvard Medical School. COP1 shRNA has been described previously (7). pTric-HisA-PTP1B was from Addgene. pGEX-COP1 was generated through cloning COP1 cDNA into the BamHI and NotI sites of the pGEX-5 × 2 vectors. The generation of adenoviral vectors has been described previously (7). The adenoviruses were amplified in HEK293 cells and purified through double Caesium chloride banding. The final titer of adenoviruses for the experiments was 1011 plaque-forming units/ml.
Purification of Recombinant GST-COP1 and His-PTP1B
To produce GST-COP1, pGEX-COP1 was introduced into Bl-21 cells. When the cells were grown into log phase, 1 mm isopropyl 1-thio-β-d-galactopyranoside was added for 4 h. Then the total cellular proteins were extracted with cells lysed into 1× PBS supplemented with 1% Triton X-100, and recombinant GST-COP1 fusion peptides were purified with glutathione-Sepharose 4B (GE Healthcare) according to the instructions of the manufacturer. The recombinant His-PTP1B was purified similarly, but nickel-agarose (Qiagen) was used.
Cell Culture, Adenoviral Transduction, and Transient Transfection
Fao cells and HepG2 cells were grown in RPMI 1640 supplemented with 10% (v/v) FBS, 2 mm l-glutamine, 100 units/ml penicillin, and 100 μg/ml streptomycin (Invitrogen). HEK293 cells were grown in DMEM supplemented with 10% (v/v) FBS, 2 mm l-glutamine, 100 units/ml penicillin, and 100 μg/ml streptomycin (Invitrogen). For viral infection, 40% confluent Fao cells were incubated with the proper amount (the amount used so that more than 80% of cells are transduced) of adenovirus for 24 h. 3T3-L1 preadipocytes were grown in DMEM (high-glucose) supplemented with 10% (v/v) bovine serum, 2 mm l-glutamine, 100 units/ml penicillin, and 100 μg/ml streptomycin (Invitrogen). The differentiation of 3T3-L1 adipocytes was carried out as described previously (33). For treatment, the cells were serum-starved overnight and treated with the corresponding agents as described in the figure legends. For insulin treatment, different doses of insulin were used, depending on the types of cells. The transient transfection was performed with Lipofectamine 2000 (Invitrogen) according to the instructions of the manufacturer.
Hepatic Glucose Production Assay
The glucose production assay was essentially carried out as described previously (7). Briefly, rat hepatoma Fao cells transduced with the proper amount of adenovirus (> 80% of infection) were treated with a combination of 0.25 μm dexamethasone and 2.5 μm forskolin or a combination of 0.25 μm dexamethasone, 2.5 μm forskolin, and 10 nm insulin for 5 h at 37 °C. Cells were incubated for an additional 3 h in glucose production buffer (glucose-free DMEM (pH 7.4) containing 20 mm sodium lactate and 2 mm sodium pyruvate without phenol red), at the end of which 0.5 ml of medium was used to measure the glucose concentration using a glucose assay kit (Sigma, catalog no. 510-A). Cells were collected and lysed, and the total protein concentration was measured by Bradford assay (Bio-Rad) to normalize for cell count.
Tissue Lysate Preparation
The liver was removed from a two-month-old C57Bl/6 mouse, rinsed with ice-cold PBS, and then homogenized in immunoprecipitation buffer (20 mm Tris (pH7.6), 150 mm NaCl, 0.5 mm EDTA, 0.5 mm DTT, 1% Nonidet P-40, 10% glycerol, and protease and phosphatase inhibitors). The tissue debris was removed by centrifuging the homogenates at 14,000 × g for 10 min.
Cell Extract Preparation and Western Blotting
After the indicated treatments as described in the figure legends, cells were washed twice with PBS and lysed with cell lysis buffer (20 mm Tris (pH7.6), 150 mm NaCl, 0.5 mm EDTA, 0.5 mm DTT, 10 mm, 1% Triton X-100 or 1% Nonidet P-40, 10% glycerol, and protease and phosphatase inhibitors). Equal amounts of protein (20–30 μg) were subjected to SDS-PAGE electrophoresis and transferred to polyvinylidene fluoride membrane (Millipore, Billerica, MA). The membranes were incubated with each primary antibody, followed by incubation with a horseradish peroxidase-conjugated secondary antibody (Bio-Rad). The protein bands were visualized using an ECL detection system (Amersham Biosciences). For quantification, the densities of bands were measured with Image J software.
Coimmunoprecipitation (co-IP) Assay
Total cell lysates or liver homogenates prepared in the immunoprecipitation buffer noted above were incubated overnight with primary antibodies (i.e. anti-FLAG M2 affinity gel or anti-PTP1B antibody) followed by 45–120 min of incubation with protein A/G-agarose (depending on the experiments). Immunoprecipitates bound to agarose beads were washed and subjected to SDS-PAGE and Western blot analysis.
GST Pull-down Assay
GST or GST fusion peptides (500 ng/reaction) bound to glutathione beads were incubated with either recombinant His-tagged PTP1B or total cell lysates in co-IP buffer for 4–6 h. Then the beads were washed three times with co-IP buffer, and the proteins retained on the glutathione beads were separated on SDS-PAGE and probed with anti-GST or anti-PTP1B antibodies.
PTP1B Phosphatase Assay
The HA-tagged PTP1B expression vector was transiently transfected with or without the FLAG-tagged COP1 expression vector into HEK293 cells. 36 h post-transfection, the total cellular proteins were extracted with lysis buffer, and HA-tagged PTP1B was immunoprecipitated with an anti-HA antibody. Then immunoprecipitated HA-PTP1B was washed three times with lysis buffer and once with phosphatase assay buffer (25 mm HEPES (pH 7.2), 50 mm NaCl, 5 mm dithiothreitol, and 2.5 mm EDTA). Next, HA immunoprecipitates were resuspended into 100 μl of phosphatase assay buffer supplemented with 4 μg/ml of p-nitrophenyl phosphate. After incubation at 37 ºC for the proper time (after the light yellow color was achieved), A420 was measured to determine phosphatase activity. The same phosphatase assay was also carried out with the recombinant GST-COP1 and His-PTP1B peptides.
RNA and RT-PCR
The total RNAs were prepared with the RNeasy kit from Qiagen according to the instructions of the manufacturer. The reverse transcription was carried out with an RT kit from Ambion according to the instructions of the manufacturer. The real-time PCRs were carried with an Option 2 cycler (MJ Research) using the reagents from Bio-Rad with specific primers to each gene. The PCR program was as follows: 94 °C for 30 s, 56 °C for 30 s, and 72 °C for 30 s. The number of cycles ranged from 24–35, depending on the gene, for getting a linear range of amplification. The primers used were as follows: ACC1, 5′-GGACAGACTGATCGCAGAGAAAG-3′ (forward) and 5′-GCTGTTCCTCAGGCTCACAT-3′ (reverse); C/EBPβ, 5′-GCAAGAGCCGCGACAAG-3′ (forward) and 5′-GGCTCGGGCAGCTGCTT-3′ (reverse); FAS, 5′-GCTGCGGAAACTTCAGGAAAT-3′ (forward) and 5′-AGAGACGTGTCACTCCTGGACTT-3′ (reverse); PGC1α, 5′-GCGCCGTGTGATTTAGCTT-3′ (forward) and 5′-AAAACTCAAAGCGGTCTCTCAA-3′ (reverse); SREBP-1c, 5′-CTGGATTTGGCCCGGGGAGATTC-3′ (forward) and 5′-TGGAGCAGGTGGCGATGAGGTTC-3′ (reverse); 36B4, 5-ATGATTATCCAAAATGCTTCATTG-3′ (forward) and 5-AACAGCATATCCCGAATCTCA-3 (reverse); COP1, 5′-GTCATCCAGGATGCAGTGGA-3′ (forward) and 5′-GCTCCTGATAGACCTTTGAC-3 (reverse); and TRB3, 5′-GACTCTCTGTGGGACAAGCA-3′ (forward) and 5′-CAGCCAGCATGGTGAAGAGC-3′ (reverse).
Statistical Analysis
Means ± S.D. were calculated, and statistically significant differences among groups were determined by one-way analysis of variance followed by post hoc comparisons or two-tailed unpaired Student's t test between two groups, as appropriate. An effect was considered significant when p < 0.05.
RESULTS
COP1 Regulates Insulin-responsive Gene Expression in Hepatic Cells
In the early studies, COP1 was found to suppress the expression of PEPCK and G6pase, two gluconeogenetic genes that are inhibited by insulin in hepatic cells (7, 8), and to interact with TRB3 to modulate ACC1 activity in adipocytes (6). In recent studies, we and others (34, 35) showed that insulin induced TRB3 expression in both primary hepatocytes and rat hepatoma Fao cells. We thus wondered whether COP1 could modulate TRB3 expression. Toward this, Fao cells transduced with adenoviral vectors expressing GFP (as a control) and COP1, respectively, were treated with different doses of insulin (0.5, 1, and 10 nm) for 6 h. Then total cell lysates from these cells were prepared and analyzed in a Western blot analysis with anti-TRB3 antibody. As shown in Fig. 1A, the treatment of Fao cells with insulin increased the levels of TRB3 protein in a dose-dependent manner (i, lanes 1–4), in agreement with the view that TRB3 expression is insulin-responsive (34, 35). Ectopic expression of COP1 increased the levels of TRB3 protein not only under basal conditions but also under insulin stimulation (i, compare lanes 4–8).
FIGURE 1.

COP1 regulates insulin-responsive hepatic gene expression. A, COP1 enhances TRB3 and C/EBPβ expression and Akt phosphorylation induced by insulin (Ins) in Fao cells. Fao cells were transduced with adenoviral vectors expressing GFP and HA-tagged COP1, respectively. Then the total cell lysates were prepared after these Fao cells were treated with insulin at the indicated dosages for 6 h for Western blot analysis with the antibodies specific to TRB3 (i), C/EBPβ (ii), phospho-Akt (iii), and Akt (iv) antibodies, respectively. v shows the expression of HA-tagged COP1 in each sample. B, quantitative analysis of TRB3 and C/EBPβ expression in A. The levels of TRB3 and C/EBPβ under unstimulated conditions and without COP1 expression were set as 1 after being normalized to total cellular Akt. Bars represent means ± S.D. (n = 3). In all cases, p < 0.03. C, the experiments were carried out as in A, but the cells were also transduced with an adenoviral vector that expresses E-3 ligase defective E-COP1, (E-, E3 ligase defective COP1) and cells were treated with a single dose (1 nm) of insulin for 6 h. iii and iv show the expression of HA-tagged COP1 and β-tubulin in each sample, respectively. D, 3T3-L1 adipocytes transduced with adenoviral vectors that express GFP, HA-tagged COP1, or COP1 shRNA were treated with or without insulin for 6 h. The total cell lysates were prepared for Western blot analysis with the antibodies of TRB3 (i), C/EBPβ (ii), COP1 (iii), and β-tubulin (iv), respectively. Shown are representative results from experiments repeated three times. E, real-time RT-PCR analysis of the expression of C/EBPβ, TRB3, SREBP1c, FAS, ACC1, and PGC1α in Fao cells. Fao cells transduced with adenoviral vectors that express either GFP or COP1 were treated with or without 1 nm insulin for 6 h. Total RNAs were then prepared for real-time RT-PCR analysis as described under “Experimental Procedures.” Bars show means ± S.D. (n = 3). p < 0.05 in all cases.
We reported recently that C/EBPβ, the upstream factor that modulates TRB3 expression, was also induced by insulin (34). Therefore, we examined the impact of COP1 on C/EBPβ expression. We observed that COP1 expression also augments C/EBPβ expression (Fig. 1A, ii). Fig. 1B represents the quantified expression levels ofTRB3 and C/EBPβ in these experiments.
Next, we examined insulin-induced Akt phosphorylation at Ser-473. As expected, insulin promoted Akt phosphorylation at Ser-473 in a dose-dependent manner (Fig. 1A, iii, lanes 1–4). Interestingly, ectopic expression of COP1 augmented Akt phosphorylation (Fig. 1A, iii, compare lanes 2–4 and 6–8) without altering the cellular levels of Akt (v). Akt phosphorylation at Ser-473 is an indicator of Akt activation (36). The level of HA-COP1 expressed from adenoviral vectors is shown in Fig. 1A, iv. Thus, these results imply that COP1 might modulate Akt activation (see below).
To determine the role of COP1 E3 ligase activity in TRB3 and C/EBPβ expression, the E3 ligase-defective COP1 mutant (E-COP1) was also expressed in Fao cells in separate experiments. As shown in Fig. 1C, E-COP1, similarly to wild-type COP1, augmented cellular levels of TRB3 and C/EBPβ under basal and insulin-treated conditions (compare lanes 1 and 2 and 5 and 6 in i and ii), suggesting that COP1 E3 ligase activity is not necessary for COP1 to promote TRB3 and C/EBPβ expression.
Insulin induces the expression of TRB3 and C/EBPβ in adipocytes (34). To determine whether COP1 affects the expression of C/EBPβ and TRB3 in adipocytes, the protein levels of C/EBPβ and TRB3 were assessed in 3T3-L1 adipocytes, transduced with adenoviral vectors that express GFP or COP1, and treated with insulin. Similar to the observations in Fao cells, COP1 expression enhanced the expression of TRB3 and C/EBPβ induced by insulin (Fig. 1D, i and ii, lanes 1–4). Also, treatment of 3T3-L1 adipocytes with insulin increased the cellular level of COP1 (Fig. 1D, iii, compare lanes 1 and 2), in agreement with the notion that insulin promotes COP1 expression (7).
In these experiments, we also examined the impact of COP1 shRNA on the expression levels of TRB3 and C/EBPβ and observed that the expression of COP1 shRNA impaired the insulin-induced expression of both TRB3 and C/EBPβ (Fig. 1D, i and ii, lanes 5 and 6). COP1 shRNA effectively suppressed COP1 expression, as the levels of COP1 in COP1 shRNA cells were roughly 70% lower than that of control cells (Fig. 1D, iii, compare lanes 1 and 2 and 5 and 6).
To determine whether COP1 also modulates the other insulin-responsive genes in Fao cells, we next examined the expression of ACC1, SREBP1c, FAS, and PGC1α through quantitative RT-PCR with the specific primers to each gene. As seen in Fig. 1E, the treatment of Fao cells with insulin for 6 h increased the mRNA levels of C/EBPβ, TRB3, ACC1, FAS, and SREBP1c and decreased that of PGC1α, as expected (34, 37–41). Exogenous expression of COP1 not only increased the mRNA levels of C/EBPβ, TRB3, ACC1, FAS, and SREBP1c and decreased that of PGC1α but also enhanced the effects of insulin on these genes. On the basis of these results, we conclude that COP1, in a fashion similar to insulin stimulation, modulates the expression of insulin-regulated genes.
COP1 Enhances the Insulin-induced Phosphorylation of Akt and ERK
In previous experiments, we observed that COP1 expression positively regulates insulin-responsive genes and enhances insulin-induced Akt phosphorylation. Together, these data suggest that COP1 might modulate insulin signaling, thereby modulating insulin-responsive genes. To test this, Akt phosphorylation at Thr-308 and Ser-473 was assessed in Fao cells that were transduced with adenoviral vectors to express GFP, COP1, and E-COP1 and treated with insulin for different periods of time. As shown in Fig. 2A, insulin induced Akt phosphorylation in a time-dependent manner. The levels of Akt phosphorylation at Thr-308 and Ser-473 increased more than 10-fold after 30 min of insulin stimulation (Fig. 2A, lanes 1–4 in i for Ser-473 and ii for Thr-308). Exogenous expression of COP1 not only enhanced Akt phosphorylation at both Thr-308 and Ser-473 (Fig. 2A, compare lanes 2 and 3 and 6 and 7 in i and ii) but also prolonged the duration of Akt phosphorylation (compare lanes 4 and 8 in i and ii). Moreover, in agreement with the view that modulation of insulin-responsive genes by COP1 is independent of COP1 ligase activity, E-COP1 expression also enhanced Akt activation (Fig. 2A, i and ii, lanes 9–12). The differences in Akt phosphorylation observed here were not caused by changes in Akt expression, as comparable levels of total Akt were detected in each sample (Fig. 2A, iii).
FIGURE 2.

COP1 enhances the phosphorylation of Akt and ERK by insulin. A, Fao cells transduced with adenoviral vectors that express GFP, COP1, or E-COP1 were treated with insulin (Ins) (100 nm) for the indicated times. The total cell lysates were prepared for Western blot analysis with anti-phospho Akt at Ser-473 (i), Thr-308 (ii), anti-Akt (iii), anti-phospho-ERK (iv), and anti-ERK (v) antibodies, respectively. vi shows the expression of HA-tagged COP1 from adenoviral vectors transduced into Fao cells. The bar graphs in the top panel show the quantitative analysis of phospho-Akt at Ser-473, in which the level of phospho-Akt at Ser-473 was set as 1 under unstimulated conditions after being normalized to total cellular Akt, and the quantitative analysis of phospho-ERK, in which the level of phospho-ERK was set as 1 under unstimulated conditions after being normalized to total cellular ERK. Note that the level of ERK phosphorylation is the sum of both phospho-ERK bands. Bars represent means ± S.D. (n = 3). In all cases, p < 0.023. B, hepatic glucose production assay. Fao cells transduced with adenoviral vectors that express GFP, HA-tagged COP1, or HA-tagged E-COP1 were subjected to a glucose production assay as described under “Experimental Procedures.” The bar graphs show means ± S.D. (n = 3). *, p < 0.05. D/F, dexamethasone (0.25 μm)/forskolin (2.5 μm); Ins, insulin (10 nm). The bottom panels show the levels of wild-type COP1, E-COP1, and β-tubulin (β-Tub), which serves as a loading control. C, PI3K-dependent activation of Akt and induction of TRB3, C/EBPβ, and MKP-2 by COP1. The experiments were carried out essentially as in A except that the cells were pretreated with or without 10 μm LY294002 (Ly) for 45 min. In v-viii, the Fao cells were treated for 6 h. D, knockdown of COP1 expression in Fao cells. Fao cells were transduced with lentiviral vectors that express scramble (SC), TRCN0000041083 (83), TRCN0000041084 (84), TRCN0000041085 (85), and TRCN0000041086 (86), respectively. 48 h post-transduction, total RNAs were prepared and subjected to RT-PCR analysis with specific primers to COP1 (top panel) and GAPDH (bottom panel) as described under “Experimental Procedures.” E, Fao cells expressing scrambled or COP1 shRNA TRCN0000041086 were treated with 100 nm insulin for the indicated times. The phosphorylation of Akt (at Ser-473) and ERK and the expression of C/EBPβ were assessed in a Western blot analysis with specific antibodies, respectively.
Next, we assessed the impact of COP1 on the phosphorylation of ERK, the other downstream kinase of insulin signaling. We observed that both COP1 and E-COP1 enhanced insulin-induced ERK phosphorylation (Fig. 2A, iv) without affecting the total cellular levels of ERK (v).
We and others (7, 8) have shown previously that expression of COP1 suppresses hepatic glucose production. Because E-COP1, similar to wild-type COP1, modulates insulin-responsive genes and insulin-induced Akt activation, one would expect that E-COP1 could also suppress hepatic glucose production. In agreement with this notion, exogenous expression of E-COP1, similar to that of wild-type COP1, suppressed hepatic glucose production induced by dexamethasone and forskolin (Fig. 2B).
COP1 Regulates Akt Activation and Gene Expression in a PI3K-dependent Manner
To gain further insight into COP1-regulated Akt and ERK phosphorylation, Fao cells expressing GFP, COP1, or E-COP1 were pretreated with 10 μm LY294002 (a specific inhibitor of PI3K that acts upstream of Akt activation in insulin signaling (42)) for 45 min, followed by insulin for 30 min, prior to assessment of Akt phosphorylation. As shown in Fig. 2C, pretreatment of Fao cells with LY294002 markedly reduced Akt phosphorylation induced by insulin (i, lanes 1–4) as well as COP1 expression (i, lane 5–8) without altering the cellular levels of Akt (ii). On the other hand, pretreatment of Fao cells with LY294002 had no effect on ERK phosphorylation (Fig. 2C, iii for phospho-ERK and iv for total ERK), supporting the notion that insulin activates Akt through the IR-IRS-PI3K-Akt signal transduction pathway whereas it activates ERK through the IR-SHC-RAF-MEK1-ERK signal transduction pathway (43, 44) without involvement of PI3K.
Insulin promotes TRB3 expression in a PI3K-dependent manner (33). We therefore examined the impact of PI3K activity on the expression of TRB3 and C/EBPβ in the above experiments. In these experiments, the cells were treated with insulin for 6 h to better detect the expression of both proteins. In keeping with the above predictions (Fig. 1B), the expression of both C/EBPβ and TRB3 was induced by insulin and enhanced by COP1 (Fig. 2C, vi and vii, compare lanes 1, 2, 5, and 6). Pretreatment of Fao cells with LY294002 attenuated the induction of TRB3 (Fig. 2C, vi) and C/EBPβ (vii) by insulin (compare lanes 2 and 4) and by COP1 (compare lanes 6 and 8). As an extension of these experiments, we also examined the impact of COP1 on the expression of MKP-2, another insulin-inducible gene (45). As expected, insulin promoted the expression of MPK-2 (Fig. 2C, viii, compare lanes 1 and 2), which was further enhanced by COP1 expression (compare lanes 2 and 6). Pretreatment of cells with LY294002 reduced the expression of MKP-2 in all cases (Fig. 2C, compare lanes 2 and 4 or 6 and 8). Together, these results demonstrate that induction of the expression of TRB3 and C/EBPβ by COP1 is PI3K-dependent.
Knockdown of COP1 Impairs Insulin-induced Phosphorylation of Akt and ERK
To further investigate the effects of COP1 on insulin signaling, Fao cells were transduced with lentiviral vectors that expressed different COP1 shRNAs. Among the four shRNAs tested (83–86, as described in the figure legend), 83, 85, and 86 effectively repressed COP1 mRNA expression (Fig. 2D). Next, Fao cells expressing COP1 shRNA (86) were treated with insulin, and Akt and ERK activation as well as C/EBPβ expression was assessed. In comparison to the ones that express scrambled shRNA, Fao cells expressing COP1 shRNA exhibited impaired Akt and ERK activation and insulin-induced C/EBPβ expression (Fig. 2E, compare lanes 1–4 to 5-8 in i and iii). We also examined the total cellular levels of Akt (Fig. 2E, ii) and ERK (iv). Comparable levels of Akt and ERK were observed in Fao cells that express scrambled shRNA or COP1 shRNA (Fig. 2E, compare lanes 1-3 and 4-6). Collectively, these data suggest that the presence of COP1 enhances the phosphorylation of Akt and ERK induced by insulin.
COP1 Enhances Tyrosine Phosphorylation of IR and IRS by Insulin
As mentioned earlier, insulin induces Akt activation via the insulin-IR-IRS-PI3K-Akt pathway whereas inducing that of ERK via the IRS-SHC-RAF-MEK1-ERK pathway (43, 44), with IR being the common component in both pathways. The enhancement of both Akt and ERK activation (Fig. 2) by COP1 implies that COP1 could modulate IR activation by insulin. To test this, Fao cells transduced with adenoviral vectors that express either GFP or COP1 were treated with insulin for 15 min, and the total cell lysates were prepared from these cells for Western blot analysis with anti-phospho-IR Tyr-1150/1151 antibody. As shown in Fig. 3A, the level of insulin-stimulated IR phosphorylation at Tyr-1150/1151 was roughly 2-fold higher in cells transduced with COP1 adenoviral vector (i, compare lanes 1 and 2 and 3 and 4), indicating that COP1 enhances IR phosphorylation. The effect of COP1 on IR phosphorylation could not have been due to different expression of IR because comparable levels of IR were detected in all samples (Fig. 3A, iv).
FIGURE 3.

COP1 promotes tyrosine phosphorylation of IR and IRS and the interaction between IRS and p85. A, Fao cells expressing GFP or COP1 were treated with or without insulin (Ins) (100 nm) for 15 min. Then the total cell lysates were prepared for Western blot analysis with anti-phospho-IR (pIR) (i) and anti-IR (iv). In addition, the total cell lysates were subjected to immunoprecipitation (IP) with anti-IRS-2 antibody and the anti-IRS-2 immunoprecipitates were analyzed in a Western blot analysis (IB) with anti-pTyr antibody (ii) and anti-p85 antibody (iii). The quantification of IR phosphorylation is shown in bar graphs. Bars represent means ± S.D. (n = 3). *, p < 0.036; **, p < 0.012. B, HEK293 cells were transfected with Myc-tagged IRS-1 plus or minus FLAG-tagged COP1 expression vectors. The transfected cells were serum-starved overnight followed by 15 min of insulin (100 nm) stimulation, and then the total cell lysates were extracted and immunoprecipitated with the anti-Myc antibody. The anti-Myc immunoprecipitates were subjected to Western blot analysis with anti-p85 (i), anti-pTyr (iii), and anti-Myc (iv), respectively. Meanwhile, the total cell lysates were also subjected to Western blot analysis with anti-p85 (ii), anti-phospho-Akt at Ser-473 (v), anti-Akt (vi), and anti-FLAG-COP1 (vii), respectively. C, Fao cells were transduced with adenoviruses that express luciferase shRNA and COP1 shRNA, respectively. After the cells were treated with insulin for the indicated times, the total cell lysates were prepared for assessing the phosphorylation of IR (i), IRS-2 (ii), Akt (iv), and ERK (vi), respectively. The total cellular levels of IR, IRS-2, Akt, and ERK are shown in iii, v, and vii. D, the experiments were carried out essentially as in C, except that Fao cells were treated with different doses of insulin (0, 0.1, 0.3, 1, 10, and 100 nm) for 15 min. E, quantitative presentation of the levels of Insulin Receptor beta, IRS, and Akt phosphorylation in D. The phosphorylation level of each protein under unstimulated conditions and without COP1 shRNA expression was set as 1 after being normalized to the total level of individual cellular protein. Bar graphs show means ± S.D. (n = 3). p < 0.021 in all cases.
IRS-2 is the major IR substrate in hepatic cells. Next, we assessed the phosphorylation status of IRS-2. Toward this end, IRS-2 was immunoprecipitated with an anti-IRS-2 antibody from the above cell lysates and analyzed in a Western blot analysis with an anti-pTyr antibody. As shown in Fig. 3A, treatment of Fao cells with insulin dramatically increased tyrosine phosphorylation of IRS-2 (ii, compare lanes l and 2), and ectopic expression of COP1 augmented that of IRS-2 induced by insulin (compare lanes 2 and 4).
IRS phosphorylation by IR promotes the interaction between IRS and p85 of PI3K, which activates PI3K and, subsequently, Akt (13, 14). We next assessed the interaction between IRS-2 and p85. Indeed, COP1 also increased the amount of p85 associated with IRS-2 (Fig. 3A, iii, compare lanes 2 and 4).
To further substantiate the finding that COP1 enhances the association of IRS with PI3K, we next examined the association of IRS-1 with p85 in HEK293 cells in which Myc-tagged IRS-1 was transiently cotransfected with or without the COP1 expression vector. After the transfected cells were treated with or without insulin for 15 min, a co-IP assay was carried out with an anti-Myc antibody. HEK293 cells were used here because they are readily transfected and insulin-responsive. As shown in Fig. 3B, treatment of the cells with insulin strongly increased the amount of p85 associated with Myc-IRS-1 (i, lanes 1 and 2). COP1 expression increased the amount of p85 with myc-IRS-1 in both basal and insulin-stimulated cells (Fig. 3B, i, compare lanes 1 and 3 and 2 and 4), indicating that COP1 enhances the association of PI3K with IRS-1. In this experiment, we also assessed the tyrosine phosphorylation of Myc-IRS-1. Insulin stimulated tyrosine phosphorylation of IRS-1 (Fig. 3B, iii, compare lanes 1 and 2), the levels of which were further increased under COP1 expression (iii, compare lanes 1–4). We also examined the cellular level of Myc-IRS-1. Interestingly, a decrease in the level of Myc-IRS-1 under COP1 expression was observed (Fig. 3B, iv, compare lanes 1 and 2 and 3 and 4). It is known that prolonged insulin signaling activation leads to degradation of IRS-1 because of serine phosphorylation of IRS-1 by MAPK activated by insulin (46). The decrease in the level of Myc-IRS-1 reflects the likelihood that COP1 expression constitutively activates insulin signaling. We also examined Akt phosphorylation at Ser-473. Consistent with the view that COP1 promotes Akt activation in Fao cells, COP1 promoted Akt phosphorylation (Fig. 3B, v) without affecting the level of cellular Akt (iv).
To further study the observation that COP1 regulates tyrosine phosphorylation of IR and IRS, Fao cells were transduced with adenoviral vectors expressing either luciferase shRNA (as a control) or COP1 shRNA. Then the tyrosine phosphorylation of IR and IRS-2 was examined through a Western blot analysis after these cells were treated with insulin. As shown in Fig. 3C, insulin increased the tyrosine phosphorylation of IR and IRS-2 in the control cells (i and ii, lanes 1–3) in a time-dependent manner. Relative to the control cells, Fao cells that expressed COP1 shRNA showed less insulin-induced tyrosine phosphorylation of both IR and IRS-2 (Fig. 3C, i and ii, lanes 4–6). As expected, COP1 shRNA reduced phosphorylation levels of Akt (Fig. 3C, iv) and ERK (vi) without altering total cellular levels of IR (iii), Akt (v), or ERK (vii).
In these experiments, we also treated Fao cells with different doses (0, 0.1, 0.3, 1, 10, and 100 nm) of insulin. As shown in Fig. 3D, insulin induced tyrosine phosphorylation of IR and IRS-2 in a dose-dependent manner (i and iii, lanes 1–6). Expression of COP1 shRNA decreased tyrosine phosphorylation of both IR and IRS-2 regardless of the dosage of insulin used (Fig. 3D, i and iii, compare lanes 1–6 to 7–12, respectively) without altering the cellular levels of IR or IRS-2 (ii and iv).
We also examined the phosphorylation of Akt and ERK and observed that insulin promoted the phosphorylation of both Akt and ERK dose-dependently and that the expression of COP1 shRNA impairs the phosphorylation of both Akt and ERK in response to different doses of insulin (Fig. 3D, v and vii) without altering cellular levels of Akt and ERK (vi and viii). Quantitative analysis of the levels of IRβ, IRS-2, and Akt phosphorylation in cells treated with lower dosages of insulin is presented in Fig. 3E, which clearly shows differing levels of phosphorylation under the expression of COP1 shRNA (i, ii, and iii, respectively). Collectively, these data demonstrate that COP1 regulates the tyrosine phosphorylation of IR and, consequently, also regulates IRS phosphorylation and PI3K activation.
COP1 Interacts with PTP1B and Suppresses PTP1B Phosphatase Activity
The extent of IR tyrosine phosphorylation is controlled by the reciprocal actions of IR tyrosine kinase and protein tyrosine phosphatase PTP1B (47, 48). Because it is unlikely that COP1 mimics insulin in binding to IR to stimulate IR-intrinsic kinase activity, we considered the possibility that COP1 modulates PTP1B activity.
Studies of COP1-interacting proteins in plants and mammals have established the peptide sequence D/EXXVPD/EXG/P (where X is any amino acid residue) as the binding motif of COP1 (5, 6). There is a potential COP1 binding motif in PTP1B (amino acid residues 180–186 PDFGVPESPA in human PTP1B) (Fig. 4A), implying that PTP1B interacts with COP1. To test this, a co-IP assay was first carried out with HEK293 cell lysates expressing FLAG-tagged COP1. HEK293 cells were used here because these cells are easily transfected and endogenously express PTP1B. As shown in Fig. 4B, an anti-PTP1B immunoreactive protein with an apparent molecular mass of around 50 kD was detected in the anti-FLAG immunoprecipitates from the cell lysates that contained FLAG-COP1 but not in control samples (compare lanes 1 and 2, top panel).
FIGURE 4.

COP1 interacts with PTP1B and suppresses PTP1B phosphatase activity. A, schematic presentation of the putative COP1 interaction motif in PTP1B. The COP1 interaction motif in c-Jun, Jun-D, TRB1, TRB2, TRB3, and Hy5 are indicated. The numbers indicate the motif in each protein. The consensus sequence is shown at the top. B, association of COP1 with PTP1B. HEK293 cells were transiently transfected with FLAG-COP1 or an empty vector. 36 h post-transfection, the total cell lysates were prepared for co-IP (IP) with anti-FLAG-M2 affinity gel. Then, anti-FLAG immunoprecipitates were subjected to Western blot analysis (IB) with anti-PTP1B antibody (top panel). Meanwhile, the total cell lysates were also subjected to Western blot analysis with anti-PTP1B (center panel), and anti-FLAG (bottom panel, for FLAG-COP1 expression) antibodies. C, coimmunoprecipitation assay showing that the Asp-181 of PTP1B is required for the interaction between COP1 and PTP1B. HEK293 cells were cotransfected with HA-tagged PTP1B (wild-type or D181A-PTP1B) plus FLAG-tagged-COP1 expression vectors. The FLAG-tagged-COP1 was immunoprecipitated 36 h post-transfection and subjected to Western blot analysis with anti-HA antibody (top panel). The levels of HA-tagged PTP1B and FLAG-tagged COP1 in the total cell lysates are shown in center and bottom panels, respectively. D, coimmunoprecipitation assay of total liver extracts with anti-PTP1B antibody to show the association between endogenous COP1 and PTP1B. Total liver extracts were prepared from a two-month-old male mouse and immunoprecipitated with anti-PTP1B antibody. The anti-PTP1B immunoprecipitates were immunoblotted with anti-COP1 antibody (i). The input levels of COP1 and PTP1B are shown in ii and iii. vi shows the immunoprecipitated PTP1B with the membrane from i stripped and reprobed with anti-PTP1B antibody. In this experiment, anti-actin antibody was used as a control. This experiment was repeated three times with similar results. Only representative results are shown. E, in vitro phosphatase assay showing that COP1 suppresses PTP1B phosphatase activity. HA-tagged PTP1B (wild-type or phosphatase-inactive C215S PTP1B) were transiently transfected into HEK293 cells with or without FLAG-tagged COP1 (wild-type or E3 ligase-defective). 36 h post-transfection, HA-tagged PTP1B was immunoprecipitated for a phosphatase assay as indicated under “Experimental Procedures.” The A420 values were normalized to total cellular proteins. Bars represents means ± S.D. (n = 3). *, p < 0.012; **, p < 0.017. PI, phosphatase inactive C215S PTP1B; E-, E3 ligase-defective.
To determine whether the potential COP1 binding motif is required for the interaction of PTP1B with COP1, the association of COP1 with D181A-PTP1B in which Asp-181 was substituted with alanine was assessed. As shown in Fig. 4C, substitution of Asp-181 with alanine impaired the interaction between COP1 and PTP1B (top panel, compare lanes 2 and 3).
We next carried out a co-IP assay with total liver extracts using an anti-PTP1B antibody. Shown in Fig. 4D, COP1 was recovered from anti-PTP1B immunoprecipitates but not from control anti-actin (Fig. 4D, i, compare lanes 1 and 2). This result was not due to sample variations because comparable levels of COP1 and PTP1B were detected in all specimens (Fig. 4D, ii and iii). We also assessed the levels of PTP1B in immunoprecipitates and observed that PTP1B was only detected in the anti-PTP1B immunoprecipitates (Fig. 4D, iv, compare lanes 1 and 2), demonstrating the specificity of the anti-PTP1B antibody. Together, these results demonstrate that COP1 is associated with PTP1B.
Asp-181 is the key amino acid residue for PTP1B phosphatase activity, and substitution of Asp-181 with an alanine residue resulted in a phosphatase defected form of PTP1B (D181A-PTP1B) (49). The involvement of Asp-181 in the interaction of PTP1B with COP1 suggests that COP1 could modulate PTP1B activity. To test this, HA-tagged PTP1B was transiently transfected into HEK293 cells with either an empty vector or a vector that expresses COP1. Then HA-PTP1B was immunoprecipitated from these cells, and the phosphatase activity associated with HA-PTP1B immunoprecipitates was determined through a phosphatase assay. To ascertain that the measured phosphatase activity is from PTP1B, the phosphatase activity of phosphatase-defective HA-C215S-PTP1B immunoprecipitates was first determined. As shown in Fig. 4E, the phosphatase activity of HA-PTP1B immunoprecipitates was 20 times higher than that of HA-C215S-PTP1B, arguing that the measured phosphatase activity was from PTP1B. Forcing expression of COP1 decreased the phosphatase activity associated with HA-PTP1B immunoprecipitates more than 70%. Similar results were obtained with E-COP1 expression. Thus, the ability of COP1 to inhibit PTP1B is independent of its E3 ligase activity, supporting the view (Fig. 2A) that enhancement of insulin signaling by COP1 is independent of COP1 E3 ligase activity.
To further examine the modulation of PTP1B activity by COP1, we next produced bacteria-recombinant GST-COP1 and 6× His-tagged PTP1B. With these recombinant peptides, we first carried out a GST pull-down assay. As shown in Fig. 5A, His-tagged PTP1B was retained on GST-COP1 but not GST alone (i, compare lanes 1 and 2), despite the higher amounts of GST peptide in comparison to GST-COP1 fusion peptides (ii, compare lanes 1 and 2). Next, we carried out a similar assay using recombinant COP1 and total cell lysates from Fao cells and HEK293 cells. As shown in Fig. 5B, endogenous PTP1B from both Fao cells and HEK 293 cells was retained on GST-COP1 beads but not on beads with GST alone (top panel, compare lanes 1 and 2 and 3 and 4).
FIGURE 5.

COP1 physically interacts with PTP1B. A, GST pull-down assay showing that recombinant GST-COP1 interacts with 6× His-tagged PTP1B. Top panel, PTP1B retained on GST beads. Center panel, input level of His-tagged PTP1B. Bottom panel, input levels of GST and GST-COP1 (stained with Sypro Ruby). IB, immunoblot. B, GST pull-down assay showing that recombinant GST-COP1 interacts with endogenous PTP1B from Fao (lanes 1–2) or HEK293 cells (lanes 3–4). Top panel, PTP1B retained on GST beads. Bottom panel, input levels of PTP1B. C, recombinant GST-COP1 suppresses His-tagged-PTP1B activity. The phosphatase assay was carried out as in Fig. 4E, except that equal amounts of recombinant His-tagged-PTP1B and GST-COP1 fusion proteins were used. Lane 1, control; GST (200 ng) alone without His-PTP1B. Lane 2, PTP1B (100 ng) plus GST (100 ng). Lane 3, His-PTP1B (100 ng) plus GST-COP1 (100 ng). The PTP1B phosphatase activity without GST-COP1 (lane 2) was set at 1.0. Bars represent means ± S.D. (n = 3). *, p < 0.02.
The association of recombinant GST-COP1 with His-tagged-PTP1B suggests that GST-COP1 could suppress His-tagged-PTP1B phosphatase activity. To test this, we examined the impact of GST-COP1 on His-tagged-PTP1B phosphatase activity. As shown in Fig 5C, incubation of GST-COP1 with His-tagged-PTP1B decreased His-tagged-PTP1B phosphatase activity toward p-nitrophenyl phosphate. Collectively, these results demonstrate that COP1 physically interacts with PTP1B and negatively regulates PTP1B activity.
COP1 Impedes the Association between IR and PTP1B
PTP1B dephosphorylation of IRβ depends on the interaction of PTP1B with IRβ and PTP1B phosphatase activity (50–52). Because COP1 interacts with PTP1B (Fig. 4), we wondered whether COP1 could influence the interaction between IR and PTP1B. To test this, Fao cells were transduced with adenoviral vectors expressing GFP, wild-type COP1, and E3 ligase-defective COP, respectively, and treated with insulin for 15 min. Then PTP1B was immunoprecipitated, and the presence of IRβ in anti-PTP1B immunoprecipitates was assessed in a Western blot analysis with an anti-IR antibody. As shown in Fig. 6, IRβ was readily detected in anti-PTP1B immunoprecipitates, the levels of which were increased (i, compare lanes 1 and 2) following insulin treatment, as reported previously (51, 52). The expression of either COP1 or E-COP1 reduced the amounts of IRβ in anti-PTP1B immunoprecipitates (Fig. 6, i, compare lanes 2, 4, and 6) without affecting the cellular levels of IRβ (ii) and PTP1B (iii and iv). Next, we examined Akt phosphorylation in these samples. As shown in Fig. 2, COP1 expression consistently enhanced Akt phosphorylation (v) without affecting the cellular levels of Akt (vi). In these experiments, we also examined the presence of COP1 in anti-PTP1B immunoprecipitates. We observed that both wild-type and E-COP1 were detected in PTP1B immunoprecipitates (Fig. 6, vii, lanes 3 and 5). Interestingly, the amount of COP1 associated with anti-PTP1B immunoprecipitates was increased following insulin stimulation, raising the possibility that the association between COP1 and PTP1B might be regulated by insulin. Fig. 6, viii shows HA-COP1 expressed from adenoviral vectors transduced into Fao cells.
FIGURE 6.

COP1 impedes the association of PTP1B and the insulin receptor. Fao cells transduced with GFP, HA-COP1, and HA-E-COP1 expressing adenoviral expression vectors, respectively, were serum-deprived overnight followed by 100 nm insulin (Ins) treatment for 15 min. The total cell lysates were subjected to immunoprecipitation (IP) with anti-PTP1B antibody, and the anti-PTP1B immunoprecipitates were immunoblotted (IB) with anti-IR antibody (i), anti-PTP1B antibody (iii), and anti-HA-COP1 antibody (vii). The input levels of IR and PTP1B are shown in ii and iv, respectively. The phospho-Akt at Ser-473, total Akt, and HA-tagged COP1 expressed from adenoviral (Adeno) vectors are shown in v, vi and viii. Shown are representative results from three repeated experiments.
COP1 Selectively Enhances Tyrosine Receptor Kinase Signaling
Other than IR, PTP1B also dephosphorylates other tyrosine kinase receptors, such as EGFR (52–54). Thus, we assessed the impact of COP1 on the phosphorylation of Akt and ERK by EGF and insulin in HepG2 cells. As shown in Fig. 7, insulin and EGF promoted ERK phosphorylation, which were further increased under COP1 expression (iii, lanes 1-3 and 5–7). EGF induced minimum Akt phosphorylation that specifically increased under COP1 expression (Fig. 7, i, lanes 1, 3, 5, and 7). As expected, COP1 expression enhanced Akt phosphorylation induced by insulin (Fig. 7, i, lanes 1, 2, 5, and 6). Comparable levels of Akt and ERK were observed in each lane (Fig. 7, ii and iv), and COP1 was exogenously expressed (v), ruling out the potential sample variation. Collectively, these data demonstrate that COP1 augments both insulin and EGF signaling.
FIGURE 7.
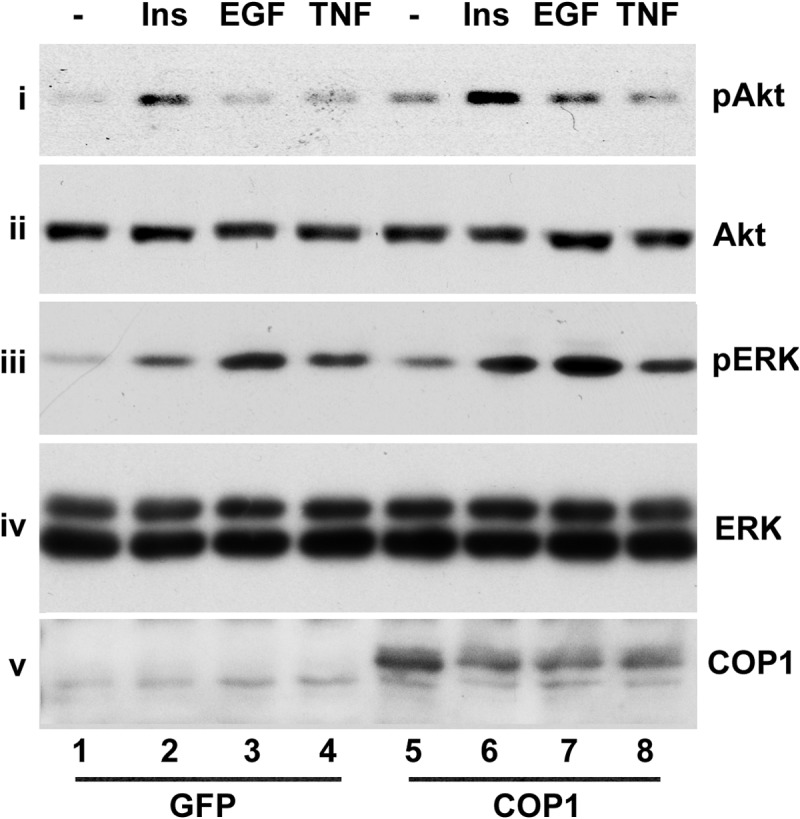
COP1 enhances Akt and ERK activation by insulin and EGF but not TNFα. HepG2 cells transduced with either GFP or HA-COP1-expressing adenoviruses were serum-deprived overnight. Then the total cell lysates were prepared after the cells were treated with 150 nm insulin (Ins), 25 ng/ml EGF, and 10 μg/ml TNFα for 30 min, respectively, for Western blot analysis with anti-phospho-Akt at Ser-473 (i), anti-Akt (ii), anti-phospho-ERK (iii), anti-ERK (iv), and anti-COP1 antibodies (v), respectively. Shown are representative results from experiments repeated three times with similar results.
In these experiments, we also treated cells with TNFα. Although TNFα induced ERK activation in HepG2 cells, no significant impact of COP1 on ERK activation by TNFα was observed (Fig. 7, iii, lanes 4 and 8). TNFα did not appreciably induce Akt activation in either control or COP1-expressing adenovirus-transduced HepG2 cells (Fig. 6, i, lanes 4 and 8). Tyrosine kinase and tyrosine phosphorylation are not involved in ERK activation by TNFα (55, 56). The inability of COP1 to modulate TNFα-mediated ERK activation underscores the specificity of COP1 in modulating tyrosine kinase signaling via PTP1B.
DISCUSSION
In this study, we have investigated the role of COP1 in insulin action in hepatic cells. The initial results showed that COP1 promotes the expression of insulin-inducible genes and inhibits that of insulin-suppressed genes (Fig. 1). Moreover, we also observed that COP1 enhanced Akt phosphorylation at Ser-473 (Fig. 1A). On the basis of all of the above information, we have hypothesized that COP1 directly modulates insulin signaling, thereby regulating insulin-responsive genes in hepatic cells. We consistently found that COP1 expression enhanced insulin-induced activation of Akt, the major downstream kinase of the insulin signal transduction cascade in modulating liver metabolism and that of ERK as well (Fig. 2A). This finding was corroborated further by the studies of shRNA-mediated COP1 depletion and addition of the LY294002 inhibitor, both of which diminished the impact of COP1 on Akt phosphorylation (Fig. 2, C and E).
Binding insulin to IR stimulates IR intrinsic kinase activity and activates a number of kinases, including Akt and ERK. Activation of Akt by insulin is via the IR-IRS-PI3K-Akt signal transduction pathway, whereas that of ERK is via the IR-SHC-RAF-MEK1-ERK signal transduction pathway (43, 57). Because IR is the diverged point of these two pathways, the enhancing insulin-elicited Akt and ERK phosphorylation simultaneously by COP1 argues that COP1 is involved in IR activation. We consistently found that increased COP1 expression enhanced, whereas knockdown of COP1 attenuated, IR tyrosine phosphorylation induced by insulin with subsequent changes of IR downstream signaling events, including IRS phosphorylation and IRS-PI3K association (Fig. 3). Overall, these data support the notion that COP1 augments insulin signaling via the enhancement of IR tyrosine phosphorylation.
To define the mechanism under which COP1 modulates IR activity, we focused our studies on PTP1B because PTP1B is the major IR tyrosine phosphatase and consists of a consensus COP1 binding motif (between amino acids 180 and 186 in human PTP1B). Indeed, our studies revealed that COP1 interacted with PTP1B in vivo (Fig. 4, B and D) and in vitro (Fig. 5, A and B), and as expected, the interaction of PTP1B with COP1 depends on the COP1 binding motif within PTP1B (Fig. 4C). There are more than 100 mammalian tyrosine phosphatases in the human genome (58). Among them, only PTP1B and its close homolog T cell protein tyrosine phosphatase consist of the COP1 binding motif, underscoring the specificity of interaction between COP1 and PTP1B.
The interaction of COP1 with PTP1B has a profound impact on PTP1B. It repressed PTP1B phosphatase activity (Figs. 4E and 5C) and prevented binding of PTP1B to IR (Fig. 6). Because the interaction of PTP1B with IR and PTP1B phosphatase activity are a prerequisite for PTP1B to dephosphorylate IR, these findings provide a mechanistic explanation for COP1 to potentiate insulin signaling.
On the basis of its ability to negatively regulate PTP1B activity, COP1 may also modulate other PTP1B-regulated signaling pathways, i.e. EGF signaling. We consistently found that COP1 also enhances EGF signaling in the activation of ERK and Akt (Fig. 7). Taken together, we suggest that COP1 interacts with PTP1B and that this interaction represses PTP1B phosphatase activity and blocks the association of PTP1B with IR promoted by insulin, thereby enhancing insulin signaling and insulin action.
It is noted that although COP1 interacts with PTP1B, overexpression of COP1 in cells appeared to have no influence on the expression of cellular PTP1B (Fig. 4), raising the question whether COP1 modulates PTP1B protein stability. However, in the context of COP1 silencing, the level of PTP1B indeed increased (data not shown), implying that COP1 indeed modulates PTP1B protein stability. These differential observations are in line with the studies on the regulation of c-Jun (4) and PEA3 (10) by COP1, where COP1 functions as an anchoring protein and requires Det-1 overexpression to promote degradation of c-Jun or PEA3. Further studies are required to determine whether COP1 modulates PTP1B expression.
PTP1B has been proposed as a double agent in that it suppresses insulin signaling in liver and functions as a tumor suppressor in other tissues (for reviews, see Refs. 50, 59). Recent studies of COP1 knockout mice indicated that COP1 seemed to be required for normal metabolism and yet functions as a tumor suppressor (11). The finding that COP1 interacts with PTP1B and represses PTP1B phosphatase activity is in line with these studies.
It is noteworthy that in the earlier studies COP1 was shown to repress gluconeogenetic gene expression as an E3 ubiquitin ligase for CRTC2 and FoxO1. However, these studies did not explain why COP1 could repress the expression of G6pase and PEPCK under basal conditions (7). The primary mechanism by which insulin inhibits the gene expression mediated through CRTC2 and FoxO1 is to promote their nuclear export. The finding that COP1 enhances insulin signaling implies that COP1 may promote nuclear export of these factors, thereby suppressing the expression of G6pase and PEPCK. This is a question requiring further examination.
In summary, we have identified COP1 as a potential regulator of PTP1B, the major phosphatase in the regulation of hepatic insulin signaling. Given that COP1 also regulates CRTC2 and FoxO1, two factors that are important for hepatic glucose metabolism, and that insulin is the key hormone that modulates body glucose homeostasis, it would be of merit to examine how inactivation of COP1 in vivo affects PTP1B activity and body glucose homeostasis in COP1 knockout mice.
Acknowledgments
We thank Drs. Ben Neel and Jonathan Chernoff for the gift of the PTP1B expression vectors. We also thank Mr. Matthew Du of Carnegie Mellon University for reading and editing the manuscript.
This work was supported, in whole or in part, by National Institutes of Health Grants RO1 DK084319 and R56 DK084319 (to K. D.). This work was also supported by The American Diabetes Association Career Development Award (to K. D.).
- IR
- insulin receptor
- IRS
- insulin receptor substrate
- co-IP
- coimmunoprecipitation.
REFERENCES
- 1. Yi C., Deng X. W. (2005) COP1. From plant photomorphogenesis to mammalian tumorigenesis. Trends Cell Biol. 15, 618–625 [DOI] [PubMed] [Google Scholar]
- 2. Subramanian C., Kim B. H., Lyssenko N. N., Xu X., Johnson C. H., von Arnim A. G. (2004) The Arabidopsis repressor of light signaling, COP1, is regulated by nuclear exclusion. Mutational analysis by bioluminescence resonance energy transfer. Proc. Natl. Acad. Sci. U.S.A. 101, 6798–6802 [DOI] [PMC free article] [PubMed] [Google Scholar]
- 3. Ang L. H., Deng X. W. (1994) Regulatory hierarchy of photomorphogenic loci. Allele-specific and light-dependent interaction between the HY5 and COP1 loci. Plant Cell 6, 613–628 [DOI] [PMC free article] [PubMed] [Google Scholar]
- 4. Wertz I. E., O'Rourke K. M., Zhang Z., Dornan D., Arnott D., Deshaies R. J., Dixit V. M. (2004) Human De-etiolated-1 regulates c-Jun by assembling a CUL4A ubiquitin ligase. Science 303, 1371–1374 [DOI] [PubMed] [Google Scholar]
- 5. Bianchi E., Denti S., Catena R., Rossetti G., Polo S., Gasparian S., Putignano S., Rogge L., Pardi R. (2003) Characterization of human constitutive photomorphogenesis protein 1, a RING finger ubiquitin ligase that interacts with Jun transcription factors and modulates their transcriptional activity. J. Biol. Chem. 278, 19682–19690 [DOI] [PubMed] [Google Scholar]
- 6. Qi L., Heredia J. E., Altarejos J. Y., Screaton R., Goebel N., Niessen S., Macleod I. X., Liew C. W., Kulkarni R. N., Bain J., Newgard C., Nelson M., Evans R. M., Yates J., Montminy M. (2006) TRB3 links the E3 ubiquitin ligase COP1 to lipid metabolism. Science 312, 1763–1766 [DOI] [PubMed] [Google Scholar]
- 7. Kato S., Ding J., Pisck E., Jhala U. S., Du K. (2008) COP1 functions as a FoxO1 ubiquitin E3 ligase to regulate FoxO1-mediated gene expression. J. Biol. Chem. 283, 35464–35473 [DOI] [PMC free article] [PubMed] [Google Scholar]
- 8. Dentin R., Liu Y., Koo S. H., Hedrick S., Vargas T., Heredia J., Yates J., 3rd, Montminy M. (2007) Insulin modulates gluconeogenesis by inhibition of the coactivator TORC2. Nature 449, 366–369 [DOI] [PubMed] [Google Scholar]
- 9. Li D. Q., Ohshiro K., Reddy S. D., Pakala S. B., Lee M. H., Zhang Y., Rayala S. K., Kumar R. (2009) E3 ubiquitin ligase COP1 regulates the stability and functions of MTA1. Proc. Natl. Acad. Sci. U.S.A. 106, 17493–17498 [DOI] [PMC free article] [PubMed] [Google Scholar]
- 10. Baert J. L., Monte D., Verreman K., Degerny C., Coutte L., de Launoit Y. (2010) The E3 ubiquitin ligase complex component COP1 regulates PEA3 group member stability and transcriptional activity. Oncogene 29, 1810–1820 [DOI] [PubMed] [Google Scholar]
- 11. Migliorini D., Bogaerts S., Defever D., Vyas R., Denecker G., Radaelli E., Zwolinska A., Depaepe V., Hochepied T., Skarnes W. C., Marine J. C. (2011) Cop1 constitutively regulates c-Jun protein stability and functions as a tumor suppressor in mice. J. Clin. Invest. 121, 1329–1343 [DOI] [PMC free article] [PubMed] [Google Scholar]
- 12. Vitari A. C., Leong K. G., Newton K., Yee C., O'Rourke K., Liu J., Phu L., Vij R., Ferrando R., Couto S. S., Mohan S., Pandita A., Hongo J. A., Arnott D., Wertz I. E., Gao W. Q., French D. M., Dixit V. M. (2011) COP1 is a tumour suppressor that causes degradation of ETS transcription factors. Nature 474, 403–406 [DOI] [PubMed] [Google Scholar]
- 13. White M. F. (1998) The IRS-signalling system. A network of docking proteins that mediate insulin action. Mol. Cell Biochem. 182, 3–11 [PubMed] [Google Scholar]
- 14. White M. F. (2002) IRS proteins and the common path to diabetes. Am. J. Physiol. Endocrinol. Metab. 283, E413–422 [DOI] [PubMed] [Google Scholar]
- 15. Franke T. F., Yang S. I., Chan T. O., Datta K., Kazlauskas A., Morrison D. K., Kaplan D. R., Tsichlis P. N. (1995) The protein kinase encoded by the Akt proto-oncogene is a target of the PDGF-activated phosphatidylinositol 3-kinase. Cell 81, 727–736 [DOI] [PubMed] [Google Scholar]
- 16. Cross D. A., Alessi D. R., Cohen P., Andjelkovich M., Hemmings B. A. (1995) Inhibition of glycogen synthase kinase-3 by insulin mediated by protein kinase B. Nature 378, 785–789 [DOI] [PubMed] [Google Scholar]
- 17. Kandel E. S., Hay N. (1999) The regulation and activities of the multifunctional serine/threonine kinase Akt/PKB. Exp. Cell Res. 253, 210–229 [DOI] [PubMed] [Google Scholar]
- 18. Chan T. O., Rittenhouse S. E., Tsichlis P. N. (1999) AKT/PKB and other D3 phosphoinositide-regulated kinases. Kinase activation by phosphoinositide-dependent phosphorylation. Annu. Rev. Biochem. 68, 965–1014 [DOI] [PubMed] [Google Scholar]
- 19. Alessi D. R., James S. R., Downes C. P., Holmes A. B., Gaffney P. R., Reese C. B., Cohen P. (1997) Characterization of a 3-phosphoinositide-dependent protein kinase which phosphorylates and activates protein kinase Bα. Curr. Biol. 7, 261–269 [DOI] [PubMed] [Google Scholar]
- 20. Sarbassov D. D., Guertin D. A., Ali S. M., Sabatini D. M. (2005) Phosphorylation and regulation of Akt/PKB by the rictor-mTOR complex. Science 307, 1098–1101 [DOI] [PubMed] [Google Scholar]
- 21. Yang Q., Inoki K., Ikenoue T., Guan K. L. (2006) Identification of Sin1 as an essential TORC2 component required for complex formation and kinase activity. Genes Dev. 20, 2820–2832 [DOI] [PMC free article] [PubMed] [Google Scholar]
- 22. Jacinto E., Facchinetti V., Liu D., Soto N., Wei S., Jung S. Y., Huang Q., Qin J., Su B. (2006) SIN1/MIP1 maintains rictor-mTOR complex integrity and regulates Akt phosphorylation and substrate specificity. Cell 127, 125–137 [DOI] [PubMed] [Google Scholar]
- 23. Dummler B., Hemmings B. A. (2007) Physiological roles of PKB/Akt isoforms in development and disease. Biochem. Soc. Trans. 35, 231–235 [DOI] [PubMed] [Google Scholar]
- 24. Cho H., Mu J., Kim J. K., Thorvaldsen J. L., Chu Q., Crenshaw E. B., 3rd, Kaestner K. H., Bartolomei M. S., Shulman G. I., Birnbaum M. J. (2001) Insulin resistance and a diabetes mellitus-like syndrome in mice lacking the protein kinase Akt2 (PKB β). Science 292, 1728–1731 [DOI] [PubMed] [Google Scholar]
- 25. George S., Rochford J. J., Wolfrum C., Gray S. L., Schinner S., Wilson J. C., Soos M. A., Murgatroyd P. R., Williams R. M., Acerini C. L., Dunger D. B., Barford D., Umpleby A. M., Wareham N. J., Davies H. A., Schafer A. J., Stoffel M., O'Rahilly S., Barroso I. (2004) A family with severe insulin resistance and diabetes due to a mutation in AKT2. Science 304, 1325–1328 [DOI] [PMC free article] [PubMed] [Google Scholar]
- 26. Tonks N. K. (2003) PTP1B: from the sidelines to the front lines! FEBS Lett. 546, 140–148 [DOI] [PubMed] [Google Scholar]
- 27. Liang F., Lee S. Y., Liang J., Lawrence D. S., Zhang Z. Y. (2005) The role of protein-tyrosine phosphatase 1B in integrin signaling. J. Biol. Chem. 280, 24857–24863 [DOI] [PubMed] [Google Scholar]
- 28. Dubé N., Tremblay M. L. (2005) Involvement of the small protein tyrosine phosphatases TC-PTP and PTP1B in signal transduction and diseases. From diabetes, obesity to cell cycle, and cancer. Biochim. Biophys. Acta 1754, 108–117 [DOI] [PubMed] [Google Scholar]
- 29. Zhang Z. Y., Lee S. Y. (2003) PTP1B inhibitors as potential therapeutics in the treatment of type 2 diabetes and obesity. Expert Opin. Investig. Drugs 12, 223–233 [DOI] [PubMed] [Google Scholar]
- 30. Elchebly M., Payette P., Michaliszyn E., Cromlish W., Collins S., Loy A. L., Normandin D., Cheng A., Himms-Hagen J., Chan C. C., Ramachandran C., Gresser M. J., Tremblay M. L., Kennedy B. P. (1999) Increased insulin sensitivity and obesity resistance in mice lacking the protein tyrosine phosphatase-1B gene. Science 283, 1544–1548 [DOI] [PubMed] [Google Scholar]
- 31. Delibegovic M., Bence K. K., Mody N., Hong E. G., Ko H. J., Kim J. K., Kahn B. B., Neel B. G. (2007) Improved glucose homeostasis in mice with muscle-specific deletion of protein-tyrosine phosphatase 1B. Mol. Cell. Biol. 27, 7727–7734 [DOI] [PMC free article] [PubMed] [Google Scholar]
- 32. Du K., Herzig S., Kulkarni R. N., Montminy M. (2003) TRB3. A tribbles homolog that inhibits Akt/PKB activation by insulin in liver. Science 300, 1574–1577 [DOI] [PubMed] [Google Scholar]
- 33. Ding J., Kato S., Du K. (2008) PI3K activates negative and positive signals to regulate TRB3 expression in hepatic cells. Exp. Cell Res. 314, 1566–1574 [DOI] [PubMed] [Google Scholar]
- 34. Du K., Ding J. (2009) Insulin regulates TRB3 and other stress-responsive gene expression through induction of C/EBPβ. Mol. Endocrinol. 23, 475–485 [DOI] [PMC free article] [PubMed] [Google Scholar]
- 35. Matsumoto M., Han S., Kitamura T., Accili D. (2006) Dual role of transcription factor FoxO1 in controlling hepatic insulin sensitivity and lipid metabolism. J. Clin. Invest. 116, 2464–2472 [DOI] [PMC free article] [PubMed] [Google Scholar]
- 36. Alessi D. R., Cohen P. (1998) Mechanism of activation and function of protein kinase B. Curr. Opin. Genet. Dev. 8, 55–62 [DOI] [PubMed] [Google Scholar]
- 37. Foretz M., Guichard C., Ferré P., Foufelle F. (1999) Sterol regulatory element binding protein-1c is a major mediator of insulin action on the hepatic expression of glucokinase and lipogenesis-related genes. Proc. Natl. Acad. Sci. U.S.A. 96, 12737–12742 [DOI] [PMC free article] [PubMed] [Google Scholar]
- 38. Shimomura I., Bashmakov Y., Ikemoto S., Horton J. D., Brown M. S., Goldstein J. L. (1999) Insulin selectively increases SREBP-1c mRNA in the livers of rats with streptozotocin-induced diabetes. Proc. Natl. Acad. Sci. U.S.A. 96, 13656–13661 [DOI] [PMC free article] [PubMed] [Google Scholar]
- 39. Kim S. Y., Kim H. I., Kim T. H., Im S. S., Park S. K., Lee I. K., Kim K. S., Ahn Y. H. (2004) SREBP-1c mediates the insulin-dependent hepatic glucokinase expression. J. Biol. Chem. 279, 30823–30829 [DOI] [PubMed] [Google Scholar]
- 40. Yoon J. C., Puigserver P., Chen G., Donovan J., Wu Z., Rhee J., Adelmant G., Stafford J., Kahn C. R., Granner D. K., Newgard C. B., Spiegelman B. M. (2001) Control of hepatic gluconeogenesis through the transcriptional coactivator PGC-1. Nature 413, 131–138 [DOI] [PubMed] [Google Scholar]
- 41. Daitoku H., Yamagata K., Matsuzaki H., Hatta M., Fukamizu A. (2003) Regulation of PGC-1 promoter activity by protein kinase B and the forkhead transcription factor FKHR. Diabetes 52, 642–649 [DOI] [PubMed] [Google Scholar]
- 42. Vanhaesebroeck B., Alessi D. R. (2000) The PI3K-PDK1 connection. More than just a road to PKB. Biochem. J. 346, 561–576 [PMC free article] [PubMed] [Google Scholar]
- 43. Saltiel A. R., Pessin J. E. (2002) Insulin signaling pathways in time and space. Trends Cell. Biol. 12, 65–71 [DOI] [PubMed] [Google Scholar]
- 44. Baumann C. A., Saltiel A. R. (2001) Spatial compartmentalization of signal transduction in insulin action. BioEssays 23, 215–222 [DOI] [PubMed] [Google Scholar]
- 45. Brondello J. M., Brunet A., Pouysségur J., McKenzie F. R. (1997) The dual specificity mitogen-activated protein kinase phosphatase-1 and -2 are induced by the p42/p44MAPK cascade. J. Biol. Chem. 272, 1368–1376 [DOI] [PubMed] [Google Scholar]
- 46. Wing S. S. (2008) The UPS in diabetes and obesity. BMC Biochem. 9, S6. [DOI] [PMC free article] [PubMed] [Google Scholar]
- 47. Goldstein B. J., Ahmad F., Ding W., Li P. M., Zhang W. R. (1998) Regulation of the insulin signalling pathway by cellular protein-tyrosine phosphatases. Mol. Cell. Biochem. 182, 91–99 [PubMed] [Google Scholar]
- 48. Bandyopadhyay D., Kusari A., Kenner K. A., Liu F., Chernoff J., Gustafson T. A., Kusari J. (1997) Protein-tyrosine phosphatase 1B complexes with the insulin receptor in vivo and is tyrosine-phosphorylated in the presence of insulin. J. Biol. Chem. 272, 1639–1645 [DOI] [PubMed] [Google Scholar]
- 49. Flint A. J., Tiganis T., Barford D., Tonks N. K. (1997) Development of “substrate-trapping” mutants to identify physiological substrates of protein tyrosine phosphatases. Proc. Natl. Acad. Sci. U.S.A. 94, 1680–1685 [DOI] [PMC free article] [PubMed] [Google Scholar]
- 50. Yip S. C., Saha S., Chernoff J. (2010) PTP1B. A double agent in metabolism and oncogenesis. Trends Biochem. Sci. 35, 442–449 [DOI] [PMC free article] [PubMed] [Google Scholar]
- 51. Seely B. L., Staubs P. A., Reichart D. R., Berhanu P., Milarski K. L., Saltiel A. R., Kusari J., Olefsky J. M. (1996) Protein tyrosine phosphatase 1B interacts with the activated insulin receptor. Diabetes 45, 1379–1385 [DOI] [PubMed] [Google Scholar]
- 52. Stuible M., Tremblay M. L. (2010) In control at the ER. PTP1B and the down-regulation of RTKs by dephosphorylation and endocytosis. Trends Cell Biol. 20, 672–679 [DOI] [PubMed] [Google Scholar]
- 53. Eden E. R., White I. J., Futter C. E. (2009) Down-regulation of epidermal growth factor receptor signalling within multivesicular bodies. Biochem. Soc. Trans. 37, 173–177 [DOI] [PubMed] [Google Scholar]
- 54. Faure R., Baquiran G., Bergeron J. J., Posner B. I. (1992) The dephosphorylation of insulin and epidermal growth factor receptors. Role of endosome-associated phosphotyrosine phosphatase(s). J. Biol. Chem. 267, 11215–11221 [PubMed] [Google Scholar]
- 55. Darnay B. G., Aggarwal B. B. (1997) Early events in TNF signaling. A story of associations and dissociations. J. Leukocyte Biol. 61, 559–566 [DOI] [PubMed] [Google Scholar]
- 56. Baker S. J., Reddy E. P. (1998) Modulation of life and death by the TNF receptor superfamily. Oncogene 17, 3261–3270 [DOI] [PubMed] [Google Scholar]
- 57. Avruch J. (1998) Insulin signal transduction through protein kinase cascades. Mol. Cell Biochem. 182, 31–48 [PubMed] [Google Scholar]
- 58. Alonso A., Sasin J., Bottini N., Friedberg I., Friedberg I., Osterman A., Godzik A., Hunter T., Dixon J., Mustelin T. (2004) Protein tyrosine phosphatases in the human genome. Cell 117, 699–711 [DOI] [PubMed] [Google Scholar]
- 59. Lessard L., Stuible M., Tremblay M. L. (2010) The two faces of PTP1B in cancer. Biochim. Biophys. Acta 1804, 613–619 [DOI] [PubMed] [Google Scholar]