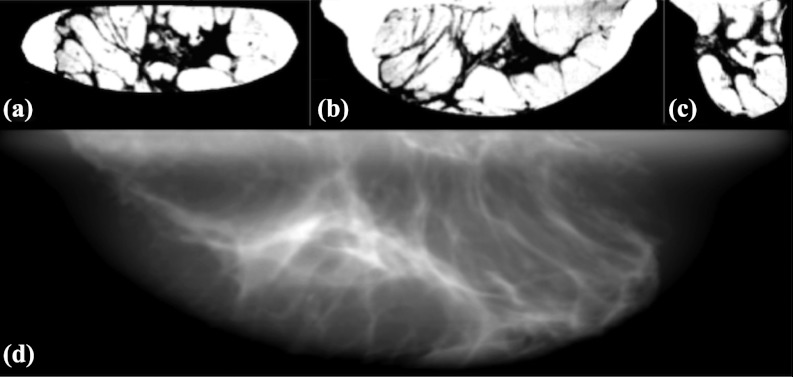
Abstract
Purpose: In the research and development of dedicated tomographic breast imaging systems, digital breast object models, also known as digital phantoms, are useful tools. While various digital breast phantoms do exist, the purpose of this study was to develop a realistic high-resolution model suitable for simulating three-dimensional (3D) breast imaging modalities. The primary goal was to design a model capable of producing simulations with realistic breast tissue structure.
Methods: The methodology for generating an ensemble of digital breast phantoms was based on imaging surgical mastectomy specimens using a benchtop, cone-beam computed tomography system. This approach allowed low-noise, high-resolution projection views of the mastectomy specimens at each angular position. Reconstructions of these projection sets were processed using correction techniques and diffusion filtering prior to segmentation into breast tissue types in order to generate phantoms.
Results: Eight compressed digital phantoms and 20 uncompressed phantoms from which an additional 96 pseudocompressed digital phantoms with voxel dimensions of 0.2 mm3 were generated. Two distinct tissue classification models were used in forming breast phantoms. The binary model classified each tissue voxel as either adipose or fibroglandular. A multivalue scaled model classified each tissue voxel as percentage of adipose tissue (range 1%–99%). Power spectral analysis was performed to compare simulated reconstructions using the breast phantoms to the original breast specimen reconstruction, and fits were observed to be similar.
Conclusions: The digital breast phantoms developed herein provide a high-resolution anthropomorphic model of the 3D uncompressed and compressed breast that are suitable for use in evaluating and optimizing tomographic breast imaging modalities. The authors believe that other research groups might find the phantoms useful, and therefore they offer to make them available for wider use.
Keywords: breast CT, tomosynthesis, mammography, phantom, simulation
INTRODUCTION
Enabled by the emergence of digital flat-panel detectors (FPDs), industry and academic research groups including ours at the University of Massachusetts Medical School (UMMS), are actively investigating dedicated breast computed tomography (BCT).1, 2, 3, 4, 5, 6, 7, 8 Along with this novel breast imaging modality another technique, breast tomosynthesis (BT) can also provide tomographic information and has been approved for clinical use in the United States. There will inevitably be interest in continuing the improvement and optimization of both modalities. As suggested by Barrett and Myers,9 any meaningful approach to optimizing an imaging system must include a definition of: (1) the specific task to be performed, (2) the observer (i.e., human or numerical), (3) an object model representing the objects to be imaged, and (4) a figure-of-merit used to evaluate task performance. This paper focuses on the third item; more specifically, the development of digital breast object models, commonly known as phantoms, for both BCT and BT.
A number of breast object phantoms have been previously proposed.10, 11, 12, 13, 14, 15 Such phantoms have been used to evaluate a wide range of tasks, including the optimization and development of imaging modalities,16 evaluation of acquisition and reconstruction methods,17, 18 the study of human observer performance,19, 20 the development of mammography computer aided detection (CAD) algorithms,21 dosimetry calculations,22 and quality control/training.23 Previous digital phantoms were generated either by numerical techniques or synthesis from existing clinical images, as well as a hybrid of those two fundamental techniques. During the development of 2D mammography some of the earliest object analytical models synthesized 2D nonuniform breast background using numerical techniques such as power-law noise,19, 24 lumpy background,25 and clustered lumpy background.26 All these computationally tractable models could produce numerous independent simulated projections with variable, statistically modeled tissue structures similar to typical mammograms. A second approach was based on digitizing film mammograms.19 This approach resulted in libraries developed by individual researchers and at least one widely available shared library, the Digital Database for Screening Mammograms (DDSM) maintained at the University of South Florida.27 However, these 2D models and methods are somewhat inadequate as tools to optimize three-dimensional (3D) breast imaging modalities; therefore, it was natural that 3D models have been developed. One of earliest 3D breast models discussed in the literature was a mathematical model of a breast for use in the study of stereo-mammography.10 Taylor et al.11 introduced another 3D model of the breast and a model of the x-ray formation process in order to create a tool to test automated breast segmentation. Bakic et al.12, 13, 14 described a method for simulating mammograms based on 3D breast tissue distributions observed from histological breast slices. The Bakic model allows for variable parameterization of adipose structures and glandular ducts. Bliznakova et al.15 presented another methodology for producing a noncompressed 3D breast model. All of the aforementioned 3D breast object models have useful properties; yet, their visual realism, when compared to actual patient tomographic breast reconstructions, can be lacking. Li et al.28 have developed a methodology for generating 3D breast phantoms based on patient breast CT images acquired in a recent clinical trial. This approach produces very realistic breast phantoms, however, we speculate that due to radiation dose constraints, patient breast CT images may likely be noisy and thus it may be challenging to accurately define small structures within the breast.
In this paper, we discuss our efforts to generate an ensemble of voxelized breast phantoms based on low-noise CT scans of surgical mastectomy specimens using a benchtop breast CT scanner.
METHODS
Description of benchtop BCT system
A prototype, benchtop CT breast imaging (CTBI) system shown in Fig. 1 has been utilized for several years at the UMMS Tomographic Breast Imaging Lab (TBIL). The system was assembled with standard, commercially available hardware components. These include a FPD, an x-ray source and a rotary-stage. The FPD is a PaxScan 2520C (Varian Medical Systems, Salt Lake City, UT). This indirect conversion detector consists of a thallium-doped cesium iodide (CsI:Tl) scintillator coupled to a large amorphous silicon (a-Si) pixelated array. In the unbinned configuration, the frame size is 1536 × 1920 pixels with pixel pitch dimension of 0.127 mm2. The maximum acquisition rate of the FPD in this full-frame configuration is 7.5 frames per second. The specified output range is from 0 to 4095 [12 bit range in integer 16 data format referred to as Digital Units (DU)]. A vendor acknowledged anomaly in our early version FPD (Ref. 29) renders the most significant bit ambiguous; therefore, any DU value greater than 11 bits (DU 2047) might indicate saturation. This anomaly reduced the reliable dynamic range of the FPD and therefore limited the x-ray technique below the maximum specification. For this research, the 11 bit dynamic range of the FPD was the limiting factor in acquiring ultra low-noise CT acquisitions.
Figure 1.
University of Massachusetts Medical School (UMMS) prototype breast imaging system.
The x-ray source is a model Rad-94 tube enclosed in a Sapphire housing (Varian Medical Systems, Salt Lake City, UT) with a 100 mm, 150 kV, 450 kJ rotating anode, and a 14° tungsten rhenium molybdenum graphite target. While the x-ray tube initially had the capability of operating at focal spot size of either 0.4 or 0.8 mm, during our research the smaller filament became inoperable; therefore, a number of acquisitions were made with the larger focal spot size. The x-ray tube of the system is well suited to operate at lower kVp settings (e.g., 40–50 kVp) under CT workload. A 50 kW radiographic generator controlled by an Indico 100 Rad Panel (CPI, Georgetown, ON, Canada) powered the x-ray source.
A VXM-2 rotary table with stepping motor controller (Velmex, Bloomfield, NY) precisely controlled the rotation of the object. Instead of rotating the source and detector as would be typical in clinical CT systems, the CTBI system rotates the object on the table. The rotary table is mounted on X-Y positioning UniSlide assemblies (Velmex) for precision adjustment of the axis of rotation (AOR).
The FPD receptor panel, x-ray source, and rotary table were attached to an optical table (Vere, Inc., New Kensington, PA). The FPD receptor panel was mounted on two precision control BiSlide (Velmex) assemblies for control of horizontal and vertical position of the detector panel. The x-ray source was mounted on a separate BiSlide assembly for precise vertical source positioning. A lead rear shield was placed on the external side of the enclosure wall behind the FPD receptor panel to provide additional attenuation of any x rays that might penetrate the enclosure.
The entire CTBI system is controlled by a PC workstation (Optiplex model, Dell, Round Rock, TX). There are two special purpose PCI-bus boards installed in the PC: a PIXCI imaging board (EPIX, Inc., Buffalo Grove, IL) and an optically isolated Input/Output (I/O) board (KPCI-PIO32IOA, Keithley, Cleveland, OH). The PIXCI imaging board is used to “grab” and buffer frames from the FPD command processor. The I/O board interfaces signals between the PC and both the FPD command processor and the x-ray controller.
All of the necessary application software, which will be subsequently described, for image acquisition and reconstruction was developed by our research group. The characterization of our benchtop CT system was previously reported.30
Acquisition of mastectomy specimens
Our image acquisition software was written in C++ using Microsoft Foundation Class (MFC) in Visual Studio.NET (Microsoft, Redmond, WA). The software integrates and synchronizes x-ray triggering, FPD image capture, stepping of the rotary stage, and image storage in order to acquire an angular projection sequence suitable for later CT reconstruction.
We have previously reported the early stages of our methodology.31, 32 This ensuing discussion focuses only on the best methodology ultimately used during the project. Under an institutional review board (IRB) approved protocol33 and with patients’ informed consent, fresh mastectomy specimens were obtained immediately following surgery and prior to tissue gross pathology. Each specimen was imaged in an appropriate sized holder, shaped so that the specimen was maintained in either a pendant position modeling uncompressed CT or in a compressed geometry to model tomosynthesis and/or mammography. Imaging a mastectomy in a holder cannot preserve realistic gross anatomical position of a breast but it does permit reconstruction of reasonably large tissue regions. The general goal for all specimen acquisitions was to capture the highest resolution, lowest noise projection set. High resolution was obtained by operating the PaxScan 2520C FPD in an unbinned mode with an x-ray technique that gave the highest exposure without saturating the detector. Because patient safety was not a consideration, acquisition at high exposures was constrained only by the FPD dynamic range, x-ray tube heat loading, and acquisition time (our research group was generally allowed 2–3 h to complete imaging of the mastectomy specimen). Since the first specimen was imaged, various x-ray techniques were used in order to improve image quality. Early on in the study, it was thought that maximization of detector dynamic range was best accomplished through use of a bowtie filter to “shape” the x-ray beam. The acquisition protocol evolved to acquiring multiple projection images at each angle using the highest exposure obtainable without use of a bowtie filter, while using the lowest attenuating holder needed to hold the specimen rigidly in place. Typical acquisition parameters were 40 kVp, 0.5 mAs for 300 projection angles over a full 360° rotation with a range of 3–10 exposures averaged at each acquisition angle. Thus, the primary method to minimize image noise was to acquire a number of projections at each tomographic angle and then average those projections. According to theory and ignoring FPD electronic noise, projection averaging should reduce pixel noise by a factor of , where N = number of projections averaged at each projection angle. To transform the raw projections prior to reconstruction, the following steps were implemented in separate MATLAB (Mathworks, Natick, MA) software: (1) flat field correction (FFC), (2) averaging of all projections acquired at each angle, (3) log normalization of the averaged image, and (4) 2 × 2 binning. The projection set is thereby transformed into a format required by our reconstruction software.
Image reconstruction
A module within our Cone Beam Simulation Software (CBSS) was used for image reconstruction. CBSS was implemented in C++ for the Linux operating system, and has been previously described.34 The reconstruction algorithm used was filtered backprojection (FBP) based on the analytical reconstruction algorithm introduced by Feldkamp, Davis, and Kress.35 FBP reconstruction requires an accurate description of the acquisition geometry in order to reconstruct an object from a set of projection images. Calibration of our prototype CTBI system followed the Noo calibration method.36 Briefly, Noo's36 analytic methodology uses a limited number of projections of small spherical objects acquired at equally spaced angular positions in one circular rotation of the spherical objects. In our implementation, the calibration objects were two 2 mm steel spheres separated by a known distance. The projections allow for an estimation of analytic parameters of two ellipses from which the prototype's scanning geometry can be accurately determined.
Processing steps prior to segmentation
A number of processing steps were applied to the reconstructed slices prior to tissue type classification of each voxel using segmentation. These operations are discussed below and include: (1) removal of specimen holder from the reconstructed image, (2) correction for cupping or inverse-cupping artifacts, and (3) reduction of noise using anisotropic diffusion filtering.
Defining breast phantom boundaries
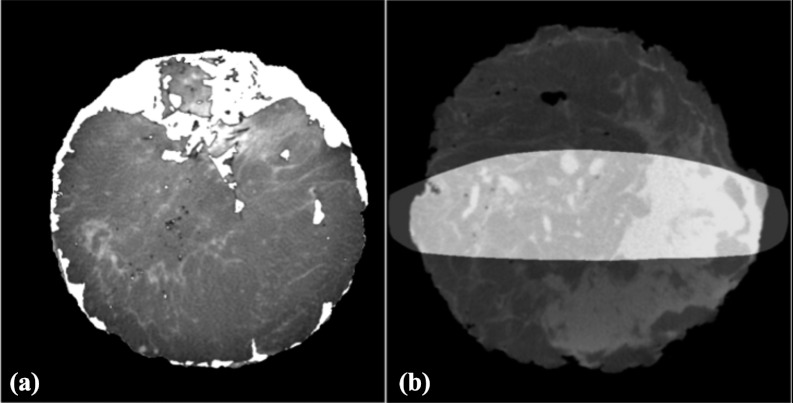
Postreconstruction processing was performed to digitally remove the specimen holder from the reconstructed image before further processing. When excised, mastectomy specimens will not inherently retain their shape and thus without support the specimen would flatten; therefore, it was necessary to place the specimen in a holder prior to imaging. After each specimen acquisition was completed, the specimen was removed, and another CT acquisition was performed to estimate the breast holder image. The reconstruction of the specimen holder was transformed into a mask that was later used to remove the specimen holder from the reconstructed image. An illustration of this step is shown in Fig. 2.
Figure 2.
Removal of holder. (a) Specimen in holder; a reconstruction of the specimen holder was used to create a mask. (b) Specimen only; achieved by masking out the holder.
Template masks are also useful following segmentation. The outer surface of a reconstructed breast specimen was often irregularly shaped, especially so in the posterior breast region (i.e., proximate to the chest wall). To generate breast phantoms with smooth boundaries, breast templates were used that defined a desired prone breast shape. The reconstruction was digitally inserted into the defined template, and missing tissue sections were “inpainted” with adipose tissue. The size of “inpainted” tissue regions approximately varied from several cubic centimeters in regions proximate to the chest wall to a few cubic millimeters on the volume periphery. In addition, small air pockets (approximately a few cubic millimeters in size) were sometimes observed within the reconstructed specimen images. These air pockets were defined using thresholding, and then subsequently “inpainted” with adipose equivalent voxels. An example of postcorrection inpainting is shown is Fig. 3a.
Figure 3.
Use of templates. (a) An uncompressed template created by morphological operations was used to fill-in or “inpaint” mastectomy regions that are missing. (b) A compressed template used to “cut out” compressed phantoms.
Another use of templates was to transform a specimen CT reconstruction acquired using a prone (uncompressed) breast holder into a pseudocompressed breast phantom. In this case, the template was based on the CT reconstruction of a commercial compressed breast phantom (CIRS, Norfolk, VA). To generate a pseudocompressed breast phantom, the specimen reconstruction (in the prone breast holder) was multiplied (pixel × pixel) by the compressed breast template (all voxels in the template were equal to 1.0). An illustration of a compressed mask template used to generate a pseudocompressed breast phantom is shown in Fig. 3b.
Note that this approach does not attempt to account for tissue deformation from compression but simply “cuts” tissue out of the uncompressed phantom and “inpaints” any missing section with adipose tissue. Since this procedure does not model compression of the tissue, it will provide a less realistic phantom hence we label these as pseudocompressed breast phantoms. However, this procedure allowed for an increase in the number of pseudocompressed breast phantoms generated. It is hypothesized that the resulting pseudocompressed breast phantoms should still be useful for some optimization problems.
Correction of cupping or inverse-cupping artifacts
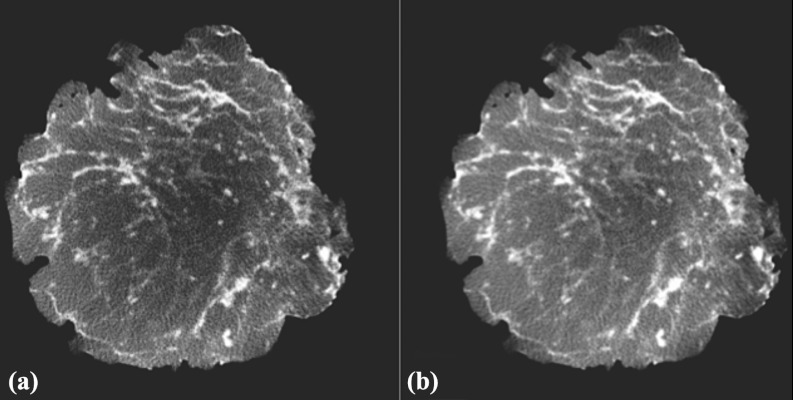
Following FBP reconstruction, postreconstruction processing was done to correct nonuniformities introduced by scatter, beam hardening, and interslice variation inherent in circular orbit, cone-beam CT using FBP.37 The methodology used to reduce the effect of these nonuniformities follows that from Altunbas et al.,38 with some minor modifications. These modifications included an accommodation for reverse-cupping when a polycarbonate resin bowtie filter was used, as well as developing a glandular tissue profile rather than adipose tissue profile for slices containing a majority of glandular voxels, and using a slice histogram to guide the development of each slice tissue profile. In Fig. 4, an example of a slice before and after correction is shown.
Figure 4.
(a) Slice prior to correction for cupping artifact. Note that the center region was darker than periphery indicating cupping. (b) Same slice following correction showing an adjusted center region.
Reduction of noise using anisotropic diffusion filtering
Even though 3–10 exposures were averaged for each projection view, CT reconstructions still retained some noise. This noise penalizes the accuracy of the segmentation process, especially so for finer thin structures. To reduce noise, without excessive blurring of edges, a nonlinear, 3D anisotropic diffusion filter (ADF) (Refs. 39 and 40) was applied to the entire reconstruction volume. The anisotropic diffusion process is defined as
| (1) |
where ∇I is the gradient of the reconstructed image (I), and ΔI is the Laplace operation on I over spatial variables. In this study, we used the diffusivity function defined by Perona and Malik40 as
| (2) |
where K is a user-defined conduction parameter that controls the sensitivity to edges. The anisotropic diffusion equation [Eq. 1] was implemented using the National Library of Medicine's open-source Insight Segmentation and Registration Toolkit (ITK) which discretizes Eq. 1 using a finite difference approach. This diffusion filter is very useful as a preprocessing step to segmentation because with properly selected parameters it can successfully reduce noise from the reconstructed images without substantial blurring of edges.
Segmentation
After postreconstruction corrections were applied, histogram-based segmentation was performed to classify each voxel as adipose tissue, fibroglandular tissue, or some combination of the two. Two methods were studied as illustrated in Fig. 5; simple binary segmentation (voxels are assigned to be either adipose or fibroglandular) or a second method, referred to as the multivalue method. The multivalue method calculated the peak histogram values for adipose and fibroglandular tissue with the values between the two peaks then linearly scaled as shown in Fig. 5. The breast phantom voxel values are then encoded to indicate to the simulation software whether each pixel is adipose, fibroglandular, or some combination of both. This encoding is based on our simulation software's method for calculating energy dependent attenuation coefficients. Each voxel value represents the fraction of adipose tissue by weight. The simulation software can then convert this information to an energy dependent linear attenuation coefficient. When simulating breast tissue, the specified voxel attenuation is then formed from a weighted combination of adipose (voxel value) and glandular (1.0-voxel value) tissue fractions. These coefficients were computed using the basis coefficients of Lucite and Aluminum as suggested by Johns and Yaffe.41
Figure 5.
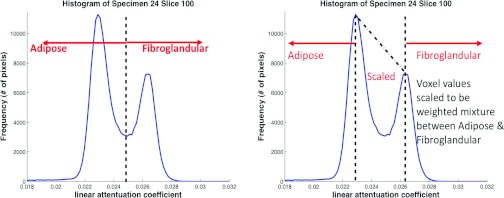
Illustration of two methods for classifying voxel values. On the left is the binary method (voxels are classified as either adipose or fibroglandular). On the right is the multivalue method in which all values to the left of the adipose peak are assigned as adipose tissue and all to the right of fibroglandular peak are assigned as fibroglandular tissue. The values between the peaks are scaled linearly as some combination of adipose and fibroglandular tissue.
Computer simulation using voxelized phantoms
We used our previously mentioned and described34 CBSS to generate projection data sets of an input voxelized breast phantom, simulating either BCT or BT acquisition geometry. In addition to modeling the imaging geometry of the benchtop CT system, CBSS models polychromatic x-ray spectra, x-ray filters, a user-defined mean glandular dose, energy-dependent x-ray transmission through the breast model using Siddon's ray-tracing algorithm,42 as well as signal and noise propagation through the FPD using a serial cascade model.43 Detector parameters were chosen to closely model our PaxScan 2520C detector. To compute energy-dependent attenuation coefficients from the segmented object, the empirical measurements of Johns and Yaffe41 were used.
After digital breast phantoms were generated, the simulation software34 was then used to produce projection sets based on those phantoms. Specifying simulation parameters as close as possible to the parameters used for the actual specimen acquisition, simulated projections based on the voxelized breast phantom were formed. This allowed for comparison of reconstructions of the simulated projections with the original specimen reconstruction from which the phantom was generated.
Power spectrum analysis was used to objectively analyze breast phantoms. As noted by Metheany,44 the anatomical structure of the breast as observed on breast CT can be described by a power law as
| (3) |
where f represents radial spatial frequency, α represents magnitude, and β is the power-law exponent. To obtain β values, the following steps were followed. Within the CT volume fifty 256 × 256 ROIs from slices in the midregion of the CT stack were extracted. Each ROI was processed separately after subtracting the ensemble mean ROI. A Hanning window was applied to the adjusted ROI, and a fast Fourier transform (FFT) was performed on the windowed-adjusted ROI. The FFT results for the entire 50 ROIs were averaged and aligned to the zero frequency in the spectrum center. This averaged FFT ROI was squared to give an average 2D power spectrum. Averaging over annuli for each radial frequency allows one to compute a one-dimensional (1D) average power spectrum. An analysis of the slope of the log-log plot of the average 1D power versus radial frequency was used to estimate β.
RESULTS
Over 70 patients gave informed consent for their mastectomies to be imaged on the prototype CT breast imaging system. Not all mastectomy specimens could be imaged for various reasons; most often the reason was limitation in imaging time in order for the mastectomy specimen to be delivered to the UMMS Pathology Department. Not all imaging resulted in specimen reconstructions that were suitable to generate breast phantoms because of breast characteristics (i.e., high percentage of adipose tissue with little glandular structure), acquisition errors, or excessive reconstruction artifacts (e.g., due to biopsy markers). The current ensemble of breast phantoms includes 20 uncompressed phantoms and eight compressed phantoms. There are 96 pseudocompressed phantoms derived from the uncompressed phantoms.
Postreconstruction processing
Figure 6 shows examples of the cupping effect [Fig. 6a], and the inverse-cupping effect [Fig. 6b] from two different specimen reconstructions. The cupping effect results mainly from the effects of beam hardening and scatter, whereas the inverse-cupping effect was typically observed when using a polycarbonate resin bowtie filter. Correction for these variations was based on method described by Altunbas et al.38 As stated in Sec. 2D2, slight modifications were made to the Altunbas method to accommodate the Lucite bowtie filter inverse-cupping and altering from a radial adipose tissue profile (RATP) to a radial glandular tissue profile (RGTP) whenever a slice had a majority of glandular pixels.
Figure 6.
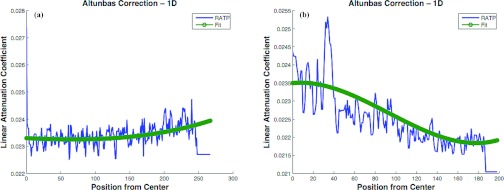
(a) Example of cupping effect. (b) Example of inverse-cupping. RATP is radial adipose tissue profile [a term described in Altunbas et al. (Ref. 38)].
While there was general similarity in the intraslice effects among all the slices in an individual specimen (i.e., all slices will be affected by either cupping or inverse-cupping), the severity of the effect varied in different regions. Increased variation occurred on either end of the specimen stack (i.e., near the chest wall on one end and near the areola on the other). This was also true for the interslice variation. Significant interslice differences can be explained by the known variation in count density in the axial direction due to Feldkamp FBP. The FBP algorithm is not an exact solution45, 46, 47, 48 and is well known to produce significant slice variation in the reconstruction volume as the acquisition cone-angle increases. Additionally, the tissue regions on either end of the “stack” vary greatly in tissue composition. For example, the breast areola region (nearest the x-ray central beam in our prototype system) is typically mostly fibroglandular, while the region farthest from the central beam (i.e., posterior breast) often had significant tissue gaps as the result of the mastectomy procedure. As an approximate guideline, 10% of slices on either end of the reconstructed “stack” show significant differences in attenuation values while attenuation between the midslices (approximately 80% of slices) varies slowly over a linear range.
Anisotropic diffusion filtering
ADF was applied after corrections for slice nonuniformities. The ADF requires selection of three operating parameters, the time step, conductance (K), and the number of iterations. The online ITK class documentation states, “… the time step is constrained at run-time to keep the solution stable. In general, the time step should be at or below , where N is the dimensionality of the image.” Using a three-dimensional ADF, a time step of (0.125) was initially used but at run-time an ITK informational message suggested using a time step of (0.0625). While there appeared to be little difference in the filter output between time step of 0.125 or 0.0625, the lesser parameter was used without further investigation. The conductance parameter defines the gradient norm value for which there should be no diffusion (i.e., no filtering across region boundaries). Thus, regions in the reconstruction with gradient norm values below K will exhibit greater noise reduction, whereas the filter will preserve edges in regions where the gradient norm values are higher than K. The ITK implementation allows the conductance to be specified with respect to the volume mean gradient magnitude. For example, if the average gradient magnitude throughout the image is 0.0003, then specifying the ITK input parameter value of 1.5 would result in a conductance value of 0.00045. To determine the filter parameters for use in preprocessing the reconstructed data prior to segmentation, a range of various conductance values and number of iterations were explored. The “best” parameters were selected based on a subjective visual impression of ROIs selected from the reconstruction. Figure 7 shows ROI images (25 images ordered in a 5 × 5 grid) filtered with conductance values of 0.1, 0.5, 2.0, 5.0, and 10.0 (different columns) with iterations of 1, 5, 10, 15, and 20 (different rows from top to bottom). For this specific case, ROI B2 (conductance = 0.5 and iterations = 5) and ROI C2 (conductance = 2 and iterations = 5) were subjectively selected based on the tradeoff between noise reduction and the ability of the filter to retain edge information. Typically, a subjective impression would be determined using a coarser grid of parameter space (as shown in Fig. 7), followed by a finer grid of ADF parameters.
Figure 7.
Illustration of 25 different ADF treatments for one ROI. ROI images are shown on a 5 × 5 selection panel. Row A is conductance = 0.1, Row B is conductance = 0.5, Row C is conductance = 2, Row D is conductance = 5, and Row E is conductance = 10. Columns 1, 2, 3, 4, 5 correspond to iterations 1, 5, 10, 15, 20, respectively. As an example B2 shows image ADF with conductance of 0.5 and 5 iterations. While the ROIs are small, one can see smoothing as one goes down and to the right.
After examining several combinations of filter parameters, the basic ADF parameters that were used in most cases were time step = 0.625, conductance = 0.5, and iterations = 5. This seemed to give good results for most specimens; however, specimens acquired at lower equivalent dose needed more filtering. After evaluating a number of these noisier specimen reconstructions, it was determined that the specimens acquired at an estimated mean glandular dose less than approximately 15 mGy required different ADF parameters. The parameters selected for those were time step = 0.0625, conductance = 1.5, and iterations = 7. Hence, there were two sets of parameters used, depending on the estimated specimen equivalent dose.
Phantom generation
Shown in Fig. 8 are reconstructed slices obtained from acquisition of a representative mastectomy specimen. The reconstruction geometry was 0.2 mm3. The slice on the left was reconstructed from an acquisition with low-dose, i.e., 2.3 mGy MGD. The center slice was reconstructed from a specimen that was acquired using ten exposures per projection view. Thus, the MGD for this acquisition was approximately 23 mGy. The image slice on the right shows this same reconstructed slice after postprocessing with ADF. Shown in Fig. 9 are plots of the histogram for the three representative images of Fig. 8. For maximum accuracy in the segmentation, it is desired to have distinct histogram peaks representing adipose (lower peak) and fibroglandular (higher peak) tissue. The histogram plots of Fig. 9 show how the acquisition at higher dose, and postprocessing with ADF can help distinguish adipose and fibroglandular tissue.
Figure 8.
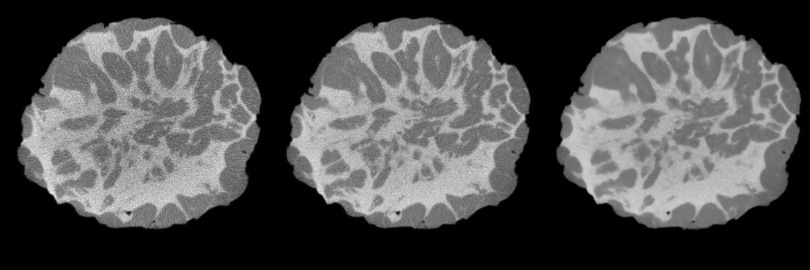
Example coronal slice of specimen reconstructed with one projection per angle (left); slice reconstructed using ten projections per angle (center) and after diffusion filter (right).
Figure 9.
Example histogram based on reconstruction of a representative specimen. More separation of the peaks in the histogram is achieved after averaging (i.e., equivalent to higher dose) with even more separation achieved after diffusion filter.
Shown in Fig. 10 are examples of image slices through various breast phantoms that were constructed with both the binary and scaled methods.
Figure 10.
Sagittal slices of four phantoms illustrating binary model [left column (i.e., A, C, E, G)] and same slices as scaled model [right column (i.e., B, D, F, H)].
Simulations using voxelized phantoms
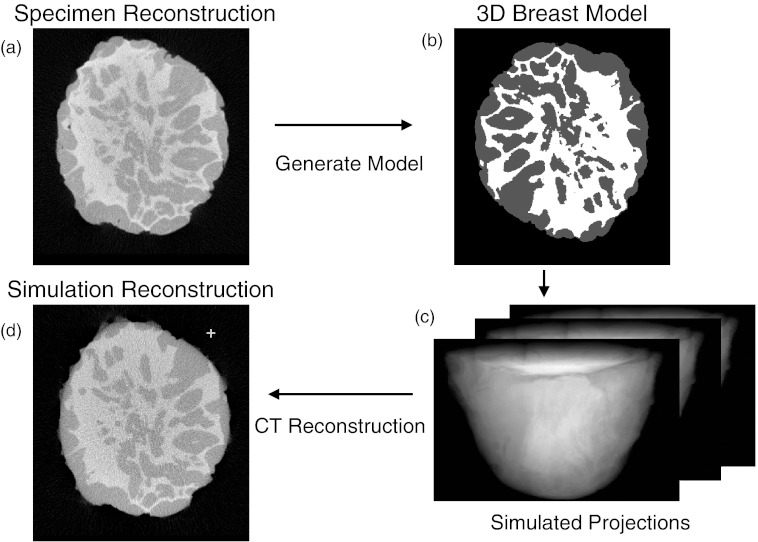
Once digital phantoms were generated, the simulation software was used to generate cone-beam projections from the ensemble of phantoms, and then to reconstruct these simulated projections set using FBP. The original specimen reconstruction was then compared with the reconstruction made from the simulated projections of the digital breast phantom. The basic flowchart for this process is shown in Fig. 11.
Figure 11.
(a) The reconstructed mastectomy (basis of phantom) was processed as described in text to create a phantom (b). Using simulation software a simulated projection set was generated [(c) – displays a few of 300 projections]. The simulated projection set was then reconstructed (d). Comparisons were made between specimen reconstruction (a) and simulated reconstruction based on phantom (d).
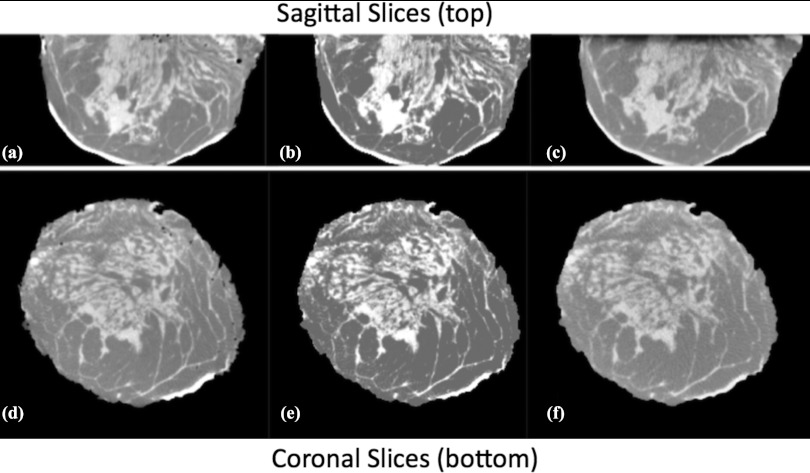
Figure 12 illustrates a comparison between an original specimen reconstruction and the simulated reconstruction using the corresponding phantom. Both the experimental and simulation acquisition technique were 40 kVp, 4 mGy MGD, and 300 projections over 360°. Figures 12a, 12d show sagittal and coronal slices from a mastectomy specimen reconstruction. Figures 12b, 12e show slices through the corresponding digital phantom generated using the multivalue method, and Figs. 12c, 12f show simulated reconstructions from the corresponding digital phantom. Figure 13 shows three orthogonal slices through a representative compressed phantom, and the corresponding simulated mammogram using a Mo/Mo 30 kVp spectra with 1.5 mGy MGD. The simulated detector in this case had 100 μm2 pixels, and modeled a CsI scintillator of thickness 100 μm.
Figure 12.
Representative sagittal (top) and coronal (bottom) slices. (a) and (d) are from a mastectomy specimen reconstruction (basis for digital phantom). (b) and (e) show corresponding slices from resultant digital phantom (using the multivalue model). (c) and (f) show slices from a computer simulation made using this digital phantom (i.e., generating simulated projections followed by FBP reconstruction). The simulation technique used was: 40 kVp, 4 mGy mean glandular dose for 300 simulated projections with simulated detector characteristics similar to prototype detector. Note the visual similarity between simulated reconstructions, (c) and (f) and the original specimen reconstruction, (a) and (d). A postreconstruction ADF was applied to the simulation. [Note: display windows are not uniform.]
Figure 13.
A, B, and C are coronal, axial, and sagittal slices, respectively, of a pseudocompressed phantom. The phantom displayed as a “negative” (i.e., adipose tissue values bright and glandular values dark). D is a simulated mammogram using this pseudocompressed phantom. The simulation technique used was Mo/Mo 30 kVp spectra at 1.5 mGy mean glandular dose with simulated detector characteristics of 100 μm2 pixel and CsI detector thickness of 100 μm.
Section 3E describes an analysis method to comparing structure in experimentally measured reconstructions to that simulated with the binary and multivalue breast phantom models.
Power spectrum analysis
Power spectrum analysis was used to compare structural similarity between the phantoms and the original specimen reconstructions. In this study, β of Eq. 3 was used as the figure of merit, where β is the absolute value of the slope of the power-law spectra. This value is determined by a fit to the log-log plot of the radial power spectrum over the frequency range 0.1–0.45 cycles/mm. Figure 14 shows an example comparing spectral fits for a specimen reconstruction and the simulated reconstruction based on the corresponding breast phantom generated from that specimen.
Figure 14.
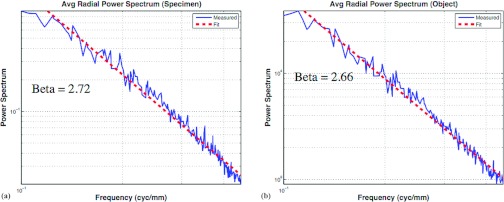
Log-log plots of the average power versus radial frequency plotted with linear best fit (dashed line). The absolute value of the slope of the fitted line was β. Panel (a) shows the power spectra of one specimen reconstruction (β = 2.72), whereas (b) shows the power spectra of the corresponding multivalue breast phantom (β = 2.66).
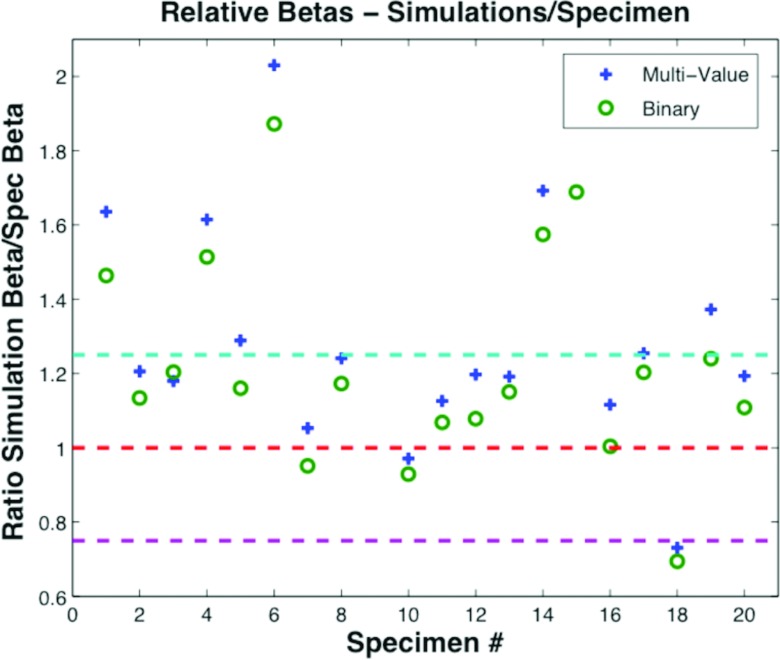
β values for 20 uncompressed specimens were compared with both the corresponding reconstructions based on the binary phantom and the reconstructions based on the multivalue phantom. For those 20 cases, β values for the specimen reconstruction were close to β values of the reconstructions based on multivalue phantoms as well as to the β values for the simulations based on the binary phantoms. Figure 15 shows the ratio of β computed from simulated phantoms to the ratio computed from specimen reconstructions. The average β for all specimen reconstructions was 2.25 with standard deviation 0.25. The average β for simulated reconstructions based on multivalue phantoms was 2.54, standard deviation 0.42. The average β for simulated specimens based on binary phantoms was 2.37, with standard deviation 0.37.
Figure 15.
Relative β comparison between specimens and simulations expressed as a ratio (simulations/specimen). A value of 1 would indicate a perfect match.
DISCUSSION
Voxelized breast phantoms are and will be useful in the development and optimization of tomographic breast imaging modalities such as breast tomosynthesis and breast CT. The phantoms could likewise be used for 2D breast imaging research. A number of different breast phantoms have been developed by previous researchers. All of these previous phantoms have advantages and disadvantages. Ultimately, a digital phantom should be selected based on its desired use. The main advantage for the ensemble of breast phantoms developed in this study over computer generated phantoms is that they provide anatomical realism, since they are based on high dose acquisitions of fresh surgical mastectomy specimens. While a fundamental advantage of this approach was that acquisitions were not dose-limited for patient safety, there were other constraints on the x-ray technique. These constraints were: (1) the amount of time available for imaging between surgery and delivery of the specimen to pathology; (2) the x-ray tube heat dissipation; and (3) as previously mentioned, the effective dynamic range of the detector (∼400–2047 Digital Units). Nonetheless, we developed a technique for increasing equivalent dose by acquiring the maximum number of projections at each tomographic angle as allowed by tube-loading and the allotted imaging time and averaging the results.
Another limitation of using breast specimens is that metal markers were often encountered in the mastectomy specimens. It is common when a suspected lesion is excised for cell biopsy, that an interventional radiologist marks the lesion site with a small metallic marker. Surgeons will also leave metallic markers when they perform lumpectomies. Those markers will result in mastectomy reconstruction artifacts, such as “spokes” that “radiate” from the marker over a number of reconstructed slices. Such artifacts are easy for the diagnostician to visually discount but were difficult to remove during postprocessing; therefore, some phantom slices were “contaminated” by such artifacts. These artifacts could probably be removed by hand editing the few effected slices, but this was not done.
While there were some advantages in imaging mastectomy specimens, there were also disadvantages with the breast being dissociated from normal gross anatomy. Specifically, much of the skin layer is missing, the orientation of the specimen within the holder could be problematic and obviously there was no attachment to chest wall and axillary regions. Additionally, at the time of imaging most breasts imaged had malignant lesions or removed lesions and therefore might have visible anomalies from either previous excisions or extant lesions; although some mastectomies were prophylactic. Nonetheless, there was a variety of tissue breast structure observed in the resulting phantoms.
The human breast is primarily composed of adipose tissue, fibroglandular tissue, and skin. Thus, two different segmentation methods were used to classify voxels representing internal breast structure. The first approach, referred to as the binary method classified each voxel as representing either pure adipose or pure fibroglandular tissue. Since the phantom voxels are of size 0.2 mm3, it could be possible that a voxel should contain both adipose and fibroglandular tissue (i.e., in a 0.2 mm3 volume, there could contain a mixture of tissue types). To model this possibility, the second approach allowed voxels to have a weighted combination of adipose and fibroglandular tissue. The phantoms generated with this approach were referred to as multivalued. Power spectral analysis indicated little difference between these two approaches for classifying phantom voxels, however, there was a distinct visual difference. In an informal subjective evaluation by four medical physicists in our laboratory, there was a clear preference for the multivalue phantom, primarily because of its tissue texture and edge similarity to the specimen reconstruction. Nonetheless, there could be applications where the binary phantom is preferred.
CONCLUSIONS
An ensemble of breast phantoms have been created based on low-noise CT reconstructions of mastectomy specimens. These phantoms span a range of sizes, shapes, and composition. Phantom voxel values can be either binary or multivalue and could be scaled to accommodate various simulation environments. The phantoms have good spatial detail since they are based on CT reconstructions of surgical breast specimens with 0.2 mm3 voxels. When necessary to have a finer voxel dimensions in a phantom, we speculate that one could transform the existing phantom to finer dimensions through interpolation. We have shown that we can generate numerous pseudocompressed phantoms from the uncompressed phantoms.
The UMMS digital phantoms have been useful in research conducted at our institution.17, 18, 49, 50, 51, 52 If other researchers are interested in using these phantoms, they are encouraged to contact the corresponding author.
ACKNOWLEDGMENTS
This research was supported in part by the National Institute of Biomedical Imaging and Bioengineering under Grant No. EB02133, the National Cancer Institute under Grant Nos. CA102758, CA140400, and CA140400, and the National Center for Research Resources under Grant No. RR016689. The contents of this paper are solely the responsibility of the authors and do not represent the official views of the NIH.
References
- Boone J. et al. , “Dedicated breast CT: Radiation dose and image quality evaluation,” Radiology 221(3), 657–677 (2001). 10.1148/radiol.2213010334 [DOI] [PubMed] [Google Scholar]
- Chen B. and Ning R., “Cone-beam volume CT breast imaging: Feasibility study,” Med. Phys. 29(5), 755–770 (2002). 10.1118/1.1461843 [DOI] [PubMed] [Google Scholar]
- Glick S. J., “Breast CT,” Annu. Rev. Biomed. Eng. 9, 501–526 (2007). 10.1146/annurev.bioeng.9.060906.151924 [DOI] [PubMed] [Google Scholar]
- Glick S. J. et al. , “Evaluating the impact of x-ray spectral shape on image quality in flat-panel CT breast imaging,” Med. Phys. 34(1), 5–24 (2007). 10.1118/1.2388574 [DOI] [PubMed] [Google Scholar]
- Gong X., Vedula A. A., and Glick S. J., “Microcalcification detection using cone-beam CT mammography with a flat-panel imager,” Phys. Med. Biol. 49(11), 2183–2195 (2004). 10.1088/0031-9155/49/11/005 [DOI] [PubMed] [Google Scholar]
- Lindfors K. K. et al. , “Dedicated breast CT: Initial clinical experience,” Radiology 246, 725–733 (2008). 10.1148/radiol.2463070410 [DOI] [PMC free article] [PubMed] [Google Scholar]
- McKinley R. L. et al. , “Simulation study of a quasi-monochromatic beam for x-ray computed mammotomography,” Med. Phys. 31(4), 800–813 (2004). 10.1118/1.1668371 [DOI] [PubMed] [Google Scholar]
- Yang W. T. et al. , “Dedicated cone-beam breast CT: Feasibility study with surgical mastectomy specimens,” Am. J. Roentgenol. 189(6), 1312–1315 (2007). 10.2214/AJR.07.2403 [DOI] [PMC free article] [PubMed] [Google Scholar]
- Barrett H. H. and Myers K. J., Foundations of Image Science (John Wiley and Sons, New York, 2004). [Google Scholar]
- Hsu J. et al. , “Preclinical ROC studies of digital stereomammography,” IEEE Trans. Med. Imaging 14(2), 318–327 (1995). 10.1109/42.387713 [DOI] [PubMed] [Google Scholar]
- Taylor P. and Owens R., “Simulated mammography using synthetic 3D breasts,” in Proceedings of International Workshop on Digital Mammography, Nijmegen, 1998, edited by Karssemeijer N., Thijsen M., Hendriks J., and van Erning L., Computational Imaging and Vision, Vol. 13 (Kluwer, Dordrecht, 1998), pp. 283–290.
- Bakic P. R. et al. , “Mammogram synthesis using 3D simulation. 1. Breast tissue model and image acquisition simulation,” Med. Phys. 29(9), 2131–2139 (2002). 10.1118/1.1501143 [DOI] [PubMed] [Google Scholar]
- Bakic P. R. et al. , “Mammogram synthesis using a 3D simulation. II. Evaluation of synthetic mammogram texture,” Med. Phys. 29(9), 2140–2151 (2002). 10.1118/1.1501144 [DOI] [PubMed] [Google Scholar]
- Bakic P. R. et al. , “Mammogram synthesis using a three-dimensional simulation. III. Modeling and evaluation of the breast ductal network,” Med. Phys. 30(7), 1914–1926 (2003). 10.1118/1.1586453 [DOI] [PubMed] [Google Scholar]
- Bliznakova K. et al. , “A three-dimensional breast software phantom for mammography simulation,” Phys. Med. Biol. 48, 3699–3719 (2003). 10.1088/0031-9155/48/22/006 [DOI] [PubMed] [Google Scholar]
- Wu T. et al. , “Tomographic mammography using a limited number of low-dose cone-beam projection images,” Med. Phys. 30(3), 365–380 (2003). 10.1118/1.1543934 [DOI] [PubMed] [Google Scholar]
- Das M. et al. , “Evaluation of a variable dose acquisition technique of microcalcification and mass detection in digital breast tomosynthesis,” Med. Phys. 36(6), 1976–1984 (2009). 10.1118/1.3116902 [DOI] [PMC free article] [PubMed] [Google Scholar]
- Das M. et al. , “Penalized maximum likelihood reconstruction for improved microcalcification detection in breast tomosynthesis,” IEEE Trans. Med. Imaging 30(4), 904–914 (2011). 10.1109/TMI.2010.2089694 [DOI] [PMC free article] [PubMed] [Google Scholar]
- Burgess A. E., Jacobson F. L., and Judy P. F., “Human observer detection experiments with mammograms and power-law noise,” Med. Phys. 28(4), 419–437 (2001). 10.1118/1.1355308 [DOI] [PubMed] [Google Scholar]
- Burgess A. E., “Statistically defined backgrounds: Performance of a modified nonprewhitening observer model,” J. Opt. Soc. Am. A 11(4), 1237–1243 (1994). 10.1364/JOSAA.11.001237 [DOI] [PubMed] [Google Scholar]
- Kallergi M., “Computer-aided diagnosis of mammographic microcalcification clusters,” Med. Phys. 31(2), 314–326 (2004). 10.1118/1.1637972 [DOI] [PubMed] [Google Scholar]
- Hoeschen C. et al. , “A high-resolution voxel phantom of the breast of dose calculations in mammography,” Radiat. Prot. Dosim. 114(1–3), 406–409 (2005). 10.1093/rpd/nch558 [DOI] [PubMed] [Google Scholar]
- Pisano E. et al. , “American College of Radiology imaging network digital mammographic imaging screening trial: Objectives and methodology,” Radiology 236(2), 404–412 (2005). 10.1148/radiol.2362050440 [DOI] [PubMed] [Google Scholar]
- Burgess A. E., “Mammographic structure: Data preparation and spatial statistics analysis,” SPIE Med. Imaging 3661, 642–653 (1999). 10.1117/12.348620 [DOI] [Google Scholar]
- Rowland J. P. and Barrett H. H., “Effect of random background inhomogeneity on observer detection performance,” J. Opt. Soc. Am. A 9, 649–658 (1992). 10.1364/JOSAA.9.000649 [DOI] [PubMed] [Google Scholar]
- Bochud F. O., Abbey C. K., and Eckstein M. P., “Statistical texture synthesis of mammographic images with clustered lumpy backgrounds,” Opt. Express 4(1), 33–43 (1999). 10.1364/OE.4.000033 [DOI] [PubMed] [Google Scholar]
- Heath M., Bowyer K., Kopans D., Moore R., and Philip Kegelmeyer W., “The digital database for screening mammography,” in Proceedings of the Fifth International Workshop on Digital Mammography, edited by Yaffe M. J., Medical Physics Publishing, 2001, pp. 212–218.
- Li C. M. et al. , “Methodology for generating a 3D computerized breast phantom from empirical data,” Med. Phys. 36(7), 3122–3131 (2009). 10.1118/1.3140588 [DOI] [PMC free article] [PubMed] [Google Scholar]
- Batts M., Explanation of panel saturation error, June 13, 2007.
- O’Connor J. M. et al. , “Characterization of a prototype table-top x-ray CT breast imaging system,” Proc. SPIE 6510, Medical Imaging 2007: Physics of Medical Imaging, 65102T (2007). 10.1117/12.713751 [DOI] [Google Scholar]
- O’Connor J. M. et al. , “Using mastectomy specimens to develop breast models for breast tomosynthesis and CT breast imaging,” Proc. SPIE 6913, 691315 (2008). 10.1117/12.772666 [DOI] [Google Scholar]
- O’Connor J. M.et al. , “Comparison of two methods to develop breast models for simulation of breast tomosynthesis and CT,” in Proceedings of the 9th International Workshop on Digital Mammography (IWDM2008), Tucson, AZ, 2008 (Springer-Verlag, Berlin Heidelberg, 2008).
- IRB Docket #H-12422, I.R.B.I. University of Massachusetts, Editor, 2006.
- Vedula A. A., Glick S. J., and Gong X., “Computer simulation of CT mammography using a flat-panel imager,” Proc. SPIE 5030, Medical Imaging 2003: Physics of Medical Imaging, 349 (2003). 10.1117/12.480015 [DOI] [Google Scholar]
- Feldkamp L. A., Davis L. C., and Kress J. W., “Practical cone-beam algorithm,” J. Opt. Soc. Am. A 1(6), 612–619 (1984). 10.1364/JOSAA.1.000612 [DOI] [Google Scholar]
- Noo F. et al. , “Analytic method based on identification of ellipse parameters for scanner calibration in cone-beam tomography,” Phys. Med. Biol. 45, 3489–3508 (2000). 10.1088/0031-9155/45/11/327 [DOI] [PubMed] [Google Scholar]
- Barrett J. F. and Keat N., “Artifacts in CT: Recognition and avoidance,” Radiographics 24(6), 1679–1691 (2004). 10.1148/rg.246045065 [DOI] [PubMed] [Google Scholar]
- Altunbas M. C. et al. , “A post-reconstruction method to correct cupping artifacts in cone beam breast computed tomography,” Med. Phys. 34(7), 3109–3118 (2007). 10.1118/1.2748106 [DOI] [PMC free article] [PubMed] [Google Scholar]
- Gilboa G., Sochen N. A., and Zeevi Y. Y., “Variational denoising of partly-textured images by spatially varying constraints,” IEEE Trans. Image Process. 15(8), 2269–2280 (2006). 10.1109/TIP.2006.875248 [DOI] [PubMed] [Google Scholar]
- Perona P., and Malik J., “Scale-space and edge detection using anisotropic diffusion,” IEEE Transactions on Pattern Analysis and Machine Intelligence 12(7), 629–639 (1990). 10.1109/34.56205 [DOI] [Google Scholar]
- Johns P. C. and Yaffe M. J., “X-ray characterisation of normal and neoplastic breast tissues,” Phys. Med. Biol. 32(6), 675–695 (1987). 10.1088/0031-9155/32/6/002 [DOI] [PubMed] [Google Scholar]
- Siddon R. L., “Fast calculation of the exact radiological path for a three-dimensional CT array,” Med. Phys. 12(2), 252–255 (1985). 10.1118/1.595715 [DOI] [PubMed] [Google Scholar]
- Cunningham I., Westmore M. S., and Fenster A., “A spatial-frequency dependent quantum accounting diagram and detective quantum efficiency model of signal and noise propagation in cascaded imaging systems,” Med. Phys. 21(3), 417–427 (1994). 10.1118/1.597401 [DOI] [PubMed] [Google Scholar]
- Metheany K. G., Abbey C. K., Packard N., and Boone J. M., “Characterizing anatomical variability in breast CT images,” Med. Phys. 35, 4685 (2008). 10.1118/1.2977772 [DOI] [PMC free article] [PubMed] [Google Scholar]
- Grass M., Kohler T., and Proksa R., “3D CBCT reconstruction,” Phys. Med. Biol. 45, 329 (1999). 10.1088/0031-9155/45/2/306 [DOI] [PubMed] [Google Scholar]
- Kudo H., “Cone-beam filtered-backprojection algorithm for truncated helical data,” Phys. Med. Biol. 43(10), 2885–2909 (1998). 10.1088/0031-9155/43/10/016 [DOI] [PubMed] [Google Scholar]
- Rodet T., Noo F., and Defrise M., “The cone-beam algorithm of Feldkamp, Davis and Kress preserves oblique line integrals,” 2004. (available URL: http://www.lss.supelec.fr/~publi/TWFyY2VsIFNFSVNNSUM=_FDK_oblique_rev.pdf). [DOI] [PubMed]
- Wang B., Liu H., and Wang G., “Feldkamp-type image reconstruction from equiangular data,” J. X-Ray Sci. Technol. 9, 113–120 (2001). [PubMed] [Google Scholar]
- Chen Y. et al. , “Characterization of scatter in cone-beam CT breast imaging: Comparison of experimental measurements and Monte Carlo simulation,” Med. Phys. 36(3), 857–869 (2009). 10.1118/1.3077122 [DOI] [PMC free article] [PubMed] [Google Scholar]
- Das M. et al. , “Evaluation of a variable dose acquisition methodology for breast tomosynthesis,” Proc. SPIE 6913, 691319 (2008). 10.1117/12.773106 [DOI] [Google Scholar]
- Dey J. et al. , “Temporal change analysis for improved tumor detection in dedicated CT breast imaging using affine and free-form deformation,” Proc. SPIE 6913, Medical Imaging 2008: Physics of Medical Imaging, 69131D (2008). 10.1117/12.769551 [DOI] [Google Scholar]
- Didier C. S. et al. , “Enhanced computer simulation of CT mammography using a flat-panel imager,” Proc. SPIE 7258, Medical Imaging 2009: Physics of Medical Imaging, 72580J (2009). 10.1117/12.813963 [DOI] [Google Scholar]


