

Abstract
The interplay of human actions and natural processes over varied spatial and temporal scales can result in abrupt transitions between contrasting land surface states. Understanding these transitions is a key goal of sustainability science because they can represent abrupt losses of natural capital. This paper recognizes flickering between alternate land surface states in advance of threshold change and critical slowing down in advance of both threshold changes and noncritical transformation. The early warning signals we observe are rises in autocorrelation, variance, and skewness within millimeter-resolution thickness measurements of tephra layers deposited in A.D. 2010 and A.D. 2011. These signals reflect changing patterns of surface vegetation, which are known to provide early warning signals of critical transformations. They were observed toward migrating soil erosion fronts, cryoturbation limits, and expanding deflation zones, thus providing potential early warning signals of land surface change. The record of the spatial patterning of vegetation contained in contemporary tephra layers shows how proximity to land surface change could be assessed in the widespread regions affected by shallow layers of volcanic fallout (those that can be subsumed within the existing vegetation cover). This insight shows how we could use tephra layers in the stratigraphic record to identify “near misses,” close encounters with thresholds that did not lead to tipping points, and thus provide additional tools for archaeology, sustainability science, and contemporary land management.
Keywords: bifurcations, geomorphology, Iceland, resilience, tephrochronology
Abrupt threshold-crossing events or critical transitions are common features of complex dynamic systems ranging from climate and ecology to financial markets and medical conditions. It is difficult to predict threshold-crossing before it happens, but there is good evidence that early warning signals (EWSs) do exist (1, 2). Flickering between alternative states, changing spatial patterns, critical slowing down, and rising memory have been identified as phenomena that can develop with proximity to a threshold change or bifurcation point (2–6). Critical slowing down and rising memory describe the increased time taken to return to equilibrium following perturbation, and as a result, there are marked increases in variance and autocorrelation. These changes have been observed empirically during population extinction (7). As a system moves between alternative states, measurements tracking the movement may become skewed, especially if a “flickering” occurs between states. EWSs have been suggested to precede the end of the Younger Dryas cold period (8) and have been identified in advance of lake eutrophication in China (4). EWSs also exist in the changing spatial patterning of desert vegetation before its collapse (5, 6, 9).
Although significant advances have been made in the theory and detection of critical transitions (e.g., refs. 2, 10, 11), there is a need to develop a better range of well-constrained empirical case studies in sustainability science, particularly those that could help develop ways to anticipate catastrophic losses in ecosystem services (4, 12). This paper presents empirical evidence of early warning signals of critical transitions in complex land surface systems that are experiencing directional (as opposed to purely stochastic) change, where the surface transformation is a result of the interplay between human actions and natural processes across varied spatial and temporal scales.
Vegetation and geomorphology are interrelated with mutual dependencies, interactions, and feedback loops (13). As a result, just as geomorphological processes can drive vegetation change, modifications of vegetation can drive geomorphological change and create new dynamic equilibria. Change in vegetation cover can, for example, represent an external critical threshold for andisol erosion in Iceland: When cover drops below a certain level, positive feedback results in a persistent state of surface denudation. As critical slowing down occurs in the spatial patterning of ecosystems on the brink of collapse (5, 6), changing patterns of vegetation can be used to track movements between alternative surface states and provide ways to anticipate regime shifts.
We argue that volcanic ash (tephra) layers offer an effective way to develop proxy records of vegetation patterning. Where tephra fallout can be subsumed within dense surface vegetation, the morphology of the stabilized layer (and thus the form in which it is incorporated into the stratigraphic record) is a reflection of a combination of vegetation structures and prevailing Earth surface processes. On slopes, stems, roots, and leaves can effectively anchor a tephra layer, and their absence can mean that no coherent layer survives.
The fine-grained tephra layers from the eruptions of Eyjafjallajökull in A.D. 2010 (Ey2010; particle sizes 0.001–0.2 mm) (14) and Grímsvötn in A.D. 2011 (G2011) (15) (Fig. S1A) have been selected for study in south Iceland, where the fallout was less than 50 mm deep. The tephra layers have experienced a limited period of modification as exposed deposits before becoming stabilized by the renewed growth of surface vegetation (Fig. S1D). Six transects of tephra thickness (T1–T6; Table S1) are measured at high frequencies (every 16 mm) to a high resolution (±1 mm) across boundaries between five contrasting land surface states, each with distinctive land forms, vegetation structures, and ecosystem services.
Many contrasting dynamic equilibria can be identified within the anthropogenically modified landscapes of Iceland (Fig. 1). Well-grazed swards develop a densely knit turf with a deep root mat. When earth hummocks (21) (Icelandic: thufur; Fig. 1B) develop as a result of interplay between frost action and grazing regime, they can persist in a similar form over multicentury time scales, despite surface aggradation many times deeper than their height. Surface exposures of andisols are denuded by wind, water, and frost, which, combined with grazing, inhibit vegetation development. These eroding slopes are such persistent and recognizable features of the Icelandic landscape that they are known by the Icelandic term rofabard (20, 22) (Fig. 1E).
Fig. 1.
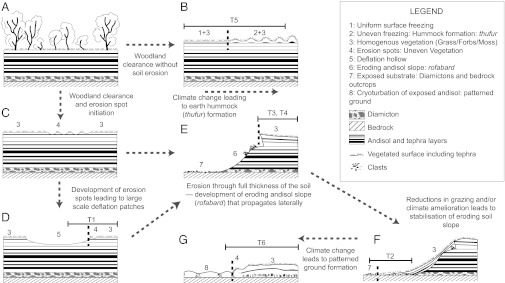
Measurements of tephra depth were recorded across land surface transformations. The locations of transects are indicated by a horizontal line, and bifurcations between land surface states are indicated by a dashed vertical line. (A) These study areas would have naturally supported Betula pubescens woodland until the Norse colonization of ∼A.D. 870 (16). The present lowland vegetation cover consists of grasses, forbs, mosses, and scattered dwarf woody shrubs (17, 18). Thresholds of geomorphological stability have been crossed (19, 20) as a result of strong directional drivers to change, degrading rangeland ecologies, and reducing soil cover. (B) Enhanced near-surface cryoturbation can lead to earth hummock (thufur) formation (20, 21). Erosion spots (C) that form through a combination of grazing pressures and climatic deterioration (20) can develop into shallow deflation hollows within the surface andisol (D) (Fig. S1A). (E) Erosion eventually cuts through the full thickness of the andisol, the underlying substrate is exposed, a threshold is crossed, and another surface state develops (22) (Fig. S1C). Eroding surfaces may stabilize (F). In areas of shallow soil, cryoturbation can bring clasts to the surface (G). Tephra layers and andisols are represented stylistically. Locally, Holocene andisol sequences can contain over 100 tephra layers and can be >5 m deep. As a result of high rates of postsettlement aeolian erosion, surviving andisol sequences in south Iceland aggrade at a rate of ∼0.5 mm/y, approximately double the presettlement rates (20, 23).
The onset of soil erosion and the exposure of andisols to surface processes (the creation of rofabards) can represent a threshold between alternate land surface states and different qualities of ecosystem service. This is because there is an asymmetry between the more intense grazing conditions or severe climate needed to trigger the formation of rofabards and the lower grazing levels or milder climate needed to allow the propagation of erosion. Once soil erosion has developed, it can continue to spread under much lower grazing intensities and more benign climates than those that led to its initiation (20).
In this study, six transects were orientated along environmental gradients to intersect boundaries between eroding andisols, exposures of diamicton, cryoturbation, and vegetation so that spatially ordered datasets could be used to capture spatial patterns of ecological change (Fig. 1). Patterns along transects mirror changes known to have occurred at a single location through time. For example, soil erosion locally proceeds from erosion spots to the development of meter-scale deflation hollows that expand to create exposures of glacially derived diamicton or bedrock surrounded by rofabards and, ultimately, large areas lacking surface soils or fine sediments (Fig. 1). We analyzed the measured variations in tephra thickness along the six transects for statistical indicators that have been shown to indicate an approaching bifurcation: autocorrelation (24), SD (10), and skewness (3).
Results and Discussion
Transects in contrasting geomorphological settings [deflation margins with topographic continuity, the edges of full-thickness andisol erosion (rofabard erosion), and earth hummock (thufur) transitions] present robust indicators of proximity to land surface thresholds in the form of increasing variance, autocorrelation, and skewness of the superficial tephra layer thickness (Figs. 2 and 3).
Fig. 2.

Early warning signals of transformation recorded in tephra depth across the edge of a deflation patch (Fig. 1D). (A) Thickness measurements of tephra (gray) with a Gaussian filter (black). Autocorrelation at-lag-1 (B), SD (C), and skewness (D) are calculated with a rolling window half the length of the dataset for both the original dataset (black) and residuals of the detrended dataset (gray). The strengths of trends estimated by the Kendall τ correlation coefficient are indicated on the graphs. Dashed vertical lines indicate transitions to tephra absence. (E) Probability density functions for three sections of the transect indicate that a changing distribution of measurement in the middle of the transect is not a simple transition from one state (0–354 cm) to the other (707–1,060 cm). (F) Moving average skewness calculated for the previous 30 points.
Fig. 3.

Variations in tephra thickness toward four land surface transitions. (A) T2 crosses from shallow vegetated soils to exposed diamicton. (B) T5 crosses a transition from a smooth surface to earth hummocks (summits are indicated by ▲). (C and D) T3 and T4 cross stable deep andisols to the edge of an eroding slope (rofabard). Gray broken lines show identified thresholds. Bold black lines are a Gaussian filter with a bandwidth of 30 measurements (48 cm). Autocorrelation at-lag-1 and SD are calculated on the original dataset (black lines) and on the residuals of the detrended dataset (gray lines). Kendal τ correlation coefficients are indicated for original and residual autocorrelation and SD trends.
Patterns of tephra layer thickness do not simply mirror preeruption movements of sediment within the landscape. Tephra deposition from a moderately sized [e.g., volcanic explosivity index (VEI) 3] volcanic plume close to the source (e.g., 10–20 km) produces an essentially even coverage over spatial scales from 100–500 m. This fallout is subsequently modified by prevailing Earth surface processes and reflects the spatial patterning of vegetation. In contrast, Icelandic soil erosion produces both local “hotspots” of sediment supply and attenuated regional fallout (25). In vegetated areas, long-term andisol accumulation rates increase toward a rofabard margin because it is a major local sediment source (25) (Fig. 1E). This phenomenon is also observed in T3 and T4, where, by June 2012, the G2011 tephra close to the rofabard edge (<50 cm) was covered by 5–10 mm of wind-deposited andisol that thinned away from the eroding slope. In contrast, the thinnest deposits of G2011 tephra within the vegetated areas were found within 1 m of the rofabard edge (Fig. 3 C and D). T2 was sited at the foot of a stabilized rofabard, where the apron of vegetation extended into an area previously stripped to the underlying glacially derived diamicton and bedrock outcrops (Fig. S1B). The exposed diamicton is stable, and the reestablished andisol thickens toward the stabilized rofabard slope. In contrast, the Ey2010 tephra layer at this site thickens toward the edge of the vegetated zone (Fig. 3A).
An increase in either variance or autocorrelation is observed in all six transects before the land surface transition, with stronger trends observed for the original datasets rather than the detrended datasets. The strongest indicator is increasing variance, which rises significantly in all cases. It then declines before the transition in three transects, where there is a reduction in tephra thickness even after detrending (Figs. 2A, 3D, and 4). Autocorrelation increases strongly in some datasets (T1, T2, and T5; Figs. 2B and 3 A and B) but increases weakly and irregularly in T3 and T4 (Fig. 3 C and D) and declines in T6 (Fig. 4). Skewness increases for T1 (Fig. 2D) and T6 (Fig. 4) but shows no consistent trend in other transitions.
Fig. 4.

Variations in tephra thickness and early warning metrics in T6 across a transition from shallow vegetated andisols to exposed sediment (Fig. 1G).
Sensitivity tests on rolling window size and detrending bandwidth choices indicate that these results are robust (SI Text and Fig. S2). We have computed the probability of obtaining the same Kendall τ value by chance for trends in autocorrelation and variance (12) (SI Text and Table S2). This probability is low (<0.05) in half of the indicators (overall P range: 0.001–0.264), and the Fisher’s combined probability for each indicator (original dataset, SD, and autoregressive model of order 1 [ar(1)]; residuals of detrended datasets, SD, and ar(1)) is very low (P < 0.00003). We are therefore confident that the observed EWSs are not due to chance.
Critical Transitions in Land Surface Systems.
Where there is a degree of topographic continuity between alternate land surface states, the spatial patterning of vegetation may exhibit systematic variation with proximity to a change of state, recovery times may increase in the face of perturbation, and flickering may occur between alternate states.
Three land surface transitions exist within T1 (Figs. 1D and 2). At 3.5 m, the ubiquitous surface vegetation characteristic of the first third of the transect develops erosion spots and begins to be broken into patches and clumps; from 3.5 to 6.5 m, areas of bare andisol become more extensive and combine to create labyrinths of exposed and eroding andisols; and at 6.5 m, raised patches of vegetation disappear and are replaced by a smooth, comparatively uniform surface of unconsolidated andisols and tephras that is being actively winnowed away by deflation but still retains scattered Equisetum Spp. At 10.5 m tephra and vegetation become consistently absent. Changes along the transect are analogous to the complete cover/bare patches/labyrinths/bare ground stages observed across critical vegetation transitions in semiarid regions (9). In the zone from 3.5 to 6.5 m, the potential recovery of the ecosystem is facilitated by the presence of clumps of vegetation and root masses; from 10.5 m complete revegetation of an eroding andisol surface would have to involve a major land use change, climate change, or both, and represents a critical transition. Skewness increases at the 3.5-m mark as the transect sequence effectively “flickers” between decimeter-scale clumps of vegetation and exposed sediment (Fig. 2F). Increasing skewness is a robust EWS of the transition at the 6.5-m mark to uniform deflating andisol cover and mimics changes modeled and observed in lake eutrophication (4). In addition, critical slowing down is apparent between the 3.5-m and 6.5-m marks as variance and autocorrelation increase. Here, we argue that the increases of autocorrelation seen in T1 are only possible when the rate of progress toward the bifurcation (measured in distance or time) is at least an order of magnitude less than the duration of the EWS. Autocorrelation will only increase in transitions in which there is a slow progress toward bifurcation (24). Variance increases up to the 9-m mark as the system oscillates between the two attractors (vegetated surface and coherent tephra layer or exposed andisol and no surface tephra) but decreases after the 9-m mark as the alternative state of 0-mm tephra and a denuding surface becomes ubiquitous. The multimodality of the section at 3.5–6.5 m is not apparent in the sequence before the 3.5-m mark (Fig. 2E).
In T2, proximity to the transition from vegetation to exposed diamicton is preceded by increasing variance and autocorrelation (Fig. 3A). The boundary of continuous vegetation cover is sharp and displays little evidence of recent (seasonal) movement; however, on the exposed diamicton, vegetation tussocks are eroded on the sides facing away from the stabilized rofabard, displaying patches of exposed andisol and roots (Fig. S1B). Measures of autocorrelation within T2 are also consistent with the slow movement toward a transition suggested by the vegetation and geomorphology.
Gradations in the spatial patterning of vegetation can disappear at the edge of vegetated areas in which there are abrupt topographic discontinuities. Across these transitions, surface processes may still exhibit some gradation between alternate states due to the edge effects associated with the eroding slope. T3 and T4 (Fig. 2 C and D) show strongly increasing variance and are unchanging to weakly increasing autocorrelation, indicative of a system moving rapidly toward transition (12, 24), and this is consistent with our geomorphological understanding. Rofabard margins erode at semicontinuous rates as a result of the removal of fine-grained sediments from their exposed faces: The movement of the vegetated crest line is, however, episodic because it proceeds through the collapse of turf blocks (22). Erosion spots do not occur on the vegetated margin of the rofabard crest, but the topographic modifications caused by the eroding slope create edge effects; drainage is altered, microclimates are modified by the microtopographic effects on wind patterns, and regimes of grazing and trampling by livestock change (20, 22).
T5 (Fig. 3B) represents a contrasting, noncritical transformation from a smooth to earth-hummock (thufur) surface within an area of grassland. There are EWSs of the thufur transition observed in the strong increase in autocorrelation and increases in variance in the data sequence running from the smooth surface into the hummocky surface (Fig. 3B). These changes suggest that the system is becoming more sensitive to external perturbations, and therefore may be at higher risk for critical transition (26). The development of earth hummock microtopography is driven by near-surface ice formation (21, 27), and over the past 20 y, despite significant interannual variability, there has been a general trend toward warmer conditions (SI Text) that could reduce hummock formation. Set against this, their formation can be enhanced by land management through its effect on surface hydrology and microclimate; thus, susceptibility may be unchanged despite the warming. Alternatively, because the precursors to noncritical transitions are symmetrical, the land surface could be less susceptible to thufur formation and the EWS is of a movement away from the thufur transition. Crucially, whatever the direction of change, this empirical observation is consistent with the EWSs observed in models of noncatastrophic transitions, and thus supports the idea that EWSs are not unique to catastrophic transitions (fold bifurcations) (26), although further research is needed in this area.
T6 begins within an area of compete vegetation and ends on exposed diamicton, where there is weakly developed patterned ground formation, frost heave, and animal trampling, all of which disrupts vegetation. Despite a rising trend of variance in the residuals of the detrended data until the last meter of transect before the transition, there is no strong EWS for the transition itself (Fig. 4). Over the same distance, autocorrelation declines but skewness increases (indicating a flickering between alternate states). The absolute values of skewness are, however, significantly less than those observed in T1, and the result is not robust (Fig. 2 and Table S2). These are very weak EWSs of transition, and they imply that the processes originally driving the land surface transition in T6 have reduced in intensity, a likely result of recent climate change.
Proximity to a Critical Threshold.
Although EWSs do not provide an absolute measure of the distance a system is from transition, T3 and T4 show that EWSs are detectable at least 1,400–1,600 mm from the boundary. Rates of active rofabard movement in Iceland vary between 10 mm/y and 90 mm/y but are generally toward the lower end of this range (22). Thus, with space/time substitution, we suggest that the EWSs become apparent 15–160 y before the transition. How close an ecosystem can approach a bifurcation under the influence of directional (as opposed to purely stochastic) change and yet not experience transformation depends on how fast controlling variables can be manipulated (28). In this case, one controlling variable, grazing intensity, may be reduced to zero instantly, suggesting that regime shift relating to Icelandic soil erosion could be avoidable once EWSs are detected.
Significance for Sustainability Science.
A key challenge for sustainability science is how to project the significance of the spatial patterning of vegetation (5, 6) into the past. This is an important goal because the past offers “completed experiments,” where it is possible to determine what happened next in a long sequence of events, providing valuable insights to modern managers and policy makers (29, 30).
The spatial patterning of vegetation is a key determinant of thickness variability within a tephra layer. Because aggrading soil profiles do not contain records of vegetation structures, it is important to recognize that proxy indications of these can be preserved within the 3D form of shallow tephra layers. It is known that in the past, tephra layer thickness variability increased at times of directional environmental change, such as combinations of forest clearance, escalating grazing pressure, and climate deterioration (31). Based on the discoveries reported here, it should be possible to use thickness measurements to produce generic indicators of proximity to threshold change that can be applied to shallow tephra layers in stratigraphic sections. Because these indicators are based on the universal properties of a system approaching a tipping point (24), they do not necessarily point to any specific mechanism driving the process of change; however, they do present a key line of independent evidence that a critical transformation is close. With robust EWSs of land surface transformation, we could develop a more sophisticated understanding of the past interplay of land use, topography, ecology, climate, and soils because EWSs would help identify circumstances when slow, small-scale changes in parameters could trigger large changes in system states. In addition, recognition of the reduced resilience experienced by systems that are moving toward critical thresholds may explain why some perturbations result in transformative change and others do not, a situation that would have presented major challenges to past societies and is still a problem that confronts us today. Significant new areas of sustainability science could be developed if it becomes possible to identify “near misses,” close encounters with thresholds that did not lead to tipping points. This development would help avoid the “prosecutor’s fallacy” or the selection of only systems that have undergone critical transitions (32), as well as simplistic explanations of cause and effect. EWSs in the tephrostratigraphic record should only exist in cases in which directional drivers (e.g., climate change, land management) brought a surface to the brink of change, but the system moved back from the threshold because the record is preserved. In cases in which putative directional drivers did not change and yet apparent EWSs do, either a reinterpretation of the putative drivers is needed or a case of false causality has been identified.
Conclusions
Early warning signals of critical transitions within land surface systems can be identified using tephra layers because of the relationship between tephra layer morphology and spatial patterning in the vegetation on the surface it covers. These phenomena include both critical slowing down, as shown by increasing variance and autocorrelation, and flickering between alternative states, as shown by increasing skewness. Known propagation rates indicate that these signals develop 15–160 y before a critical transformation. Our data are consistent with the idea that spatial continuity and slow (decadal-scale) movement of the system toward a bifurcation are necessary for critical slowing down to be apparent.
Data from earth hummock (thufur) transitions suggest that EWSs also exist for noncritical transitions, a phenomenon previously identified with numerical modeling (26).
Tephra layers deposited during periods of known environmental change, and now buried within stratigraphic sequences, exhibit considerable thickness variability (31, 33). Thus, the discovery of EWSs in contemporary tephra layer thicknesses suggests that robust indications of close proximity to critical transitions that did not actually occur may be found in buried tephra layers. This would allow the ranking of past land surfaces in terms of their resilience, a complementary approach to the use of recovery rates to assess distance to a tipping point in living systems (34).
Tephra layers cover large parts of the Earth’s surface; as a result, the recognition of their potential to predict proximity to threshold-crossing events through variations in thickness has widespread potential application. The extensive distribution of tephra means that spatial patterns of proximity to critical transformations can be reconstructed and that predictive and spatial tests can be undertaken of great potential utility for environmental reconstruction and sustainability science.
Materials and Methods
Field Area.
Transects T1 and T2 were located 9 km and 18 km from Eyjafjallajökull, which erupted in April 2010, producing 0.18 km3 of tephra (14). T3–T6 were located in the Kalfafell area 50 km southwest of Grímsvötn, which erupted in May 2011, producing 0.6–0.8 km3 of tephra (15). These sites were chosen because they experienced a similar scale of fallout and the tephra layer was thick enough to be clearly visible and measured accurately. The length of time between the tephra fall and layer measurement was 26 mo at sites T1 and T2 and 13 mo at sites T3–T6. Further information on the field sites is given in SI Text, Fig. S1, and Table S1.
Data Collection.
Transects were each aligned to cross a critical transition along consistent environmental gradients, along dip slopes and perpendicular to eroding slopes for example. The transects extended >280 cm to the vegetated side of each threshold. A critical transition was defined by the break of slope at the summit of a rofabard feature, by the limit of continuous vegetation cover, or by uniformly exposed sediments. A noncritical transition, such as the onset of earth hummock formation observed in T5, was identified morphologically by the first distinct hummock. In all critical transitions, tephra thickness declined to zero. To collect layer thickness measurements, a shallow trench was excavated along the line of the transect. One edge was cut with a long, serrated knife that could cleanly slice through roots, and the exposed face was cleaned to >2 cm below the base of the measured layer. The G2011 tephra is gray-black in color, and the Ey2010 tephra is dark gray in color; both are distinctly different from the underlying yellow-brown andisol (Fig. S1D). Both recent tephra layers may be clearly distinguished from earlier tephras layers because of their stratigraphic location, color, particle size, and layer thickness. Tephra layer thickness measurements were collected at 16-mm intervals along each transect perpendicular to the base of the tephra and to a resolution of ±1 mm. Slope was measured using a clinometer to ±1°.
Data Analysis.
The datasets were assessed for three metric-based indicators that show early warning of threshold change (autocorrelation, SD, and skewness) following the procedures described by Dakos et al. (12) and using the R package earlywarnings, version 1.0.2. The nonparametric Kendall rank correlation τ statistic was used to assess the strength of trends in the indicators in both the original and detrended datasets. Autocorrelation was assessed by fitting an ar(1) (12), with the resulting estimate of the autoregressive coefficient assessed for EWS using the nonparametric Kendall rank correlation τ statistic. Each indicator was calculated using a rolling window half the size of the datasets before the transition (sizes of rolling windows are provided in Table S1). Metrics were calculated with the original dataset, and with the residuals of the detrended dataset, to decrease the probability of spurious EWS indicators if there were nonstationaries in the mean (24). Gaussian smoothing utilizing a filter of 30 measurements (48 cm) was used. The sensitivity of the results to filter bandwidth selection and rolling window size was also assessed (Fig. S2), as was the null hypothesis that the trends were caused by chance (Table S2).
Supplementary Material
Acknowledgments
We thank Magdalena Schmid for field assistance, Guðrún Gísladóttir (Icelandic Meteorological Office) for weather data, and Anthony Newton and two anonymous reviewers for their constructive input. We also thank Björn Helgi Snorrason (Kálfafell), Vigdís Jónsdóttir (Seljavellir), Tómas Ísleifsson (Ytri Sólheimar), Einar G. Þorsteinsson (Ytri Sólheimar), Ólafur Þorsteinsson (Eystri Sólheimar), Elín Einarsdóttir (Sólheimatunga), and Einar Þorsteinsson (Sólheimahjáleiga) for their support. This work was supported by US National Science Foundation Office of Polar Programs Arctic Sciences Grant 1202692 and a Leverhulme International Fellowship (to A.J.D.).
Footnotes
The authors declare no conflict of interest.
This article is a PNAS Direct Submission.
This article contains supporting information online at www.pnas.org/lookup/suppl/doi:10.1073/pnas.1220161110/-/DCSupplemental.
References
- 1.van Nes EH, Scheffer M. Slow recovery from perturbations as a generic indicator of a nearby catastrophic shift. Am Nat. 2007;169(6):738–747. doi: 10.1086/516845. [DOI] [PubMed] [Google Scholar]
- 2.Scheffer M, et al. Early-warning signals for critical transitions. Nature. 2009;461(7260):53–59. doi: 10.1038/nature08227. [DOI] [PubMed] [Google Scholar]
- 3.Guttal V, Jayaprakash C. Changing skewness: An early warning signal of regime shifts in ecosystems. Ecol Lett. 2008;11(5):450–460. doi: 10.1111/j.1461-0248.2008.01160.x. [DOI] [PubMed] [Google Scholar]
- 4.Wang R, et al. Flickering gives early warning signals of a critical transition to a eutrophic lake state. Nature. 2012;492(7429):419–422. doi: 10.1038/nature11655. [DOI] [PubMed] [Google Scholar]
- 5.Dakos V, van Nes EH, Donangelo R, Fort H, Scheffer M. Spatial correlation as leading indicator of catastrophic shifts. Theoretical Ecology. 2010;3:163–174. [Google Scholar]
- 6.Dakos V, Kéfi S, Rietker M, van Nes EH, Scheffer M. Slowing down in spatially patterned ecosystems at the brink of collapse. Am Nat. 2011;177(6):E153–E166. doi: 10.1086/659945. [DOI] [PubMed] [Google Scholar]
- 7.Drake JM, Griffen BD. Early warning signals of extinction in deteriorating environments. Nature. 2010;467(7314):456–459. doi: 10.1038/nature09389. [DOI] [PubMed] [Google Scholar]
- 8.Bakke J, et al. Rapid oceanic and atmospheric changes during the Younger Dryas cold period. Nat Geosci. 2009;2(3):202–205. [Google Scholar]
- 9.Rietkerk M, Dekker SC, de Ruiter PC, van de Koppel J. Self-organized patchiness and catastrophic shifts in ecosystems. Science. 2004;305(5692):1926–1929. doi: 10.1126/science.1101867. [DOI] [PubMed] [Google Scholar]
- 10.Carpenter SR, Brock WA. Rising variance: A leading indicator of ecological transition. Ecol Lett. 2006;9(3):311–318. doi: 10.1111/j.1461-0248.2005.00877.x. [DOI] [PubMed] [Google Scholar]
- 11.Scheffer M, et al. Anticipating critical transitions. Science. 2012;338(6105):344–348. doi: 10.1126/science.1225244. [DOI] [PubMed] [Google Scholar]
- 12.Dakos V, et al. Methods for detecting early warnings of critical transitions in time series illustrated using simulated ecological data. PLoS ONE. 2012;7(7):e41010. doi: 10.1371/journal.pone.0041010. [DOI] [PMC free article] [PubMed] [Google Scholar]
- 13.Marston RA. Geomorphology and vegetation on hillslopes: Interactions, dependencies, and feedback loops. Geomorphology. 2010;116:206–217. [Google Scholar]
- 14.Gudmundsson MT, et al. Ash generation and distribution from the April-May 2010 eruption of Eyjafjallajökull, Iceland. Sci Rep. 2012;2:572. doi: 10.1038/srep00572. [DOI] [PMC free article] [PubMed] [Google Scholar]
- 15.Gudmundsson MT, et al. The May 2011 eruption of Grímsvötn. European Geosciences Union General Assembly. 2012;2012:12119. [Google Scholar]
- 16.Hallsdóttir M. Pollen analytical studies of human influence on vegetation in relation to the Landnám tephra layer in southwestern Iceland. Lundqua Thesis. 1987;18:1–45. [Google Scholar]
- 17.Kristjansson H. A Guide to the Flowering Plants and Ferns of Iceland. 2nd Ed. Reykjavík, Iceland: Mál og Menning; 1998. [Google Scholar]
- 18. Icelandic Institute of Natural History (2012) Major vegetation types in Iceland. Available at http://en.ni.is/botany/vegetation/vegetation-types/. Accessed March 14, 2013.
- 19.Simpson IA, Dugmore AJ, Thomson A, Vésteinsson O. Crossing the thresholds: Human ecology and historical patterns of landscape degradation. Catena. 2001;42:175–192. [Google Scholar]
- 20.Dugmore AJ, Gísladóttir G, Simpson IA, Newton A. Conceptual models of 1200 years of Icelandic soil erosion reconstructed using tephrochronology. Journal of the North Atlantic. 2009;2:1–18. [Google Scholar]
- 21.Grab F. Aspects of the geomorphology, genesis and environmental significance of earth hummocks (thúfur, pounus): Miniature cryogenic mounds. Progress in Physical Geography. 2005;29(2):139–155. [Google Scholar]
- 22.Arnalds O. The Icelandic ‘rofabard’ soil erosion features. Earth Surface Process and Landforms. 2000;25:17–28. [Google Scholar]
- 23.Streeter R, Dugmore AJ, Vésteinsson O. Plague and landscape resilience in premodern Iceland. Proc Natl Acad Sci USA. 2012;109(10):3664–3669. doi: 10.1073/pnas.1113937109. [DOI] [PMC free article] [PubMed] [Google Scholar]
- 24.Dakos V, et al. Slowing down as an early warning signal for abrupt climate change. Proc Natl Acad Sci USA. 2008;105(38):14308–14312. doi: 10.1073/pnas.0802430105. [DOI] [PMC free article] [PubMed] [Google Scholar]
- 25.Dugmore AJ, Erskine CC. In: Environmental Change in Iceland. Stötter J, Wilhelm F, editors. Munich: Munchener Geographische Abhandlungen; 1994. pp. 63–78. [Google Scholar]
- 26.Kéfi S, Dakos V, Scheffer M, Van Nes EH, Rietkerk M. Early warning signals also precede non-catastrophic transitions. Oikos. 2012 doi: 10.1111/j.1600-0706.2012.20838.x. [DOI] [Google Scholar]
- 27.Washburn AL. Geocryology: A Survey of Periglacial Processes and Environments. Norwich, UK: Fletcher and Sons; 1979. [Google Scholar]
- 28.Briggs R, Carpenter SR, Brock WA. Turning back from the brink: Detecting an impending regime shift in time to avert it. Proc Natl Acad Sci USA. 2008;106(3):826–831. doi: 10.1073/pnas.0811729106. [DOI] [PMC free article] [PubMed] [Google Scholar]
- 29.Dearing JA, Braimoh AK, Reenberg A, Turner BL, van der Leeuw S. Complex land systems: The need for long time perspectives to assess their future. Ecology and Society. 2010;15(4):21. [Google Scholar]
- 30.van der Leeuw SE, et al. Toward an integrated history to guide the future. Ecology and Society. 2011;16(4):2. [Google Scholar]
- 31.Mairs KA, Church M, Dugmore AJ, Sveinbjarnardottir G. In: (2006) Dynamics of Northern Societies Proceedings of the SILA/NABO Conference on Arctic and North Atlantic Archaeology. Arneborg J, Grønnow B, editors. Copenhagen: PNN; pp. 365–373. [Google Scholar]
- 32.Boettiger C, Hastings A. Early warning signals and the prosecutor’s fallacy. Proc Biol Sci. 2012;279(1748):4737–4739. doi: 10.1098/rspb.2012.2085. [DOI] [PMC free article] [PubMed] [Google Scholar]
- 33.Streeter RT, Dugmore AJ. Reconstructing late-Holocene environmental change in Iceland using high-resolution tephrochronology. Holocene. 2012;23(2):197–207. [Google Scholar]
- 34.Veraart AJ, et al. Recovery rates reflect distance to a tipping point in a living system. Nature. 2012;481(7381):357–359. doi: 10.1038/nature10723. [DOI] [PubMed] [Google Scholar]
Associated Data
This section collects any data citations, data availability statements, or supplementary materials included in this article.