

Abstract
Rapid-release drug delivery systems present a new paradigm in emergency care treatments. Such systems combine a long shelf life with the ability to provide a significant dose of the drug to the bloodstream in the shortest period of time. Until now, development of delivery formulations has concentrated on slow release systems to ensure a steady concentration of the drug. To address the need for quick release system, we created hollow polyacrylate nanocapsules with nanometer-thin porous walls. Burst release occurs upon interaction with blood components that leads to escape of the cargo. The likely mechanism of release involves a conformational change of the polymer shell caused by binding albumin. To demonstrate this concept, a near-infrared fluorescent dye indocyanine green (ICG) was incorporated inside the nanocapsules. ICG-loaded nanocapsules demonstrated remarkable shelf life in aqueous buffers with no release of ICG for twelve months. Rapid release of the dye was demonstrated first in vitro using albumin solution and serum. SEM and light scattering analysis demonstrated the retention of the nanocapsule architecture after the release of the dye upon contact with albumin. In vivo studies using fluorescence lifetime imaging confirmed quick discharge of ICG from the nanocapsules following intravenous injection.
Keywords: drug release, optical imaging, ICG, fluorescence lifetime, emergency medicine
INTRODUCTION
A general trend in drug formulations centers on advanced delivery systems where in vivo release of the drug is carefully controlled to improve the effectiveness of therapy.1, 2 The majority of drug release systems developed to date relies upon the sustained release of an active ingredient from the delivery matrix to establish and maintain a therapeutically effective consistent concentration within the body. Many such systems have been developed and approved for the treatment of cancer, glaucoma, diabetes, and chronic pain.3–5 While sustained-release formulations are essential for the treatment of patients with prolonged illnesses, there is an unmet need for a drug delivery system where the active component is released quickly. Rapid release systems could find an immediate application in emergency medicine where the fast rise in drug concentration is critical to saving lives. Therefore, a small but growing number of rapid release formulations have recently been proposed as first aid or emergency treatments in life-threatening conditions, including thrombosis, stroke, acute poisoning and sharp pain.6–9
Intensive care treatments are based on administering drugs through parenteral routes, such as an intravenous (IV) infusion. Although direct injection of the drugs in the bloodstream is currently standard for emergency applications, the release systems provide the advantage to formulate therapeutic agents that would be too unstable for practical use in traditional intravenous administration. The factors affecting stability of intravenous medications are well documented and include drug precipitation when added to intravenous (IV) solutions, incompatibility with other drugs, buffering agents and preservative in the diluents.10–12 Formulation of the drugs through protective encapsulation-type drug release systems is expected to minimize these mitigating phenomena and reduce the risk of potentially fatal side effects.
The current generation of controlled release systems based upon passive diffuse transport of the active ingredient under physiological conditions cannot be adapted for emergency treatment because of relatively long diffusion time. The new generation of drug release systems utilizes the release of entrapped cargo triggered by endogenous factors,13, 14 e.g., biodegradation of certain polymers,15 enzymatic reactions,16 change in pH17 or external factors such as light.18 While a great number of triggered nanosystems have been proposed, none of these devices is suitable for the rapid release.
Porous polymeric nanoparticles are frequently utilized in controlled drug delivery for encapsulation of active ingredients.19, 20 The regulated pore sizes nanoconstructs accommodate a variety of pharmaceuticals from small molecules to relatively large polypeptides.20, 21 We recently reported the synthesis of thin wall hollow polymeric nanocapsules with controlled pores sizes as promising candidates for cellular delivery of therapeutic or diagnostic agents.22–28 Spherical nanocapsules were formed by the polymerization of styrene derivatives or acrylates in the hydrophobic interior of lipid bilayers. Due to the nanometer-thin walls, these hollow nanocapsules have high payload capacity. They demonstrated excellent cellular biocompatibility with no inhibition of cellular proliferation, induced apoptosis or generation of reactive oxygen species.28
We have also shown that confinement of molecules in nanocapsules dramatically increases molecules' stability.27 High water solubility, the long shelf life, low cellular toxicity28 and the tunable pore size of the nanocapsules23–25 encouraged us to investigate this promising material as emergency drug delivery vehicle. To visualize the release in vitro and in live mice, an imaging reporter, the dye ICG, was used as a model cargo. ICG is a well validated imaging agent fluorescent in NIR, it is often used in evaluating new drug delivery systems in vivo.29, 30 ICG was also chosen because of its unique optical properties that are dependent on the environment, thus the blood triggered release can be monitored by optical means. The size of ICG is similar to the size of most commonly used drug molecules. The utilization of imaging agents in the NIR range (700–950 nm) extends imaging capabilities up to several centimeters in depth due to attenuated scattering and a lack of endogenous fluorophores within this range.31–35 Because of the high penetration of NIR photons through tissue, ICG release can be easily observed in small animals with standard optical imaging techniques.
Herein, we demonstrate a novel type of the drug delivery system that releases their cargo upon contact with blood. The delivery system is based on porous nanocapsules that retain the drug during formulation and storage. After in vivo administration the rapid release of the capsules' contents (represented here by a near-infrared dye) upon contact with blood components occurs. This liberation of the encapsulated content is triggered by the interaction of the nanocapsule's shell with plasma proteins. The mechanism of such triggered release and the first demonstration of the rapid release system in small animals are given below.
RESULTS and DISCUSSION
Nanocapsules feature hydrophobic interior
The synthesis of the nanocapsules with encapsulated ICG as an imaging reporter was conducted in a fashion similar to the previously reported vesicle-templated synthesis of nanocapsules.24, 25, 27 Monomers were loaded into the lipid bilayer during the preparation of liposomes. Liposomes were prepared by hydration of lipid/monomer mixture with the aqueous solution of ICG. Unilamellar liposomes were formed by extrusion and non-entrapped ICG was removed by the size-exclusion chromatography. The polymerization was initiated with UV irradiation. To maximize the efficiency of polymerization in the presence of a large amount of dye, the pathlength of light in the quartz vessel holding the solution was kept short, approximately 3 mm, using a glass insert. The use of the UV light for crosslinking of polymer shell nanocapsules could be detrimental to ICG, resulting in permanent bleaching of the dye. Addition of ascorbic acid, a known antioxidant recently shown to protect NIR dyes from degradation by radiation,36 alleviated this problem. The presence of ascorbic acid in the aqueous solution had no negative effect on the rate of polymerization and successful formation of nanocapsules. The absorbance and fluorescence spectra of free ICG remained unchanged under these conditions.
Successful incorporation of the dye in nanocapsules was confirmed by steady state (Fig. 2, A, B) and dynamic spectroscopy (Fig. 2, C). ICG encapsulation led to a substantial ~20 nm bathochromic shift of ICG absorption/emission maxima accompanied by a substantial increase in quantum yield from and a longer fluorescence lifetime (Fig. 2, A, B and Table 1). Such trends generally indicate a change from hydrophilic to more hydrophobic environment around the fluorophore.37, 38 Indeed, a polarity function, known as solvent orientation polarizability (Δfs)39 of the nanocapsule interior, determined by fluorescence lifetime was found to be 0.305, which is similar to the polarity of methanol.38 This information was critical to establish the initial state of ICG in nanocapsules. Below we demonstrate that the release of the dye can be simply monitored by the dye's spectral characteristic resulting from the change in the environment.
Figure 2.
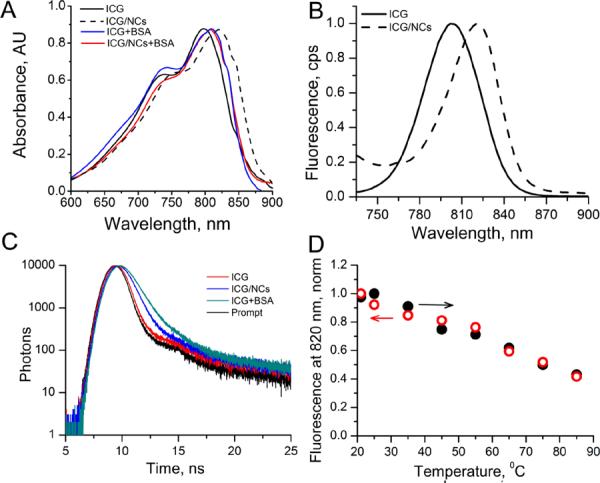
Optical characteristics of ICG and ICG-NCs and effect of BSA. Absorption (A) and emission (B) spectra of ICG and ICG-NCs in water at room temp. Ex/em.: 720/735–900 nm. C: Fluorescent decays, ex/em.: 773/820 nm. D; Thermal stability of ICG/NCs in water. Ex/em.: 720/820 nm, forward arrow (solid circles) – heating from 20 to 85°C, backward arrow (empty circles) – return from 85 to 20°C.
Table 1.
Optical properties of ICG and ICG-NCs in water
ICG-NCs demonstrate long-term shelf-life stability
For a drug delivery system the shelf-life should be sufficiently long to endure storage and shipment before use of the formulation.40 Following preparation, ICG-NCs dispersed in water were stable for more 18 months at 4°C in the dark with no change in optical properties absorption, emission (Fig. S1), lifetime (0.56 ns) and overall appearance. Thermal treatment also showed no sign of nanocapsule deterioration. The accelerated thermal stability study of ICG-NCs was evaluated by heating their aqueous suspension up to 85°C for 5 min (Fig. 1, D). The intensity at the monitored wavelength (820 nm) linearly decreased with heating and returned to the previous state after cooling (see also Fig. S2, showing that no change in the spectrum shape occurred). This behavior is common for polymethine dyes because of their temperature dependent conformational flexibility in the excited state.32 Complete reversibility of fluorescence intensity and other fluorescent parameters such as a shape of the spectra and the fluorescence lifetime indicated that ICG remained inside the nanocapsules during a heating-cooling cycle rendering sufficient thermal stability of the ICG-NC system.
Figure 1.
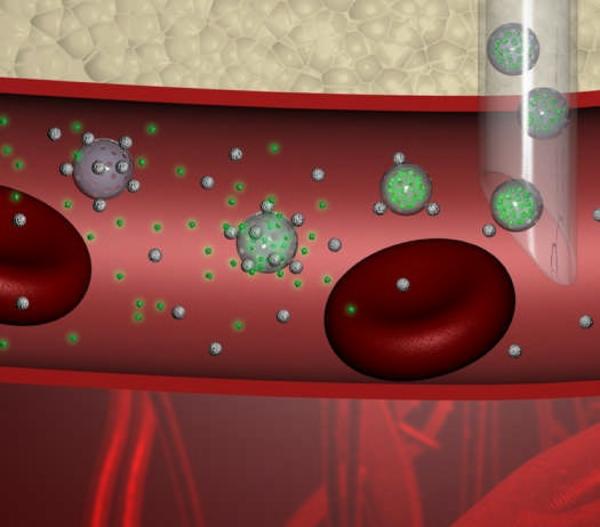
Injection of the cargo carrying nanocapsules (green large spheres) into the blood stream is followed by the attachement of serum proteins, such as albumin (small white spheres) to the surface of the nanocapsule. That leads to the release of the cargo (small green spheres) leaving the empty nanocapsules (grey large spheres) intact.
Albumin triggers release of nanocapsule's imaging cargo in vitro
The release of the dye from the nanocapsules upon contact with blood was demonstrated using fluorescence lifetime measurements and gel electrophoresis. The kinetics of the release was measured with high speed steady state spectral analysis.
We have previously shown that the fluorescence lifetime of polymethine dyes is highly sensitive to solvent polarity and can be used to evaluate polarity inside local microenvironments.38 We have also shown that the binding pockets of albumin are essentially hydrophobic with solvent orientation polarizability higher than that of methanol.38, 41 Therefore, we hypothesized that if ICG, with its known strong binding affinity to albumin (Kd =554,000 M−133) is released from the nanocapsules, albumin would bind the dye, thereby increasing its fluorescence lifetime. Alternatively, if the ICG-NCs are intact, then no change in the fluorescence lifetime of the dye should be observed.
A control experiment with the 4% BSA (to mimic the concentration of albumin in serum and blood) revealed a rapid increase of the fluorescence lifetime of ICG (Table 2). The time decays of the intact ICG-NCs and with albumin illustrate this increase (Fig. 2, C). Initial fluorescence lifetime of ICG in NCs was 0.56 ns. The resulting fluorescence lifetime of ICG-NCs treated with BSA (0.83 ns) was close to the lifetime value of neat ICG bound to albumin ~0.88 ns.41 Similar to BSA, the treatment with fetal bovine albumin (FBS) led to a rapid increase of the lifetime from initially 0.56 ns to 0.68 ns within a few minutes after mixing, suggesting essentially the same mechanism of the release.
Table 2.
Serum stability of ICG-NCs measured by the fluorescence lifetimea
| Solvent system | 5 min | 60 min | ||
|---|---|---|---|---|
|
| ||||
| average lifetime, τ ns | χ 2c | average lifetime, τ ns | χ 2c | |
| PBS | 0.56 | 1.17 | 0.59 | 1.21 |
| 4% albumin/water | 0.83 | 1.34 | 0.84 | 1.32 |
| FBS | 0.68 | 1.28 | 0.74 | 1.32 |
)Ex/em. 773/820 nm, room temperature, from three exponential fit
)First value in each column corresponds to 5 min measurement, second for 60 min
)Goodness of fit parameter
Albumin-triggered release of ICG was independently confirmed by gel electrophoresis (see Fig. 4, D). A control pre-made ICG/albumin complex moved quickly and appeared in one spot in an agarose gel (well #1). Another control, free ICG exhibited significant tailing (well #2). When the dye-loaded nanocapsules ICG-NCs were treated with albumin (wells #3 and 5), the single spot matched to that in well #1, indicating that almost the entire content of the nanocapsules was released. In contrast, ICG-NCs with no albumin treatment (well #4) did not move under the applied electric field, apparently because of the low charge of the nanocapsules (zeta potential ~ 0 mV) and/or low mobility of relatively large nanocapsules in the agarose gel indicating that all the content retained in nanocapsules.
Figure 4.
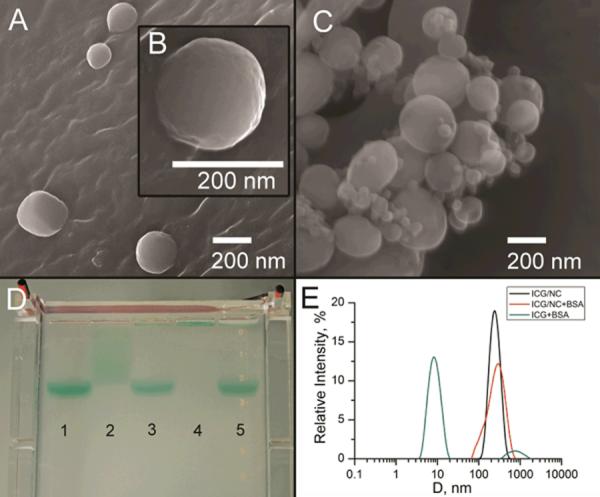
SEM images of ICG-NCs before (A, B) and after (C) addition of 4% aqueous BSA. D: Albumin-triggered release of ICG from nanocapsules, confirmed by electrophoresis in agarose gel. 1) ICG treated with BSA; 2) ICG; 3) ICG–NCs treated with BSA; 4) ICG–NCs; 5) ICG-NCs treated with BSA (3× higher concentration of ICG than in sample (3). F: Size distributions of ICG in 4% aqueous albumin (average diameter 9 nm) and ICG/nanocapsules (ICG–NCs) dispersed in water (average diameter 217 nm) and 4% aqueous BSA (average diameter 238 nm), as measured 20 min after preparation of solution.
The intensity of the emission from ICG-NCs placed in the solution of 4% albumin measured with high speed CCD diode array detector was shown to decrease with time, reflecting the release of ICG (Fig. 3, A). The decrease of the signal was also accompanied with a hypsochromic shift of the emission of ~ 14 nm (Fig. S3, A). Based on the wavelength maxima data the release profiled was constructed. (Fig. 3, B and Fig. S3, B). The data illustrate the rapid release of ICG from the nanocapsules: the half-life of ICG in NCs ~ 6 sec. Importantly, the release was not complete, ca. 9% of ICG remained in the NCs 30 minutes after their contact with an albumin solution.
Figure 3.
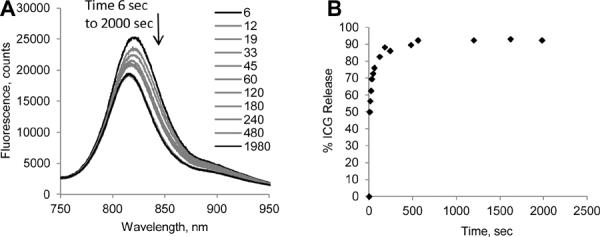
(A) Change on the emission spectra of ICG–NCs upon interaction with 4% BSA in water. Ex/em: 720/735–900 nm. Bathochromic shift of the ICG –NC contact with BSA in water is observed. (B) Cumulative release of ICG from ICG–NCs upon contact with BSA.
DLS and SEM data indicate expansion of the nanocapsules as potential mechanism of the release
Scanning electron microscopy (SEM) images of nanocapsules indicate that ICG-NCs preserved their shape after treatment with excess albumin (Fig. 4, A–C). Small spherical objects in the albumin-treated sample (Fig. 4, B) are characteristic of albumin aggregates. SEM images revealed no broken or deformed nanocapsules, supporting the proposed mechanism of release rather than collapse of the nanocapsules. Dynamic light scattering (DLS) data correlated well with average size of nanocapsules measured by SEM. Broadened size distribution observed in DLS data of albumin-treated samples were in agreement with the presence of albumin aggregates (Fig. 4, E). DLS performed in water and albumin solutions, revealed a slight size increase of ICG-loaded nanocapsules in albumin solution. This increase of the average diameter from 217 nm to 238 nm was apparently critical for dye release. Such expansion is likely to be a result of a conformational change in the polymer structure, and not solely due to the absorption of proteins to the surface of the nanoparticle. Albumin adsorbs on the polymer surface as a monolayer not exceeding 3 nanometers.42 We suggest that the adsorption of albumin favors the exposure of hydrophobic regions of the polymer network accompanied with pore expansion leading to cargo release. The detailed mechanism of such notable behavior is currently under investigation.
Fluorescence lifetime imaging confirmed quick release of ICG in vivo
Fluorescence intensity imaging in vivo provides information of the fluorophore distribution. Indeed, longitudinal fluorescence intensity mapping showed high fluorescence from the liver, gall bladder and intestines 30 min post-injection indicating the clearance via a hepatobiliary excretion pathway (Fig 5, A). This pathway is the primary route of elimination for ICG due to its strong binding affinity to albumin,43 and is also the principal clearance pathway for the majority of known nanoparticles due to their relatively large size. Since both the nanocapsule and the dye have similar clearance pathways, fluorescence intensity alone cannot be used to demonstrate the release of the imaging agent.
Figure 5.
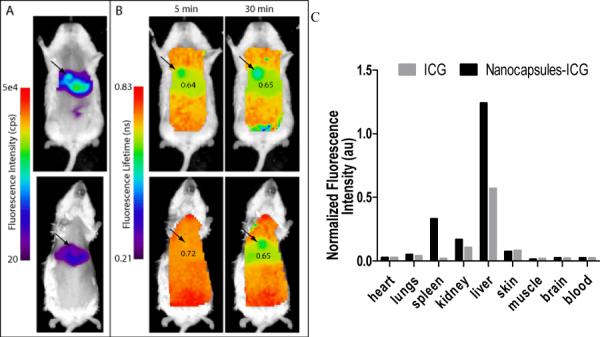
Time-domain diffuse optical imaging of mice injected with ICG and ICG-NCs. The results showing fluorescence intensity (A) (30 min) and fluorescence lifetime (B) maps of mice at about 5 and 30 min after injection of either ICG (upper) or ICG–NCs (lower). Fluorescence lifetime of ICG-NCs was initially uniformly distributed in the body with high value of 0.72 ns, and then lowered to that observed with free ICG within 30 min after injection. Ex/em.: 775/820 nm. (C): Ex vivo fluorescence distribution imaging at 30 min post-injection of softgel-ICG (black) or ICG (grey). The biodistribution profile of ICG–NCs is similar to free ICG with the exception of higher fluorescence from the spleen and liver.
In contrast, fluorescence lifetime provides information of the fluorophore environment, which means any change in the fluorophore surrounding would reflect in the measured fluorescence lifetime. Having successfully demonstrated the advantage of the fluorescence lifetime over intensity measurements to differentiate between the dye inside the nanocapsules and released into serum in vitro, we applied this approach in vivo. The most important evidence of release upon contact with blood was noticeable increase of the fluorescence lifetime almost immediately after ICG-NCs the in-tail. The initial florescence lifetime of less than 0.6 ns in PBS rose to 0.72 ns in vivo 5 min after injection, corresponding to the fluorescence lifetime of ICGNCs placed in contact with FBS in vitro (0.68 ns, Table 2). In fact, the uniform lifetime map at 5 min post-injection correlated with the likelihood of albumin interaction with nanocapsules that resulted in quick extraction of the dye.
The relatively higher lifetime values at the early time point, as compared to 0.65 ns 30 min post-injection, are likely due to the additive activity of blood proteins other than albumin, such as lipoproteins and globulins. Not surprisingly, the fluorescence lifetime values for ICG-NCs (0.65 ns) and control non-encapsulated ICG (0.64 ns) at 30 min in the liver, where most of the fluorescence signal occurred, were quite similar (Fig. 5, B). At the end of the experiment (30 min post-injection) both probes showed almost identical fluorescence lifetime values and similar biodistribution with an exception of spleen and liver. Circulating nanoparticles often accumulate in these organs;44, 45 the elevated level of the fluorescence signal for ICG-NCs suggests that the release was in fact not instantaneous and not complete by 30 min. Overall, in vivo data were in good correlation with in vitro study, and substantial increase of the fluorescent lifetime of ICGNCs before and after administration in vivo suggested a change in the dye's environment through the release mechanism.
CONCLUSIONS
We have demonstrated a new type of controlled release system for potential application in emergency medicine using hollow nanocapsules with defined pores. The nanocapsules were composed from polyacrylate shell and loaded with the NIR fluorescent reporter ICG. In the native form, nanocapsules retain ICG over an extended time. The composition was stable in aqueous buffers indicating no dye leakage within 1.5 year. Upon contact with serum proteins or blood a rapid release of the cargo into the media or blood stream was observed in vitro and in vivo. The release was attributed to a potential conformational change in the polymer frame upon contact with albumin, resulting in the expansion of nanocapsule and therefore the pores size. This expansion facilitated the diffusion of the cargo into the surrounding environment.
The limitation of the current system includes optimization of the nanocapsules design for every type of the cargo to reach the maximum efficiency in drug delivery. Other limitations include potential side effect due to non-degradable nature of the nanocapsules. Creating biodegradable nanocapsules capable of pore expansion caused by interactions with serum proteins is an attractive future extension of this work.
The general design of the nanocapsules fits well to their potential applications in medicine as rapid release nanocarriers and sets the stage for the development of other rapid drug release systems for emergency treatments and medical diagnostics. If necessary, the nanocapsules can be freeze-dried for prolonged storage and re-suspended in aqueous buffers without the loss of content. The diameter of the pores as well as the size of the nanoparticles can potentially be tuned for a specific drug molecule in order to achieve the highest rate of release and guide the required clearance pathway after the cargo is released. Such next generation systems will provide higher synthetic flexibility, facilitating the development of new therapeutic and imaging systems for emergency applications.
MATERIALS AND METHODS
Materials
Solvents: DMSO, chloroform, buffers and high purity water (18.2 MΩ) were used throughout the study. Bovine serum albumin (BSA, grade agarose gel electrophoresis, 99%), ICG (Sigma-Aldrich), fetal bovine serum (FBS), agarose (Bioline USA Inc.) were used without purification. 1,2-dimyristoyl-sn-glycero-3-phosphocholine (DMPC) was purchased from Avanti Polar Lipids, Inc. as a dry powder. Tert-butyl methacrylate (t-BMA), butyl methacrylate (BMA), used as monomers, and ethylene glycol dimethacrylate (EGDMA), used as a crosslinking agent, were purchased from Sigma-Aldrich and were passed through alumina column to remove the inhibitor shortly before the polymerization. The photoinitiator 2,2-dimethoxy-2-phenyl-acetophenone (DPA), from Sigma-Aldrich, was used without purification.
Synthesis of nanocapsules
DMPC (160 mg) was dissolved in 0.4 mL of chloroform in a test tube, then t-BMA (32 μL, 0.193 mmol), BMA (32 μL, 0.2 mmol), EGDMA (32 μL, 0.17 mmol) and initiator 2,2-dimethoxy-2-phenyl-acetophenone (3 mg, 0.01 mmol) were added. Chloroform was evaporated using a stream of purified argon to form a lipid/monomer mixture. The mixture was further dried in vacuum to remove traces of solvent. The solution of ICG (150 μM, 8 mL) in Tris buffer (pH 7.4) was added to the test tube with lipid/monomer mixture and incubated at 35°C for 30 min. During this period, the mixture was briefly vortexed every 5 min. ICG was not stable in high intensity UV light. To minimize the degradation of dye during the polymerization process, ascorbic acid was added to the reaction mixture (5 mg/mL). The suspension was extruded 20 times at 35°C through a track-etched polyester Nucleopore membrane (Sterlytech) with 100 nm pore size using a Lipex stainless steel extruder (Northern Lipids).
The sample was irradiated for 1.5 hours with UV light (λ=254 nm) in a photochemical reactor (10 lamps, 32W each; the distance between the lamps and the sample was 10 cm) using quartz tube with path length of light of approximately 3 mm. Short path length is important for efficient polymerization in the presence of dye. After polymerization, non-entrapped dye was removed by using size exclusion chromatography. Sample was passed through a Sephadex G-25 column (10 mL) twice to ensure complete removal of free dye. The faster-eluting nanocapsule fraction was collected.
Optical measurements
UV/Vis spectra of samples were recorded on spectrophotometer equipped with an integrating sphere to minimize the effect of scattering (OLIS Inc.) or DU 640 UV-visible spectrophotometer (Beckman Coulter). Samples with nanocapsules were diluted with water to four different concentrations, so that their absorptions lied between 0.1 and 1. Using Beer-Lambert's law and known molar absorptivities ICG, the concentration of the samples are calculated.
Steady state fluorescence spectra and fluorescence lifetime were recorded on a Fluorolog-3 spectrofluorometer (Horiba Jobin Yvon). The photophysical data of ICG, ICG-nanocapsules (steady-state absorption, fluorescence) and lifetime were obtained in DMSO, water, PBS buffer, 4% (mass) BSA solution and undiluted FBS as indicated. Fluorescence quantum yield of the samples were measured using comparative method with ICG in DMSO as a standard.46 Fluorescence lifetime of nanocapsules was determined using time-correlated single photon counting (TCSPC) technique with a NanoLed 773 nm excitation source as described previously.38 Fast kinetics studies were performed with Synapse CCD diode array as a detector. Fluorescence anisotropy was conducted in L-format with automated Glan-Thompson polarizing prisms controlled by FluorEssence software (Horiba) as described earlier.47
Measurement of NCs interior solvent polarity
Solvent orientation polarizability (Δf) was utilized as a solvent polarity function. This function is defined as following39:
ε − solvent dielectric constant , n − solvent refractive index
Solvent orientation polarizabilities of typical solvents are: water – 0.320, methanol – 0.309, ethanol – 0.289, DMSO – 0.263, methylene chloride – 0,217.
Polarity inside nanocapsules was defined as interior solvent orientation polarizability and was evaluated from the measured fluorescence lifetimes using the following equation and parameters previously determined in ref.38
τs − measured fluorescence lifetime in NCs, ns, τv − lifetime of a probe in vacuum, for ICG, τv =1.11 ±0.11 ns, Δf0 – solvent orientation polarizability in a hypothetical solvent where the fluorescence lifetime approaching 0, Δf0= 0.33, K − dye-specific lifetime-solvatochromic coefficient, for ICG, K = 27.5 ±6.7.
Kinetics of the release in vitro
The experiments were conducted using CCD diode array camera Synapse (Horiba) integrated in spectrophotometer Fluorolog-3. The camera allows acquiring a full spectrum (735–900 nm) in 6 seconds. A bolus of 20 μl of the ICG-NCs was added through an injection port into a cuvette containing 2 mL of 4% BSA in water with constant stirring. The first acquisition was obtained 6 sec after the injection, the shortest possible time. The acquisitions were conducted continuously up to 2000 sec. The cumulative release was calculated from the equation:
λa − emission maxima of ICG-NCs in water, nm: λb emission maximum of ICG in 4% BSA, nm: λs − emission maxima of ICG-NCs at certain time point in 4% albumin, nm. At time t=0, λs = λa (% Release = 0%, no release), at t→∞, λs = λb (% Release = 100%, complete release)
Thermal stability
ICG-NCs were suspended in PBS buffer and their temperature stability evaluated by heating from 20 to 85°C with 10 degree increment within 1 hour. The sample was then cooled down with approximately same rate (1 hour). The sample was allowed to equilibrate for 5 min at each temperature point and the fluorescence spectra of the sample were recorded. The details of the setup and temperature ramp profile were published previously.48
Serum stability
ICG-NCs stability was tested by measuring the fluorescence lifetime of the nanocapsules in PBS, 4% aqueous BSA solution, and FBS at 5 min and 1 hour after the solutions were prepared. Dynamic light scattering (DLS) of selected samples was performed on a Malvern Zetasizer Nano 20 min after preparation.
Electrophoresis experiments were carried out using an Owl A5 Large Gel System with Owl EC-105 apparatus (ThermoScientific) with an upright positioned separation chamber. All separations were performed in an agarose gel with a chamber temperature of 25°C, and electric field of 130 V. A sample (each sample contained 10% v/v of glycerol, total volume 100 μL) was injected near the anode into the flowing separation buffer (TAE buffer).
In vivo imaging
Animal studies were performed according to protocols approved by at Washington University School of Medicine Animal Studies Committee for humane care and use of laboratory animals. Mice were anesthetized with ketamine (85 mg/kg) and xylazine (15 mg/kg), IP for depilation, intravenous injections and initial post-injection imaging. Imaging agents ICG in water (25 μL, conc 60 μM) and ICG-NCs (20 μL of aqueous solutions) were administered via lateral tail vein of 6–8 week-old female Balb/c nude mice. The mice were imaged with Pearl Imager (LI-Cor Biosciences) for fluorescence intensity in the 700 nm (685 λex/710 λem) and 800 nm (785 λex/810 λem) emission channels at 5 min, 1 h, 5 h and 24 h after injection. Time-domain diffuse optical imaging of living mice was performed using the Optix MX2 system (Advanced Research Technologies) as reported previously.49
Briefly, the animals were positioned supine on the heated imaging platform. Pre-injection scans were performed to assess background and autofluorescence signals, then again at 5 and 30 min post-injection. Regions of interest were raster-scanned at 780 nm excitation with emission detection centered at 830 nm in 1.5 mm steps. Fluorescence intensity and lifetime values were determined by integration or single exponential fitting of the acquired temporal point spread function (TPSF) fluorescence decay curves for each measurement using Optiview software (Advanced Research Technologies). Fluorescence intensity and lifetime maps were created by assigning each respective value to the corresponding measurement location on a white light reference image of the mouse. Mean fluorescence intensity and lifetime values for tumor and non-tumor tissue regions of interest (ROI) for each mouse were manually selected and reported for analysis.
Biodistribution of probes were assessed using the method described previously.50, 51 Aliquots of blood and pieces of major organs (tumor, heart, kidney, lung, spleen, stomach, intestine, muscle, liver, skin and brain) were harvested and placed on a clear plastic petri dish. Fluorescence images were acquired with the Pearl Imager as described above. Mean fluorescence intensity was determined for each tissue by ROI analysis and combined for each group for statistical analysis.
Supplementary Material
ACKNOWLEDGMENT
We gratefully acknowledge financial support from the NCI/NIH R21CA149814 (MB), the Washington University Molecular Imaging Center (MB), NSF CHE-1012951 (EP), NIAMS/NIH R21 AR060408-01A1 (EP), Saint Louis University Presidential Research Fund (EP) and FedEx Institute of Technology (EP).
ABBREVIATIONS
- ICG
indocyanine green
- NCs
nanocapsules
- FBS
fetal bovine serum
References
- 1.Gu F, Zhang L, Teply BA, Mann N, Wang A, Radovic-Moreno AF, Langer R, Farokhzad OC. Proc. Natl. Acad. Sci. U.S.A. 2008;105:2586–2591. doi: 10.1073/pnas.0711714105. [DOI] [PMC free article] [PubMed] [Google Scholar]
- 2.Uhrich KE, Cannizzaro SM, Langer RS, Shakesheff KM. Chem. Rev. 1999;99:3181–3198. doi: 10.1021/cr940351u. [DOI] [PubMed] [Google Scholar]
- 3.Singh R, Lillard JW., Jr. Experimental and molecular pathology. 2009;86:215–223. doi: 10.1016/j.yexmp.2008.12.004. [DOI] [PMC free article] [PubMed] [Google Scholar]
- 4.Allen TM, Cullis PR. Science. 2004;303:1818–1822. doi: 10.1126/science.1095833. [DOI] [PubMed] [Google Scholar]
- 5.Hsiue GH, Hsu SH, Yang CC, Lee SH, Yang IK. Biomaterials. 2002;23:457–462. doi: 10.1016/s0142-9612(01)00127-2. [DOI] [PubMed] [Google Scholar]
- 6.Myerson J, He L, Lanza G, Tollefsen D, Wickline S. JTH. 2011;9:1292–1300. doi: 10.1111/j.1538-7836.2011.04339.x. [DOI] [PMC free article] [PubMed] [Google Scholar]
- 7.Chung TW, Wang SS, Tsai WJ. Biomaterials. 2008;29:228–237. doi: 10.1016/j.biomaterials.2007.09.027. [DOI] [PubMed] [Google Scholar]
- 8.Frampton JE. Drugs. 2010;70:1719–1743. doi: 10.2165/11204470-000000000-00000. [DOI] [PubMed] [Google Scholar]
- 9.Cai K, Li J, Luo Z, Hu Y, Hou Y, Ding X. Chem. Commun. (Camb) 2011;47:7719–7721. doi: 10.1039/c1cc11855b. [DOI] [PubMed] [Google Scholar]
- 10.Weinstein S, Plumer AL. Plumer's principles & practice of intravenous therapy. Lippincott Williams & Wilkins; Philadelphia: 2007. [Google Scholar]
- 11.Foinard A, Decaudin B, Barthelemy C, Debaene B, Odou P. Annals of Intensive Care. 2012;2:28. doi: 10.1186/2110-5820-2-28. [DOI] [PMC free article] [PubMed] [Google Scholar]
- 12.Kanji S, Lam J, Johanson C, Singh A, Goddard R, Fairbairn J, Lloyd T, Monsour D, Kakal J. Crit. Care Med. 2010;38:1890–1898. doi: 10.1097/CCM.0b013e3181e8adcc. [DOI] [PubMed] [Google Scholar]
- 13.Raemdonck K, Demeester J, De Smedt S. Soft Matter. 2009;5:707–715. [Google Scholar]
- 14.Zha L, Banik B, Alexis F. Soft Matter. 2011;7:5908–5916. [Google Scholar]
- 15.Soppimath KS, Aminabhavi TM, Kulkarni AR, Rudzinski WE. J. Control. Release. 2001;70:1–20. doi: 10.1016/s0168-3659(00)00339-4. [DOI] [PubMed] [Google Scholar]
- 16.Ma Z, Taylor J-S. Proc. Natl. Acad. Sci. U.S.A. 2000;97:11159–11163. doi: 10.1073/pnas.97.21.11159. [DOI] [PMC free article] [PubMed] [Google Scholar]
- 17.Dai S, Ravi P, Tam KC. Soft Matter. 2008;4:435–449. doi: 10.1039/b714741d. [DOI] [PubMed] [Google Scholar]
- 18.Fomina N, Sankaranarayanan J, Almutairi A. Adv. Drug Deliv. Rev. 2012;64:1005–1020. doi: 10.1016/j.addr.2012.02.006. [DOI] [PMC free article] [PubMed] [Google Scholar]
- 19.Hyuk Im S, Jeong U, Xia Y. Nat. Mater. 2005;4:671–675. doi: 10.1038/nmat1448. [DOI] [PubMed] [Google Scholar]
- 20.Lu PL, Chen YC, Ou TW, Chen HH, Tsai HC, Wen CJ, Lo CL, Wey SP, Lin KJ, Yen TC, Hsiue GH. Biomaterials. 2011;32:2213–2221. doi: 10.1016/j.biomaterials.2010.11.051. [DOI] [PubMed] [Google Scholar]
- 21.Hyuk Im S, Jeong U, Xia Y. Nat. Mater. 2005;4:671–675. doi: 10.1038/nmat1448. [DOI] [PubMed] [Google Scholar]
- 22.Richter AG, Dergunov SA, Ganus B, Thomas Z, Pingali SV, Urban V, Liu Y, Porcar L, Pinkhassik E. Langmuir. 2011;27:3792–3797. doi: 10.1021/la1050942. [DOI] [PMC free article] [PubMed] [Google Scholar]
- 23.Dergunov SA, Pinkhassik E. Angew. Chem. Int. Ed. Engl. 2008;47:8264–8267. doi: 10.1002/anie.200803261. [DOI] [PMC free article] [PubMed] [Google Scholar]
- 24.Dergunov SA, Kesterson K, Li W, Wang Z, Pinkhassik E. Macromolecules. 2010;43:7785–7792. doi: 10.1021/ma1012418. [DOI] [PMC free article] [PubMed] [Google Scholar]
- 25.Danila DC, Banner LT, Karimova EJ, Tsurkan L, Wang X, Pinkhassik E. Angew. Chem. Int. Ed. Engl. 2008;47:7036–7039. doi: 10.1002/anie.200801814. [DOI] [PubMed] [Google Scholar]
- 26.Banner LT, Danila DC, Sharpe K, Durkin M, Clayton B, Anderson B, Richter A, Pinkhassik E. Langmuir. 2008;24:11464–11473. doi: 10.1021/la801755b. [DOI] [PubMed] [Google Scholar]
- 27.Kim MD, Dergunov SA, Lindner E, Pinkhassik E. Anal. Chem. 2012;84:2695–2701. doi: 10.1021/ac2027657. [DOI] [PubMed] [Google Scholar]
- 28.Zhou Q, Dergunov SA, Zhang Y, Li X, Mu Q, Zhang Q, Jiang G, Pinkhassik E, Yan B. Nanoscale. 2011;3:2576–2582. doi: 10.1039/c1nr10311c. [DOI] [PubMed] [Google Scholar]
- 29.Turner D, Moshkelani D, Shemesh C, Luc D, Zhang H. Pharm. Res. 2012;29:2092–2103. doi: 10.1007/s11095-012-0738-0. [DOI] [PubMed] [Google Scholar]
- 30.Rajian JR, Fabiilli ML, Fowlkes JB, Carson PL, Wang X. Opt. Express. 2011;19:14335–14347. doi: 10.1364/OE.19.014335. [DOI] [PMC free article] [PubMed] [Google Scholar]
- 31.Achilefu S. Technology in cancer research & treatment. 2004;3:393–409. doi: 10.1177/153303460400300410. [DOI] [PubMed] [Google Scholar]
- 32.Akers WJ, Zhang Z, Berezin M, Ye Y, Agee A, Guo K, Fuhrhop RW, Wickline SA, Lanza GM, Achilefu S. Nanomedicine (Lond) 2010;5:715–726. doi: 10.2217/nnm.10.38. [DOI] [PMC free article] [PubMed] [Google Scholar]
- 33.Solomon M, Guo K, Sudlow GP, Berezin MY, Edwards WB, Achilefu S, Akers WJ. J. Biomed. Opt. 2011;16:066019. doi: 10.1117/1.3594153. [DOI] [PMC free article] [PubMed] [Google Scholar]
- 34.Zhang Z, Fan J, Cheney PP, Berezin MY, Edwards WB, Akers WJ, Shen D, Liang K, Culver JP, Achilefu S. Mol. Pharm. 2009 doi: 10.1021/mp800264k. [DOI] [PMC free article] [PubMed] [Google Scholar]
- 35.Lee J, Bogyo M. ACS Chem. Biol. 2010;5:233–243. doi: 10.1021/cb900232a. [DOI] [PMC free article] [PubMed] [Google Scholar]
- 36.Berezin MY, Guo K, Teng B, Edwards WB, Anderson CJ, Vasalatiy O, Gandjbakhche A, Griffiths GL, Achilefu S. J. Am. Chem. Soc. 2009;131:9198–9200. doi: 10.1021/ja903685b. [DOI] [PMC free article] [PubMed] [Google Scholar]
- 37.Texier I, Goutayer M, Da Silva A, Guyon L, Djaker N, Josserand V, Neumann E, Bibette J, Vinet F. J. Biomed. Opt. 2009;14:054005. doi: 10.1117/1.3213606. [DOI] [PubMed] [Google Scholar]
- 38.Berezin MY, Lee H, Akers W, Achilefu S. Biophys. J. 2007;93:2892–2899. doi: 10.1529/biophysj.107.111609. [DOI] [PMC free article] [PubMed] [Google Scholar]
- 39.Lakowicz JR. Principles of fluorescence spectroscopy. Springer; New York: 2006. [Google Scholar]
- 40.FDA. 2003;vol. revision 2 [Google Scholar]
- 41.Berezin MY, Lee H, Akers W, Nikiforovich G, Achilefu S. Photochem. Photobiol. 2007;83:1371–1378. doi: 10.1111/j.1751-1097.2007.00173.x. [DOI] [PubMed] [Google Scholar]
- 42.Kowalczyńska HM, Nowak-Wyrzykowska M, Szczepankiewicz AA, Dobkowski J, Dyda M, Kamiński J, Kołos R. Colloids Surface B. 2011;84:536–544. doi: 10.1016/j.colsurfb.2011.02.013. [DOI] [PubMed] [Google Scholar]
- 43.Leevy CM, Mendenhall CL, Lesko W, Howard MM. J. Clin. Invest. 1962;41:1169–1179. doi: 10.1172/JCI104570. [DOI] [PMC free article] [PubMed] [Google Scholar]
- 44.Soo Choi H, Liu W, Misra P, Tanaka E, Zimmer JP, Itty Ipe B, Bawendi MG, Frangioni JV. Nat. Biotech. 2007;25:1165–1170. doi: 10.1038/nbt1340. [DOI] [PMC free article] [PubMed] [Google Scholar]
- 45.Moghimi SM, Hunter AC, Murray JC. Pharmacol. Rev. 2001;53:283–318. [PubMed] [Google Scholar]
- 46.Benson RC, Kues HA. Phys. Med. Biol. 1978;23:159–163. doi: 10.1088/0031-9155/23/1/017. [DOI] [PubMed] [Google Scholar]
- 47.Gustafson TP, Cao Q, Achilefu S, Berezin MY. Chemphyschem. 2012;13:716–723. doi: 10.1002/cphc.201100916. [DOI] [PMC free article] [PubMed] [Google Scholar]
- 48.Gustafson TP, Cao Q, Wang ST, Berezin MY. Chem. Commun. (Camb) 2012 doi: 10.1039/c2cc37271a. [DOI] [PMC free article] [PubMed] [Google Scholar]
- 49.Achilefu S, Bloch S, Markiewicz MA, Zhong T, Ye Y, Dorshow RB, Chance B, Liang K. Proc. Natl. Acad. Sci. U.S.A. 2005;102:7976–7981. doi: 10.1073/pnas.0503500102. [DOI] [PMC free article] [PubMed] [Google Scholar]
- 50.Achilefu S, Dorshow RB, Bugaj JE, Rajagopalan R. Invest. Radiol. 2000;35:479–485. doi: 10.1097/00004424-200008000-00004. [DOI] [PubMed] [Google Scholar]
- 51.Bugaj JE, Achilefu S, Dorshow RB, Rajagopalan R. J. Biomed. Opt. 2001;6:122–133. doi: 10.1117/1.1352748. [DOI] [PubMed] [Google Scholar]
Associated Data
This section collects any data citations, data availability statements, or supplementary materials included in this article.