


Abstract
We present a continuous benchmarking approach for the assessment of RNA secondary structure prediction methods implemented in the CompaRNA web server. As of 3 October 2012, the performance of 28 single-sequence and 13 comparative methods has been evaluated on RNA sequences/structures released weekly by the Protein Data Bank. We also provide a static benchmark generated on RNA 2D structures derived from the RNAstrand database. Benchmarks on both data sets offer insight into the relative performance of RNA secondary structure prediction methods on RNAs of different size and with respect to different types of structure. According to our tests, on the average, the most accurate predictions obtained by a comparative approach are generated by CentroidAlifold, MXScarna, RNAalifold and TurboFold. On the average, the most accurate predictions obtained by single-sequence analyses are generated by CentroidFold, ContextFold and IPknot. The best comparative methods typically outperform the best single-sequence methods if an alignment of homologous RNA sequences is available. This article presents the results of our benchmarks as of 3 October 2012, whereas the rankings presented online are continuously updated. We will gladly include new prediction methods and new measures of accuracy in the new editions of CompaRNA benchmarks.
INTRODUCTION
Ribonucleic acid (RNA) molecules play crucial roles in living organisms; among their many other functions, they are carriers of genetic information, regulators of gene expression and catalysts of metabolic reactions. RNA molecules form complex structures (1); their linear ribonucleotide sequences directly determine the pattern of base pairs (secondary structure), which in turn determines the global shape (tertiary structure). The spatial structure of an RNA molecule is in turn an important determinant of its interactions with other molecules in the cell and, hence, its cellular function. The analysis of RNA secondary structure is an important step in its functional characterization.
For most RNA sequences, no experimental data about the structure are available. To overcome this problem, a large number of computational tools for the prediction of RNA secondary structure from sequence have been developed (2). Two main families of programs can be distinguished: single-sequence and comparative methods. A popular computational approach for predicting RNA structure from a single sequence relies on the assumption that the native RNA structure is the one with the minimum free energy (MFE). The prediction is often attained by calculating the combination of all possible base pairs, implemented in methods using dynamic programming, which are deterministic by nature and guarantee finding the structure with the lowest free energy [e.g. as in RNAfold (3)]. However, the MFE structure does not necessarily have to be biologically functional, and the ‘true’ structure may correspond to a low, but not the lowest, energy. This is also related to the fact that the MFE can change in different environment (e.g. pH, solvent conditions and so forth), and the MFE calculation itself is simplified. Besides, the folding of RNA sequences in the cellular environment may be dictated not only by thermodynamics but also by the kinetics, and it may also depend on which nucleotides are transcribed first. Thus, methods have been developed to predict not just one MFE structure, but a set of low-energy structures for a given RNA sequence [e.g. as implemented in RNAsubopt (3)]. Also a challenge connected to exploring all possible conformations of a given RNA molecule is that any RNA of length n can form 1.8n possible secondary structures. For example, a 100 nt long RNA sequence can theoretically form 1025 secondary structures. If the energy of 10 000 structures is calculated within 1 s on a regular processor, the calculation of all structures would require ∼1013 years (2). Various attempts have been made to reduce the complexity of the RNA folding problem—one of them is based on shape abstraction, which maps RNA structures to tree-like shapes. It has been demonstrated by the authors of the RNAshapes program that this approach is feasible and integrates well with dynamic programming (4). The complexity of the RNA folding problem is also often reduced by introducing heuristics to identify a structure that is likely to be biologically relevant. A variation of the heuristic approach is to sample structures from the Boltzmann ensemble (5,6) to identify large clusters of similar secondary structures with low (suboptimal) energies.
Another class of method infers the prediction based on evolutionary considerations. They require a multiple alignment of RNA sequences that are homologous to the query (related by descent from a common ancestor). There have been attempts to use other methods including the combination of both approaches discussed earlier in the text, e.g. RNAalifold combines the comparative prediction with the minimum free energy structure calculation for a set of aligned sequences (7).
A question remains, which of the available approaches for secondary structure prediction is the most accurate and which of the particular software implementations is practically the most useful (i.e. generates reasonable predictions for any RNA query sequence). In this article, we compare both single-sequence and comparative methods for RNA secondary structure prediction. One of the first attempts to compare the accuracy of methods predicting RNA secondary structure was made by Gardner and Giegerich (8), who focused on comparative methods. The Matthews correlation coefficient (MCC) was used as the major metric describing the methods’ performance. Recently, Xu et al. (9) tested the performance of predictors on two separate data sets: one consisting of tRNA sequences only and the other of 5S rRNA sequences. They emphasized that the choice of sequences for the benchmark data set strongly influenced the scores of methods because different programs may perform better on different families of sequences; hence, the benchmark data sets should be tuned for different types of tasks and scenarios in which the particular programs could be applied. Also recently, Hajiaghayi et al. (10) tested the performance of energy-based algorithms for RNA secondary structure prediction, including both MFE and MEA (maximum expected accuracy) methods. The main conclusion of their study was that the accuracy of MFE and MEA algorithms depends mostly on the underlying parameter set, and they found that the best energy-based method was the pseudo-MEA algorithm developed by Hamada et al. (11). However, comprehensive benchmarks spanning most of the currently available methods are not available. There is no benchmarking system for assessing the accuracy of RNA secondary structure prediction methods of different type (i.e. independent of the underlying algorithm) over many different data sets.
The aforementioned situation resembles the early days of protein 3D modeling: before programs for the evaluation of protein structure prediction methods were introduced, it was difficult to evaluate the quality of 3D models. The ability of human experts to predict 3D structures of proteins has been assessed in the course of the Critical Assessment of protein Structure Prediction (CASP) experiment (12), which now has a counterpart in the RNA Puzzles experiment (13). On the other hand, the performance of fully automated methods (without human intervention) was evaluated and prompted important improvements in the context of continuous and automated benchmarks Livebench (14) and EVA (15). These benchmarking programs, implemented as web servers, provided a fully automated assessment of the accuracy of methods predicting protein folds and secondary structure. Livebench and EVA have significantly contributed to the development of standards in the field of protein structure bioinformatics.
Inspired by the impact of Livebench and EVA on the protein structure prediction community, we have developed CompaRNA, an automated system for the continuous evaluation of RNA structure prediction methods. The goal of CompaRNA is to provide a ‘blind’ benchmark using experimental data before it becomes incorporated in the training data set of the assessed prediction methods. In analogy to protein structure prediction benchmarks Livebench and EVA, CompaRNA uses as a reference experimentally solved RNA structures deposited in the Protein Data Bank [PDB (16)]. It also provides the community with a ‘static’ benchmark, generated on a data set extracted from the RNAstrand database (17), which contains experimentally verified RNA secondary structures of any type and organism. RNAstrand includes a larger number of molecules than those with solved 3D structures, and it covers sequences that are on the average longer than those with known 3D structures. These benchmarks offer insight into the relative performance of different RNA secondary structure prediction methods on different types of RNA sequences and structures.
MATERIALS AND METHODS
RNA secondary structure prediction methods used for benchmarking
Most RNA secondary structure prediction methods can be divided into two general categories: those making predictions for single sequences, using various techniques ranging from free-energy minimization to machine learning (Table 1), and those making predictions for sequence families, which often infer base pairs from co-variation of bases at different positions of multiple sequence alignments (Table 2). A detailed description of all approaches and methods is out of the scope of this work, and the reader is referred to the original publications cited in Tables 1 and 2.
Table 1.
List of 28 single-sequence methods analyzed in the CompaRNA benchmarks
| Name | Description | Availability | Predicts pseudoknots | Reference |
|---|---|---|---|---|
| Afold | Evaluates internal loops of RNA secondary structure with optimized nearest-neighbor model energy functions. | Local installation | No | (18) |
| Alterna | Dynamic programming algorithm that minimizes the energy density sum and free energy of an RNA structure. | Web server | No | (19) |
| CentroidFold | Uses generalized centroid estimators that maximize the expected weighted true predictions of base pairs in the predicted structure. | Local installation | No | (20) |
| CentroidHomfold-LAST | An upgraded version of CentroidHomfold that uses additional homologous sequences collected automatically by the LAST program (21). | Web server | No | (22) |
| ContextFold | Uses rich parameterized machine-learning models (>70 000 free parameters). | Local installation | No | (23) |
| Contrafold | Uses conditional log-linear models (CLLMs), a flexible class of probabilistic models that generalize on stochastic context-free grammars (SCFGs) by using discriminative training and feature-rich scoring. | Local installation | No | (24) |
| CRWrnafold | A new version of RNAfold that uses statistical potentials derived from comparative data. | Web server | No | (25) |
| Cylofold | Simulates the folding process in a coarse-grained manner by choosing helices based on established energy rules. The steric feasibility of the chosen set of helices is checked during the folding process using a coarse-grained 3D model of the RNA structures. | Web server | Yes | (26) |
| Fold | A program from the RNAstructure package for single sequence secondary structure prediction by free-energy minimization. | Local installation | No | (27) |
| HotKnots | A heuristic algorithm that iteratively forms stable stems using a free-energy minimization criterion to identify promising candidate stems. | Local installation | Yes | (28) |
| IPknot | Predicts the maximum expected accuracy (MEA) structure using integer programming with a threshold cut. | Local installation | Yes | (29) |
| MaxExpect | A program from the RNAstructure package for secondary structure prediction by maximizing expected accuracy. | Local installation | No | (30) |
| MC-Fold | Uses a nucleotide cyclic motif (NCM) fusion process to generate a pool of secondary structures, from which the final prediction is selected. | Local installation | Yesa | (31) |
| McQFold | Markov Chain Monte Carlo (MCMC) sampling of secondary structures with pseudoknots. | Local installation | Yes | (32) |
| NanoFolder | Predicts the base pairing of potentially pseudoknotted multistrand RNA nanostructures. | Local installation | Yes | (33) |
| Pknots | A dynamic programming algorithm for ‘optimal’ RNA pseudoknot prediction. | Local installation | Yes | (34) |
| PknotsRG | Uses the same model as Pknots, but additionally uses the Turner energy rules for finding the minimum free-energy structure. Dedicated to pseudoknot prediction. | Local installation | Yes | (35) |
| ProbKnot | A program from the RNAstructure package for fast prediction of RNA secondary structure including pseudoknots. Assembles maximum expected accuracy structures from computed base pairing probabilities. | Local installation | Yes | (36) |
| RDfolder | RNA folding by energy-weighted Monte Carlo simulations. | Web server | No | (37) |
| RNAfold | RNA structure prediction program that comes with the Vienna package. Predicts MFE structures and base pair probabilities based on the dynamic programming algorithm originally developed by Zuker and Stiegler (38). The partition function algorithm is based on work by McCaskill (5). | Local installation | No | (3) |
| RNASLOpt | Predicts stable locally optimal secondary structures represented by stack configurations. | Local installation | No | (39) |
| RNAshapes | Unique suboptimal structures (shapes) are selected based on an abstract representation of RNA secondary structure, which is inspired by the dot bracket representation known from the Vienna RNA package. The user can choose from five different types of shape resolution corresponding to different abstraction levels. | Local installation | No | (4) |
| RNAsubopt | Calculates all suboptimal secondary structures within a user-defined energy range above the MFE. | Local installation | No | (3) |
| RNAwolf | Predicts an extended structure (including non-canonical base pairs and structures composed of two-diagrams). The allowed base pairs can contain all 4 × 4 nt, and the nucleotide bonds are explicitly annotated with the paired edges and isostericity information. | Local installation | No | (40) |
| Sfold | Statistical sampling of all possible structures. The sampling is weighted by partition function probabilities. | Local installation | No | (6) |
| UNAFold | An integrated collection of programs that simulate folding, hybridization and melting pathways for one or two single-stranded nucleic acid sequences. Folding (secondary structure) prediction for single-stranded RNA or deoxyribonucleic acid (DNA) combines free-energy minimization, partition function calculations and stochastic sampling. | Local installation | No | (41) |
| Vsfold4 | Uses dinucleotide pairing energies for short-range interactions and for long-range entropy interactions, an entropy-loss model based on the accumulated sum of the entropy of bonding between each base pair weighted inversed by the correlation of the RNA sequence (the Kuhn length). | Web server | No | (42) |
| Vsfold5 | An upgraded version of Vsfold4 capable of predicting pseudoknots. | Web server | Yes | (43) |
aThis feature has been deliberately disabled in our evaluation of MCFold because of its long runtime in the ‘pseudoknotted mode’.
Table 2.
A list of 13 comparative methods used in the CompaRNA benchmarks
| Name | Description | Requires alignment as input | Reference |
|---|---|---|---|
| Carnac | Combines three features: energy minimization, phylogenetic comparison and sequence conservation to predict an RNA secondary structure. | No | (44) |
| CentroidAlifold | An extension of the CentroidFold program that takes as an input multiple sequences. | Yes | (45) |
| CMfinder | An RNA motif prediction tool. It is reported to perform well on unaligned sequences with long flanking regions, and in cases when the motif is only present in a subset of sequences. It is an expectation maximization algorithm that uses covariance models for motif description, heuristics for effective motif search and a Bayesian method for structure prediction combining folding energy and sequence covariation. | No | (46) |
| Mastr | Uses an MCMC sampling approach in a simulated annealing framework, where both structure and alignment are optimized by making small local changes. The score combines the log-likelihood of the alignment, a covariation term and the base pair probabilities. | No | (47) |
| Multilign | Finds the lowest free-energy secondary structure common to more than two homologous sequences. Uses multiple iterations of Dynalign (48) to predict the conserved structure. | No | (49) |
| Murlet | A variant of the Sankoff algorithm (50), which uses an efficient scoring system that reduces the time and space requirements. | No | (51) |
| MXScarna | Performs fast structural multiple alignment of RNA sequences using a progressive alignment based on the pairwise structural alignment algorithm of SCARNA. | No | (52) |
| PETFold | Predicts the consensus RNA secondary structure from an RNA alignment. | No | (53) |
| PPfold | A new version of Pfold (54) that can predict the consensus secondary structure of RNA alignments through a stochastic context-free grammar coupled to an evolutionary model. | Yes | (55) |
| RNAalifold | Computes the minimum free-energy structure that is simultaneously formed by a set of aligned sequences. | Yes | (7) |
| RNASampler | A sampling-based program that predicts common RNA secondary structure motifs in a group of related sequences. | No | (56) |
| RSpredict | Takes into account sequence covariation and uses effective heuristics for improving accuracy. | Yes | (57) |
| TurboFold | The base pairing probabilities for a sequence are estimated by combining intrinsic information, derived from the sequence itself via the nearest neighbor thermodynamic model, with extrinsic information, derived from the other sequences in the input set. For a given sequence, the extrinsic information is computed by using pairwise-sequence-alignment–based probabilities for co-incidence with each of the other sequences, along with estimated base pairing probabilities, from the previous iteration, for the other sequences. | No | (58) |
Except for CMfinder, all these methods were run locally on CompaRNA server. If run with default options, none of them predicts pseudoknots.
In the period from 18th February 2009 to 3rd October 2012, 41 methods predicting RNA secondary structure have been tested by CompaRNA. These methods include 28 methods that take a single sequence as an input, among which 21 programs are used locally and 7 are queried as remote servers (Table 1), and 13 comparative methods, among which 9 require a sequence collection as an input and 4 use pre-calculated multiple sequence alignments (Table 2). Except for CMfinder, all comparative methods are run locally. For comparative methods, CompaRNA tries to automatically find homologous sequences for the query RNA and creates an input sequence collection or an alignment. To do this, CompaRNA queries the Rfam (59) online search engine (http://rfam.sanger.ac.uk/search/) with a target RNA sequence. If one or more tentatively homologous families that span at least 80% of the query sequence are found, CompaRNA selects the family with the lowest E-value. The 80% overlap threshold allows for exclusion of Rfam families corresponding to RNA fragments—e.g. the family PK-G12rRNA, which corresponds to a pseudoknot of domain G(G12) of 23S rRNA, cannot represent the entire structure of a 23S rRNA query. If a family that fulfills these criteria is found, CompaRNA extracts the corresponding covariance model and the seed alignment from the Rfam database. Then, a comparative method is queried with two different inputs. One includes all RNA sequences from the Rfam seed alignment and the query RNA sequence (if it was not already present in the alignment). The second type of input consists of 20 sequences—the query sequence and 19 sequences randomly selected from the seed alignment, which have an identity between 65 and 95% in comparison with the query. If a comparative method requires an alignment as an input, CompaRNA re-aligns the sequences in both sets by running Infernal (60) on a sequence collection and by using the covariance model for a given family.
All secondary structure prediction methods tested in CompaRNA are run with default options. As comparative methods are benchmarked with two different types of input (all sequences from the Rfam seed or 20 representatives), the maximum number of tests performed for each RNA sequence equals 54: 28 predictions are performed by single-sequence methods, and 26 predictions are performed by comparative methods (each of the 13 comparative methods is tested on two variants of the input alignment or sequence collection).
Data sets for benchmarking
CompaRNA benchmarks methods for predicting RNA secondary structure on two separate data sets. One data set is continuously updated by incorporating new RNAs released from the PDB database (16). The second data set was compiled from the RNAstrand database (17); it does not change over time and may serve as a constant reference benchmarking data set. The two data sets are available for download in the data sets section on the CompaRNA website. In the following sections of the manuscript, ‘PDB data set’ refers to the weekly updated data set with new RNA structures released from the PDB database, and ‘RNAstrand data set’ refers to the static data set created from the structural data extracted from the RNAstrand database. A ‘reference data set’ refers only to the PDB database—it is a data set created first in February 2009, which contains RNAs already released from the PDB database. It is continuously updated with new RNA structures released weekly.
The PDB data set
The CompaRNA server started monitoring the Protein Data Bank (16) for the release of new RNAs on 18 February 2009. To check which RNAs should be considered ‘new’ (i.e. significantly different from those that could have been used to train existing predictors), a data set of RNA structures already deposited in the PDB was generated. All RNA molecules longer than 20 nt and containing only ribonucleotides were used, regardless of whether the crystal structure contained other molecules (e.g. proteins). We ignored whether the RNA molecule under consideration was a synthetic construct. As a result of this procedure, a data set consisting of 1176 RNA sequences was created. To remove redundant RNAs, CD-HIT-EST (61) was used. The filtering was performed by comparing all aligned sequence pairs using a 90% sequence identity cut-off and assuming that a minimal alignment coverage for the longer sequence cannot exceed 70%. As a result, a reference data set consisting of 404 RNA sequences, whose structure was known before 18 February 2009, was created.
Every time a new RNA sequence is released by the PDB database, the reference data set is checked for the presence of sequence(s) highly similar to the query. If one or more such sequences are detected, then the newly released RNA is ignored and is not used for benchmarking. On the other hand, if the RNA molecule is not found to be highly similar to the previously known RNA sequences, it is added to the reference data set and further checked for its validity for benchmarking. There are two criteria for considering a given RNA as valid for benchmarking: first, it must contain secondary structure in the sense of traditional Watson–Crick cis base pairs (see later in the text); second, it must be continuous (no backbone breaks are allowed). Because many RNAs contain post-transcriptional modifications (e.g. pseudouridines, inosines, methylated nucleosides and so forth), such nucleotides are replaced by their unmodified counterparts, according to the RNA modification table from the MODOMICS database (62). The removal of modifications from 3D structures is done by the ModeRNA program (63). This step is critical because many bioinformatics methods used for RNA secondary structure prediction can usually handle only input RNA sequences containing the classical four unmodified ribonucleotide abbreviations (i.e. A, U, C and G). Finally, the residues in the PDB file are renumbered starting from 1, facilitating the subsequent annotation of base pairs. As of 3 October 2012, the reference data set of known RNAs extracted from the PDB database consisted of 590 sequences.
For every RNA added to the PDB data set, the RNAView program (64) is used to extract information about the secondary structure. If there is more than one model in the PDB file, secondary structure present in all models (100% consensus) is used as a reference. Secondary structures are extracted from the PDB files according to two definitions—‘standard’ and ‘extended’. The standard RNA base pair definition follows the Leontis and Westhof (65) classification, i.e. the canonical A–U, G–C and wobble G–U pairs that belong to the cis Watson–Crick/Watson–Crick geometry are considered as the secondary structure. The ‘extended’ secondary structure definition includes base pairs interacting using the Watson–Crick, Hoogsteen or sugar edges, in both cis and trans orientations. It also includes base pairs conforming to the ‘standard’ definition (65). Table 3 lists the number of observed base pairs for the PDB data set as of 3 October 2012. As of 3 October 2012, the filtered non-redundant PDB data set used for testing secondary structure prediction methods consisted of 121 RNAs.
Table 3.
Summary of the number of different base pair types in the PDB and RNAstrand data sets used for benchmarking RNA 2D prediction methods
| Base pair | PDB data set |
RNAstrand data set | |
|---|---|---|---|
| ‘Standard’ base pair counts | ‘Extended’ base pair counts | ‘Extended’ base pair counts | |
| CG | 2716 | 3023 | 119 146 |
| AU | 957 | 1291 | 69 220 |
| GU | 418 | 541 | 26 525 |
| AG | 0 | 637 | 4606 |
| AA | 0 | 192 | 1502 |
| AC | 0 | 150 | 2352 |
| GG | 0 | 113 | 733 |
| UU | 0 | 85 | 1975 |
| CU | 0 | 73 | 1225 |
| CC | 0 | 41 | 553 |
From the PDB data set generated by the aforementioned procedure, a smaller subset containing only pseudoknotted RNAs was created. These two data sets were further subdivided into subsets containing base pairs according to standard and extended definitions. Thus, four data sets from the PDB data set were created (Table 4).
Table 4.
Data sets used for benchmarking methods predicting RNA secondary structure
| Source | Data set name | Type of RNAs | Sequence length | Number of sequences |
|---|---|---|---|---|
| PDB | All RNAs, standard base pair definition | All | ≥20 | 121 |
| All RNAs, extended base pair definition | All | ≥20 | 121 | |
| Only pseudoknotted RNAs, standard base pair definition | Pseudoknotted | ≥20 | 33 | |
| Only pseudoknotted RNAs, extended base pair definition | Pseudoknotted | ≥20 | 62 | |
| RNAstrand | All RNAs | All | ≥20 | 1987 |
| All short RNAs | All | 21–200 | 869 | |
| All medium-sized RNAs | All | 201–800 | 818 | |
| All long RNAs | All | >800 | 287 | |
| Pseudoknotted RNAs | Pseudoknotted | ≥20 | 919 | |
| Pseudoknotted-short RNAs | Pseudoknotted | 21–200 | 53 | |
| Pseudoknotted medium-sized RNAs | Pseudoknotted | 201–800 | 610 | |
| Pseudoknotted long RNAs | Pseudoknotted | >800 | 256 |
RNAstrand data set
An independent data set for benchmarking RNA secondary structure prediction methods was created from the RNAstrand database (17). RNAstrand stores secondary structures determined experimentally, and includes many RNAs, for which the secondary structure is known in the absence of the tertiary structure. The entire RNAstrand data set containing 4666 RNA sequences and secondary structures was downloaded. The procedure for filtering this data set was essentially the same as in the case of the PDB data set. The only difference in subclassification was that no reference 3D structures could be used for all RNAstrand sequences, while some of these sequences contained annotations of non-standard base pairs; therefore, only the extended base pair definition was used for the entire data set. The RNAstrand data set used in CompaRNA consists of 1987 RNAs, and its base pair composition is shown in Table 3. This set was also split into two categories depending on the presence of pseudoknots in the reference structures. As the RNAstrand data set covers a great range of RNA sequence lengths, it has also been split into three non-overlapping groups based on sequence length: first, sequences 20–200 nt long (‘short RNAs’), second RNAs 201–800 nt long (‘medium-sized RNAs’) and third RNAs longer than 800 nt (‘long RNAs’) (Table 4). RNAstrand provides a large collection of secondary structures, much larger than the PDB data set. However, it must be emphasized that benchmarks based on this data set are not blind. The performance of knowledge-based methods assessed on this data set may be artificially inflated, as their training sets might have included sequences identical or similar to sequences in RNAstrand.
Metrics
To rank methods for RNA secondary structure prediction, CompaRNA uses three parameters: sensitivity [Equation (1)], positive predictive value [PPV; Equation (2)] and the MCC [Equation (3)]. These metrics are defined exactly as in the earlier evaluation by Gardner and Giegerich (8), with the only exception that the PPV was called ‘specificity’ in the earlier article. Calculation of all three metrics requires classification of base pairs into the following categories: TP (true positives), correctly predicted base pairs; FP (false positives), base pairs that do not exist in the reference structure; TN (true negatives), correctly predicted unpaired bases; and FN (false negatives), base pairs in the reference secondary structure, but not in the predicted one. To calculate the number of true negatives, we assumed that the minimum allowed distance between paired bases is 1 (as observed in the reference secondary structures). The TN was calculated as the number of all possible pairs left by the existing pairs. Moreover, as proposed by Gardner and Giegerich (8), the FP set was split into three subcategories: compatible false positives (neutral with respect to the predictor’s accuracy), inconsistent (conflicting with base pairs in the reference structure) and contradicting (non-nested with respect to the reference structure).
Equation 1.
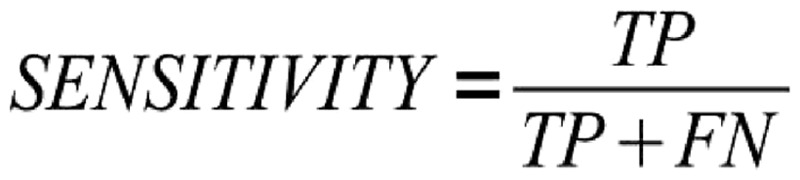
Formula for calculating sensitivity. TP = number of true-positive base pairs; FN = number of false-negative base pairs.
Equation 2.
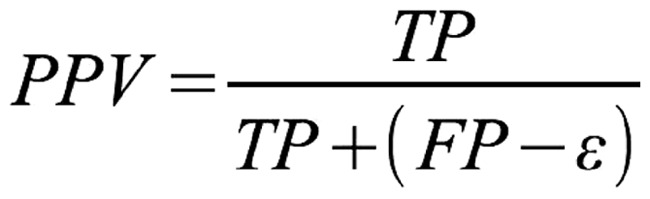
Formula for calculating PPV. TP = number of true-positive base pairs; FP = number of false-positive base pairs, ε = number of compatible false-positive base pairs.
Equation 3.
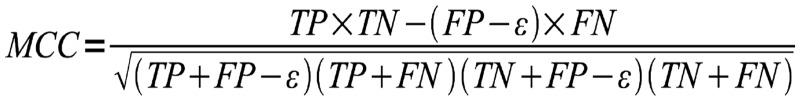
Formula for calculating the MCC. TP = number of true-positive base pairs; FP = number of false-positive base pairs, ε = number of compatible false positives, TN = true negatives; FN = false negatives.
The sensitivity is calculated as the ratio of the number of TP to the sum of TP and FN, whereas the PPV is calculated by dividing the number of TP by the sum of TP and FP reduced by the number of compatible false positives (denoted as ε), which are neutral with respect to the method’s accuracy. It has been shown that the MCC can be approximated by the geometric mean of sensitivity and PPV (66). In cases when the denominator in the MCC equation equals 0, the MCC is arbitrarily set to 0, which reflects the method’s inability to generate a prediction (i.e. MCC = 0 means that the prediction is no better than random).
Rankings
To benchmark methods predicting RNA secondary structure, CompaRNA evaluates their performance using pairwise rankings. As noted in the description of methods, every comparative method is tested on two different input alignments or sequence collections—one containing all sequences from the seed alignment, indicated by a suffix ‘(seed)’ added to the method name, and another one containing only 20 sequences, including 19 representatives of the seed and the query sequence, indicated by a suffix ‘(20)’ added to the method name. By taking into account two variants of comparative methods, 54 methods have been compared with each other, which required 1431 pairwise comparisons. Rankings are created separately for the PDB and the RNAstrand data sets. For each pair of methods, the CompaRNA server first finds the available shared predictions of RNA secondary structure (i.e. a set of RNA sequences, for which predictions were generated by a given pair of methods). In other words, each pair of methods in a given ranking is characterized by a unique data set of reference and predicted secondary structures, henceforth referred to as a pairwise data set. For each pairwise data set, CompaRNA calculates the total number of base pair counts required to calculate PPV, sensitivity and the MCC, i.e. TP, TN, FN and FP (including four FP subcategories).
Additionally, we performed a robustness test that ignored the intricacies of the algorithms used and instead was focused on the practical use of methods tested to generate useful predictions for any type of RNA sequences. Thus, we were looking for methods that can provide as good predictions as possible for all query sequences, and we penalized methods that were slow or fussy. If a given method did not return any prediction in 24 h or was incapable of generating any prediction at all for a specific RNA (e.g. because the query sequence was too long), we treated the missing prediction as if the given RNA was predicted to have no base pairs at all. We tested all methods on all 1987 RNAs from the RNAstrand data set, as well as on a subset of this data set, for which CompaRNA managed to assign an Rfam family (1242 sequences).
To check whether the difference between the performances of the two methods is significant, the Wilcoxon signed-rank test is executed for both types of rankings. It is conducted by sampling with replacement—for random 90% of RNAs from a pairwise data set, the total number of base pair counts is calculated and the MCC is obtained for each method. This procedure is repeated 40 times; thus, 40 pairs of MCC values are collected. These two sets of MCCs are used as an input for the Wilcoxon signed-rank test. CompaRNA subsequently checks whether the obtained P-value is below the cut-off of 0.001. If it is, then the difference in performance of two methods is assumed to be statistically significant. Otherwise, the performance of two methods is regarded as statistically undistinguishable. In such a case, CompaRNA labels a pairwise comparison as a draw (‘=’ in the rankings presented on the website). If the number of common RNA sequences in the pairwise data set is <10, CompaRNA applies the ‘no winner’ verdict (‘?’ in the rankings presented on the website). After analyzing 1431 pairwise comparisons, CompaRNA sums up the number of times a given method scored higher, scored lower and the number of comparisons resulting in a ‘no winner’ or ‘draw’ verdict for each method. The first rank is assigned to the method with the highest number of wins in pairwise comparisons; the second rank is assigned to the method with second highest number of wins; and so forth. The MCCs are not used to assign ranks to methods because each pair of methods is characterized by a different subset of RNAs, for which they returned a prediction. However, in the robustness tests, all methods were benchmarked on exactly the same data set consisting of either 1242 or 1987 sequences. In this case, the assignment of ranks based on the MCC criterion matches the assignment of ranks by the number of wins in pairwise comparisons, and the MCCs for all methods are shown in the ranking summary.
RESULTS
CompaRNA benchmarks RNA secondary structure prediction methods based on two different data sets: RNAstrand that contains primarily secondary structure information, and PDB that contains tertiary structure information, from which the secondary structure can be unambiguously derived. Fourteen rankings have been calculated: four for the PDB data set and ten for the RNAstrand data set, and all of them are available on the CompaRNA website.
Assignment of RNA sequences to Rfam families for testing comparative methods
As of 3 October 2012, CompaRNA assigned an Rfam family to 39.7% (48/121) of the RNA sequences from the PDB data set. In case of the RNAstrand data set, this rate was much higher—62.5% (1242/1987). The full list of Rfam families assigned to specific RNAs is provided as Supplementary File comparna_sup_data.pdf. Figure 1 shows Rfam families that are most frequently represented in the PDB and RNAstrand data sets. Comparative methods were benchmarked only on those RNAs, for which CompaRNA managed to identify an Rfam family (with the sole exception of a brutal robustness test on the full RNAstrand data set).
Figure 1.

Assignment of RNAs from the PDB (A) and RNAstrand (B) data sets to specific Rfam families. Both charts show the numbers of RNAs from different Rfam families for which CompaRNA assigned an Rfam family—in case of the PDB data set, these were 48 sequences, and in case of RNAstrand, these were 1242 sequences. The names on the charts correspond to Rfam identifiers of the following families: tRNA = transfer RNA; tmRNA = transfer-messenger RNA; RNaseP_bact_a = bacterial RNase P class A; Bacteria_small_SRP = bacterial small signal recognition particle RNA; 5S_rRNA = 5S ribosomal RNA; SSU_rRNA_bacteria = bacterial small subunit ribosomal RNA; Metazoa_SRP = metazoan signal recognition particle RNA; SSU_rRNA_eukarya = eukaryotic small subunit ribosomal RNA; Hammerhead_1 = hammerhead ribozyme (type I); K10_TLS = K10 transport/localization element (TLS); Purine = purine riboswitch; SAM = SAM riboswitch (S box leader); 5_8S_rRNA = 5.8S ribosomal RNA; crcB − crcB RNA and Gammaretro_CES = gammaretrovirus core encapsidation signal.
Rankings on RNAs extracted from the PDB database
Each of the four PDB-based data sets shown in Table 4 was used to create a ranking (Table 5). Figure 2 shows the pairwise comparison of best methods on all RNAs from the PDB data set. MXScarna(seed) (MXScarna run on the entire ‘seed’ alignment from Rfam) took the first place in rankings generated on all RNAs from the PDB data set, regardless of whether standard or extended base pair definition was used. When the standard base pairs definition was used, CentroidAlifold(20) (CentroidAlifold run on the query sequence and 19 members of the ‘seed’ alignment from Rfam) was second and CentroidFold was third. When all base pairs from the reference secondary structure were taken into account, CentroidFold took the second place and CentroidAlifold(20) was third. In case of the ranking generated on pseudoknotted RNAs from the PDB using standard base pairing information, CentroidAlifold(20) was first, RNAalifold(20) was second and CentroidAlifold(seed) and MXScarna(seed) shared the third place. When the extended base pairs definition was used, the ranking was topped by MXScarna(seed), CentroidAlifold(20) and RNAalifold(20). Single-sequence methods that scored relatively high in rankings generated on the PDB data set are CentroidFold, Sfold, Fold and ContraFold.
Table 5.
Best methods according to rankings on the PDB data set
| Ranking type | First rank | Second rank | Third rank |
|---|---|---|---|
| All RNAs | |||
| Std | MXScarna(seed) (W: 38, L: 3, NW: 12) | CentroidAlifold(20) (W: 36, L: 0, NW: 17) | CentroidFold (W: 36, L: 8, NW: 9) |
| Ext | MXScarna(seed) (W: 38, L: 2, NW: 13) | CentroidFold (W: 37, L: 7, NW: 9) | CentroidAlifold(20) (W: 36, L: 0, NW: 17) |
| Pseudoknotted RNAs | |||
| Std | CentroidAlifold(20) (W: 33, L: 0, NW: 20) | RNAalifold(20) (W: 32, L: 1, NW: 20) | CentroidAlifold(seed) and MXScarna(seed) (W: 31, L: 2, NW: 20) |
| Ext | MXScarna(seed) (W: 39, L: 1, NW: 13) | CentroidAlifold(20) (W: 35, L: 0, NW: 18) | RNAalifold(20) (W: 33, L: 2, NW: 18) |
Std = standard base pair definition; Ext = extended base pair definition (see ‘Materials and Methods’ section); W = number of wins; L = number of defeats; NW = number of cases in which it was impossible to select winner; (20) = refers to the test of a comparative method in which 20 representatives of an Rfam seed alignment were used; (seed) = refers to the test in which all sequences from a given seed alignment were used.
Figure 2.

Comparison of top performing methods predicting RNA secondary structure in a ranking generated on all RNAs extracted from the PDB data set. Plus means that a method in the left column scored higher in the pairwise comparison. Minus means that a method on the left scored lower in the pairwise comparison. Equal to denotes a draw, i.e. both methods have generated at least 10 predictions for common targets, but the accuracies of their results are statistically undistinguishable (P > 0.001). Question mark means that two methods could not have been compared (<10 predictions for common targets). The numbers in the lower left part of the figure correspond to the number of common targets on which both methods were evaluated.
Interestingly, comparative methods run on all sequences from the seed alignment on the average generate a worse RNA secondary structure prediction compared with the input composed of 20 representative sequences. In case of tests on the PDB data set, the only exception is MXScarna, which performs better when run on all sequences from the seed compared to 20 representatives, regardless of whether the standard or extended base pair definition is used.
It was not possible to test all of the comparative methods in this ranking, as the number of predictions collected for some of them (e.g. for Multilign and TurboFold in the case of a benchmark on all sequences using seed alignments) was insufficient for a statistically meaningful evaluation at the time of writing of this manuscript. Rankings generated on the PDB data sets will be automatically updated and presented on the CompaRNA website, while new RNA structures appear in the PDB database, hopefully allowing for a statistically significant evaluation of more methods in the future.
Rankings on RNAs extracted from the RNAstrand database
Because the entire RNAstrand data set is much bigger than the PDB data set (1987 versus 121 sequences), it allowed us to create subsets of sequences with different length ranges to evaluate the performance of individual methods depending on the query length. Here, we used only one definition of base pairs, i.e. extended, because RNAstrand data include non-canonical base pairs, and these cannot be disambiguated from the standard pairs for this data set.
Similarly to the benchmarks on the PDB data, each of the eight RNAstrand-based data sets showed in Table 4 was used to create a ranking. Additionally, there were two robustness tests performed—first by running secondary structure prediction methods on all 1987 RNAs from the RNAstrand data set, and second by running the test on only the subset of RNAstrand data set, for which CompaRNA managed to assign an Rfam family (1242 sequences). In total, 10 rankings on the RNAstrand data have been developed (Table 6).
Table 6.
Best methods according to rankings on the RNAstrand data set
| Ranking type | First rank | Second rank | Third rank | |
|---|---|---|---|---|
| All RNAs | ext | TurboFold(seed) (W: 52, L: 1, NW: 0) | TurboFold(20) (W: 51, L: 1, NW: 1) | ContextFold (W: 51, L: 2, NW: 0) |
| Short RNAs (20–200 nt) | ext | ContextFold (W: 53, L: 0, NW: 0) | TurboFold(20) (W: 51, L: 1, NW: 1) | CentroidHomfold-LAST and CentroidAlifold(seed) (W: 50, L: 3, NW: 0) |
| Medium-sized RNAs (201–800 nt) | ext | ContextFold (W: 43, L: 3, NW: 7) | CentroidAlifold(seed) (W: 42, L: 4, NW: 7) | TurboFold(20) (W: 40, L: 1, NW: 12) |
| Long RNAs (801–30 000 nt) | ext | ContextFold (W: 24, L: 0, NW: 29) | CentroidAlifold(seed) and CentroidAlifold(20) (W: 22, L: 1, NW: 30) | RNAalifold(seed)a (W: 21, L: 3, NW: 29) |
| All pseudoknotted RNAs | ext | CentroidAlifold(seed) (W: 46, L: 4, NW: 3) | ContextFold (W: 45, L: 5, NW: 3) | CentroidHomfold-LAST (W: 43, L: 8, NW: 2) |
| Pseudoknotted-short RNAs (20–200 nt) | ext | Cylofold (W: 35, L: 0, NW: 18) | McQFold (W: 35, L: 1, NW: 17) | Pknots (W: 33, L: 2, NW: 18) |
| Pseudoknotted medium-sized RNAs (201–800 nt) | ext | ContextFold (W: 42, L: 0, NW: 11) | TurboFold(20) (W: 39, L: 1, NW: 13) | PPfold(20) (W: 38, L: 2, NW: 13) |
| Pseudoknotted long RNAs (801–30 000 nt) | ext | ContextFold (W: 24, L: 0, NW: 29) | CentroidAlifold(seed) and CentroidAlifold(20) (W: 22, L: 1, NW: 30) | RNAalifold(seed)a (W: 21, L: 3, NW: 29) |
| Robustness test—1987 sequences | ext | ContextFold (W: 53, L: 0, NW: 0) | IPknot (W: 52, L: 1, NW: 0) | Contrafold (W: 51, L: 2, NW: 0) |
| Robustness test—1242 sequences with Rfam family assigned | ext | ContextFold (W: 53, L: 0, NW: 0) | CentroidAlifold(seed) (W: 52, L: 1, NW: 0) | IPknot (W: 51, L: 2, NW: 0) |
aFourth place.
W = number of wins; L = number of defeats; NW = number of cases in which it was impossible to select winner; (20) = refers to the test of a comparative method in which 20 representatives of an Rfam seed alignment were used; (seed) = refers to the test in which all sequences from a given seed alignment were used.
On the contrary to rankings based on sequences from the PDB data set, which were dominated by comparative methods, rankings based on the RNAstrand data set were dominated by single-sequence methods: in 7 of 10 rankings, ContextFold was the best performing method, and in one case (ranking on short-pseudoknotted RNAs), the winner was Cylofold. Only two RNAstrand-based rankings were topped by comparative methods: TurboFold(seed) topped the ranking on all RNAstrand RNAs and CentroidAlifold(seed) topped the ranking on all pseudoknotted RNAstrand RNAs.
One of the most important results of the benchmark on the RNAstrand data set is that Cylofold and other methods devoted to predicting pseudoknots perform best on sequences of short RNAs (up to 200 nt long) containing pseudoknots. In this ranking, the other best performing methods were McQFold, Pknots and PknotsRG, which are all capable of predicting pseudoknots. As it turned out in our benchmarks, the longest RNA, for which Cylofold managed to return a prediction in our test, had 255 nt residues (ASE_00408 record from the RNAstrand data set). Because of this limit, Cylofold had only been able to generate a prediction for two RNAs from the data set containing medium-sized RNAs, which is insufficient for a statistical evaluation. In the benchmarks on pseudoknotted medium-sized and long RNAs, ContextFold performed best.
The second best performing method in benchmarks on RNAstrand data was CentroidAlifold(seed) (second place in four rankings—medium-sized and long RNAs, pseudoknotted long RNAs and in the robustness test on 1242 RNA sequences). TurboFold(20) has taken the second position in three rankings—on all RNAs, short RNAs and pseudoknotted medium-sized RNAs. CentroidAlifold(20) has been second in two rankings—long and pseudoknotted long RNAs. ContextFold has been second in the ranking on all pseudoknotted RNAs; McQFold has been second in the ranking on short-pseudoknotted RNAs; and IPknot has been second in the robustness test on all 1987 sequences from the RNAstrand data set. The best-performing methods on RNAs from the RNAstrand data set are shown in Table 6.
Robustness test
Figure 3 shows the results of the robustness test on the RNAstrand data set. If a given method was unable to generate a secondary structure prediction, it was treated as if the prediction was ‘no secondary structure’, which has contributed negatively to the overall ranking of that method in this particular test. The most robust methods are ContextFold and UNAFold, which managed to return predictions for all RNAs from the RNAstrand data set. There were also methods, which returned all predictions for those sequences in the RNAstrand data set, for which CompaRNA managed to assign an Rfam family—apart from ContextFold and UNAFold, these were IPknot, Contrafold, Sfold, MaxExpect, ProbKnot, Fold and RNAfold. The most robust comparative method turned out to be MXScarna—when run with a query comprising all sequences from the Rfam seed alignment, it generated predictions for 36.6% of all RNAs and for 58.6% of RNAs assigned to an Rfam family. According to the MCC value calculated in this test, MXScarna is the 15th best method on all RNAs and 8th best method on the RNAs, for which CompaRNA managed to assign an Rfam family.
Figure 3.

The results of a robustness test on the RNAstrand data set. The numbers on the right to each bar corresponds to the percent of RNAs for which a given method returned predictions (dark = 1987 RNAs from the RNAstrand data set; light = 1242 RNAs for which CompaRNA assigned an Rfam family). (20) = refers to the test of a comparative method in which 20 representatives of an Rfam seed alignment were used; (seed) = refers to the test in which all sequences from a given seed alignment were used.
Performance of comparative methods in relation to the number of input RNA sequences
In general, comparative methods perform better when queried with an alignment comprising 20 input RNA sequences between 65 and 95% sequence identity to the query, instead of all sequences from a seed corresponding to a given Rfam family. There are exceptions to this rule—in case of the RNAstrand data set, CentroidAlifold and MXScarna exhibited better performance on queries comprising all sequences from the seed compared with just 20 representatives. As noted earlier, in case of rankings on the PDB data set, only MXScarna performed better when run on all sequences from the seed. Figure 4 shows the difference between the performances of MXScarna and CentroidAlifold run on all RNAs from RNAstrand data set (all sequences from the seeds versus 20 representatives). Figure 5 highlights the difference between the performance of MXScarna(seed) and CentroidAlifold(seed) on RNAs from different Rfam families for the RNAstrand data set—in this comparison, CentroidAlifold outperformed MXScarna on RNA sequences of the following families (n ≥ 10, P ≤ 0.01): ciliate telomerase RNA, bacterial small signal recognition particle, archaeal RNase P and bacterial RNase P (class A).
Figure 4.

Difference between the performances of MXScarna and CentroidAlifold run on RNAstrand RNAs (all sequences from the seeds versus 20 representatives). The MXScarna variants were tested on a data set consisting of 416 sequences, whereas the CentroidAlifold variants were compared on 402 sequences. For each method, an average MCC with 95% confidence interval is plotted.
Figure 5.

Difference in performance of MXScarna and CentroidAlifold on a data set consisting of 706 sequences from the RNAstrand data set, for which CompaRNA identified an Rfam family. Both methods were run on all sequences from seed alignments corresponding to the identified families. Average MCCs with 95% confidence intervals (CI) were plotted (for each Rfam family n denotes the number of sequences used to calculate average MCC and CI). Using the CI errors bars overlap rule, one can easily estimate the significance of difference in performance of two methods. If the number of MCCs used to calculate the averages is >10 and if the error bars do not overlap, then it can be assumed that P-value is <0.01 (67). CentroidAlifold outperformed MXScarna in tests on the following Rfam families (P ≤ 0.01, n ≥ 10): ciliate telomerase RNA (telomerase_CIL, n = 12), bacterial small signal recognition particle RNA (Bacteria_small_SRP, n = 84), archaeal RNase P (RNaseP_arch, n = 24) and bacterial RNase P class A (RNaseP_bact_a, n = 197).
DISCUSSION
RNA secondary structure prediction methods used for benchmarking
In our benchmarks, we attempted to include all methods for RNA secondary structure prediction that we were aware of and were freely available in any form that allows for reliable automated processing of a large number of predictions and for automated parsing of the output. In general, methods that could be easily installed were tested locally, and other methods were tested as web servers. Some of the available methods were deliberately not included in the tests, for example Mfold (68), which has been substituted by UNAFold, Pfold (54), which has been substituted by PPfold, RNAG (69), which requires a commercial package MATLAB and its ‘free’ availability is thus limited, and Lara (70), a program designed for aligning RNA sequences based on structural data, which generates RNA secondary structure prediction for the input sequence collection. Moreover, web server implementations of methods predicting RNA secondary structure were chosen if the local installation required setting up a non-standard pipeline for secondary structure prediction [e.g. as in the case of CentroidHomfold, which makes use of the LAST program (21) to pre-compute RNA sequence alignments]. CRWrnafold was only available as a binary file for MS Windows; therefore, only the web server implementation was tested. Generally, if stand alone implementations were available, they were preferred over the web server ones, to limit the influence of technical problems related to accidental server downtime. Another bottleneck was that some of the methods available for local installation required large amounts of disk space, e.g. calculating all possible RNA secondary structures—for that reason, we have set the length limit of 500 nt for the RNAsubopt method. Moreover, some methods required non-standard amounts of memory for predicting structures for long sequences, which forced us to set the input RNA sequence length limit to 500 nt (e.g. for HotKnots). On the other hand, web server methods often have an intrinsic limit on the length of input RNA sequences, e.g. Vsfold4 and Vsfold5 have the limit set to 449 nt; Cylofold has a limit of ∼250 nt (the longest RNA, for which it returned a prediction, was 255 nt); and RDfolder has a limit of 100 nt. These factors influenced the subset of sequences used in the pairwise comparison of methods. Moreover, because of the fully automated nature of the benchmark, CompaRNA ignores suboptimal secondary structures predicted by some of the methods (e.g. HotKnots and RNAsubopt). In our opinion, the decision of which suboptimal structure to choose differs from case to case and should be left to the user; hence, we have not attempted to implement any ad hoc automatic procedure. Moreover, we decided not to generate a consensus from a set of predicted suboptimal structures, because our policy was to use default parameters for all programs and in the case of methods generating suboptimal predictions, it was not clear which cut-off should be used for all the cases tested. A special case in our benchmark is CMfinder, a method devoted to predicting motifs (46). Despite the fact that it does not return a single secondary structure, but a series of motifs instead, we attempted to test it by automatically assembling a single secondary structure prediction from the best scored non-conflicting motifs. Considering the number of different methods evaluated, CompaRNA is currently the biggest RNA secondary structure prediction benchmark we are aware of.
Benchmarking methodology
The metrics taken from the study by Gardner and Giegerich (8) were used to measure the performance of methods predicting RNA secondary structures. Pairs of methods were scored on the basis of an MCC value calculated using base pair counts (TP, FP, FN and TN) for the entire pairwise data set. In other words, MCC scores for pairs of a reference structure and a predicted structure were not averaged. This so called ‘per-residue’ classification is less prone to bias resulting from uneven distribution of RNAs with different lengths (71). MCC, sensitivity and PPV were also calculated for every pair of reference and predicted structures, and their averages are available online via the CompaRNA website.
The automated processing of RNA structures for testing involves arbitrary exclusion of difficult cases that could not be handled correctly by many prediction methods. For instance, all RNA structures with backbone breaks are removed. CompaRNA also ignores helices composed of two separate single-stranded RNAs (e.g. chains C, F, I and L from the PDB record 3SIV), single-stranded RNAs that base pair with single-stranded DNAs (e.g. 3GTM, chain M) and RNA–DNA hybrids (e.g. 3GTK, chain R). During the automated processing and annotation of RNAs from the PDB data set, we used the RNAView program (64). We decided to use it because it is an established method, it is relatively robust (it has produced meaningful output for all PDB records we have tested in CompaRNA) and it is relatively fast. There are, however, cases where the annotation by RNAView can be controversial, especially in terms of standard base pair definitions. For instance, in chain ‘h’ of the PDB record 3J0L, RNAView regards U1654 as forming a canonical Watson–Crick base pair both with G1671 and G1672.
Data sets used for benchmarking
The RNAstrand data set is much larger than the PDB data set; therefore, current benchmarks on the RNAstrand data sets may be considered more reliable statistically. However, RNAstrand-based benchmarks are not blind, and we cannot exclude the possibility that some of the sequences in the testing set were used for training some of the methods tested in our work. This might also be true for the PDB data set, as the experimental determination of RNA tertiary structure is often preceded by the determination of its secondary structure. It has to be also noted that the PDB data set is biased towards shorter sequences. Thus, we agree with Hajiaghayi et al. (10) that there is no ‘ideal’ data set that would be suitable for benchmarking all RNA structure prediction methods, and it is in the best interest of the methods’ user to know the strengths and weaknesses of different methods when tested on data sets with different characteristics. We hope that our division of the PDB- and RNAstrand-based data sets into various subsets will help the users select the methods that perform best for the particular type of sequences. Recently, Widmann et al. (72) prepared a set of hand curated RNA alignments, which may also be used for testing comparative methods predicting RNA secondary structure.
Not all reference RNA structures from the RNAstrand and PDB databases have been submitted to every method tested in the CompaRNA benchmark. The reason was that individual methods have been added gradually over time during the development of CompaRNA; in particular, several methods were published after the initiation of CompaRNA (e.g. ProbKnot has been tested since 10 August 2010 and IPknot since 1 July 2011). On 1 September 2012, we have added CMfinder to CompaRNA. The late addition of CMfinder to CompaRNA benchmarks means that there are currently no comparisons of CMfinder with other methods on the PDB data—it has only been tested on the RNAstrand data set. This case proves that any method can be added to CompaRNA benchmarks at any time, and it can be tested on the RNAstrand data right away, although it may take time for a method to gather sufficient number of predictions on new structures appearing in PDB to appear in the benchmark with statistically significant scores. New methods for RNA structure prediction are published every now and then; hence, there is a tradeoff between including new methods in the benchmark and having large test sets for all methods tested. We decided to be inclusive rather than exclusive, as we believe that this approach yields more useful information for both users and developers of methods. With the growing number of RNA structures in the PDB, newly included methods will have a chance to be compared with their older competitors on growing data sets, as the rankings are periodically updated on the CompaRNA website.
Every time new RNA structures are released from the PDB database, their sequences are submitted by CompaRNA to a large number of methods predicting RNA secondary structure (41 programs as of 3 October 2012), and the obtained predictions are stored on the CompaRNA server. The predictions are generated as soon as the reference RNA structures have been processed and saved. The short period between the release of new RNA structures in the PDB database and the testing by CompaRNA serves to minimize the likelihood that the web server methods being benchmarked could ‘learn’ the correct structures before the testing begins.
Benchmark results
Our results indicate that the best comparative methods typically outperform the best single-sequence methods if homologous RNA sequences are available. The best comparative methods overall turned out to be Centroid-Alifold, MXScarna, RNAalifold and TurboFold. The performance of all of the comparative methods could have been even better if the input data were prepared manually. However, this is not possible in a fully automated benchmark. CompaRNA relies on the automatic classification of RNAs into Rfam families by the Rfam (59) online search engine (http://rfam.sanger.ac.uk/search). These automated steps can be almost certainly improved, and it is possible that different prediction methods may require different pre-processing of the input data to achieve optimal performance. For example, in some cases, the number of sequences in the seed alignments with identities to query in the range of 65–95% was <20. In such cases, the sequence alignment or collection was not used to test comparative methods at all. This is why the robustness of comparative methods run on all sequences from the seed alignment may be higher than the robustness of methods run on the representatives of the seed, as shown in Figure 3. It has to be emphasized that optimally aligning RNA sequences is a difficult problem and often intervention by human experts is required to correctly align a set of diverged RNA sequences. Thus, on the one hand, our benchmark probably undervalues the performance of comparative methods if they are run in a completely automated mode, without any human intervention. The optimal use of comparative methods may, therefore, require more pre-processing than naïvely running automated database searches and RNA alignment methods. However, on the other hand, our benchmark suggests that a big area of potential improvement in RNA secondary structure prediction may be in developing better methods for automated collection and alignment of RNA sequences.
Rankings on RNAstrand-derived data sets indicated that, currently, ContextFold is the best-performing single-sequence method. When the test set is restricted to RNAs containing pseudoknots, Cylofold performs best. However, because of the fact that Cylofold only takes as input short RNAs (up to ∼250 nt long), it is not suitable for predicting structure for longer sequences. If a longer RNA is expected to contain pseudoknots, then IPknot should be used.
It is interesting to compare the performance of methods predicting RNA secondary structure in the context of the nature of their algorithms, i.e. whether a given method was trained on RNAs with known secondary structures. Examples of trained methods include ContextFold, ContraFold and Murlet. Methods that do not rely on the information about known RNA structures usually predict secondary structure based on free-energy minimization—examples include RNAfold and Sfold. The methods that topped rankings in CompaRNA were often trained, e.g. ContextFold, CentroidFold and IPknot, in case of single-sequence methods, or CentroidAlifold in case of comparative methods. The best untrained single-sequence method is Sfold (data not shown; see the results of tests available online on the CompaRNA website) and in case of pseudoknotted RNAs—Cylofold. The best untrained comparative methods according to our benchmarks are TurboFold, MXScarna and RNAalifold.
It has to be emphasized that one cannot exclude that the good performance of the trained methods, especially ContextFold, is the result of an overfitting to the data used for training. One has to be careful when comparing the performance of trained methods using information extracted from known RNA structures against programs that use Turner rules that were based on short sequence optical melting. Nevertheless, from the perspective of a user, it is important to obtain accurate secondary structure for any RNA sequence, regardless of whether it was generated by a program that makes use of homologous sequences. If a user wants to predict secondary structure for a member of a well-annotated RNA family (e.g. tRNA), it is natural to use trained methods instead of free-energy minimization. On the other hand, if a user wants to predict secondary structure for an RNA sequence that has no homologs or that belongs to a poorly annotated Rfam family, then methods based on free-energy minimization should be recommended.
The results obtained from our benchmarks of RNA secondary structure prediction methods (i.e. the better average performance of comparative methods than the single-sequence methods) are similar to those observed in the CASP experiments focused on protein structure prediction (12). We hope that the results of CompaRNA benchmarks will stimulate the community of developers of RNA structure prediction methods to try new solutions (or combinations of the existing solutions) that will eliminate the current bottlenecks and will contribute to the improvement of useful tools available for the wide research community. We hope to support a sportive competition among the developers of methods predicting RNA secondary structure.
Summary
Benchmarking the performance of methods for RNA secondary structure prediction may be regarded as controversial—in particular the measures of success are arbitrary, and we are perfectly aware that there may be many other ways of calculating the rankings, in which any of the methods tested could score better. The same problem concerns methods for protein structure prediction, yet rigorous benchmarks, in particular CASP, Livebench and EVA, have greatly contributed to the progress in the field of protein structure prediction [review: (73)]. Recently, a CASP-like benchmark called RNA Puzzles has been organized: it involved only three RNA 3D structures, for which secondary structures have been determined (13). Thus far, there have been no initiatives in the field of structural bioinformatics of RNA analogous to Livebench or EVA, and we strongly believe that our efforts to follow these examples in CompaRNA will stimulate the development of better methods for RNA secondary structure prediction. We are aware that no benchmarks are ideal, but we hope to stimulate a discussion in the RNA field that will lead to the development of commonly accepted test sets as well as measures of performance. We cordially invite all developers to suggest new measures and ways of scoring and ranking the methods, and we will gladly include them in the CompaRNA server.
CompaRNA is available on two mirrors on the Internet: http://comparna.amu.edu.pl/ and http://iimcb.genesilico.pl/comparna/.
SUPPLEMENTARY DATA
Supplementary Data are available at NAR Online: Supplementary File.
FUNDING
European Research Council [ERC, StG grant RNA+P=123D to J.M.B.]; Polish Ministry of Science and Higher Education (currently National Science Center (NCN), grant N N301 035539) and European Social Fund (‘Scholarship support for PhD students specializing in majors strategic for Wielkopolska’s development’, Sub-measure 8.2.2 Human Capital Operational Programme, co-financed by European Union under the European Social Fund) (to T.P.); Deutscher Akademischer Austauschdienst [D/09/42768 to K.R.]; ‘Ideas for Poland’ fellowship from the Foundation for Polish Science (to J.M.B.). Funding for open access charge: ERC, StG grant RNA+P=123D to J.M.B. and NCN, grant N N301 035539 to T.P.
Conflict of interest statement. None declared.
Supplementary Material
ACKNOWLEDGEMENTS
The authors thank the developers of RNA structure prediction methods analyzed in this work for making them freely available. They are grateful to Magdalena Rother for help with RNA tertiary structure processing using ModeRNA. They also thank Marcin Magnus and Marcin Pawłowski for discussion and their invaluable support on all stages of CompaRNA development.
REFERENCES
- 1.Tinoco I, Jr, Bustamante C. How RNA folds. J. Mol. Biol. 1999;293:271–281. doi: 10.1006/jmbi.1999.3001. [DOI] [PubMed] [Google Scholar]
- 2.Mathews DH. Revolutions in RNA secondary structure prediction. J. Mol. Biol. 2006;359:526–532. doi: 10.1016/j.jmb.2006.01.067. [DOI] [PubMed] [Google Scholar]
- 3.Hofacker IL. RNA secondary structure analysis using the Vienna RNA package. Curr. Protoc. Bioinformatics. 2004 doi: 10.1002/0471250953.bi1202s04. Chapter 12, Unit 12.2. [DOI] [PubMed] [Google Scholar]
- 4.Steffen P, Voss B, Rehmsmeier M, Reeder J, Giegerich R. RNAshapes: an integrated RNA analysis package based on abstract shapes. Bioinformatics. 2006;22:500–503. doi: 10.1093/bioinformatics/btk010. [DOI] [PubMed] [Google Scholar]
- 5.McCaskill JS. The equilibrium partition function and base pair binding probabilities for RNA secondary structure. Biopolymers. 1990;29:1105–1119. doi: 10.1002/bip.360290621. [DOI] [PubMed] [Google Scholar]
- 6.Ding Y, Chan CY, Lawrence CE. Sfold web server for statistical folding and rational design of nucleic acids. Nucleic Acids Res. 2004;32:W135–W141. doi: 10.1093/nar/gkh449. [DOI] [PMC free article] [PubMed] [Google Scholar]
- 7.Bernhart SH, Hofacker IL, Will S, Gruber AR, Stadler PF. RNAalifold: improved consensus structure prediction for RNA alignments. BMC Bioinformatics. 2008;9:474. doi: 10.1186/1471-2105-9-474. [DOI] [PMC free article] [PubMed] [Google Scholar]
- 8.Gardner PP, Giegerich R. A comprehensive comparison of comparative RNA structure prediction approaches. BMC Bioinformatics. 2004;5:140. doi: 10.1186/1471-2105-5-140. [DOI] [PMC free article] [PubMed] [Google Scholar]
- 9.Xu Z, Almudevar A, Mathews DH. Statistical evaluation of improvement in RNA secondary structure prediction. Nucleic Acids Res. 2012;40:e26. doi: 10.1093/nar/gkr1081. [DOI] [PMC free article] [PubMed] [Google Scholar]
- 10.Hajiaghayi M, Condon A, Hoos HH. Analysis of energy-based algorithms for RNA secondary structure prediction. BMC Bioinformatics. 2012;13:22. doi: 10.1186/1471-2105-13-22. [DOI] [PMC free article] [PubMed] [Google Scholar]
- 11.Hamada M, Sato K, Asai K. Prediction of RNA secondary structure by maximizing pseudo-expected accuracy. BMC Bioinformatics. 2010;11:586. doi: 10.1186/1471-2105-11-586. [DOI] [PMC free article] [PubMed] [Google Scholar]
- 12.Kryshtafovych A, Moult J, Bartual SG, Bazan JF, Berman H, Casteel DE, Christodoulou E, Everett JK, Hausmann J, Heidebrecht T, et al. Target highlights in CASP9: Experimental target structures for the critical assessment of techniques for protein structure prediction. Proteins. 2011;79(Suppl 10):6–20. doi: 10.1002/prot.23196. [DOI] [PMC free article] [PubMed] [Google Scholar]
- 13.Cruz JA, Blanchet MF, Boniecki M, Bujnicki JM, Chen SJ, Cao S, Das R, Ding F, Dokholyan NV, Flores SC, et al. RNA-Puzzles: A CASP-like evaluation of RNA three-dimensional structure prediction. RNA. 2012;18:610–625. doi: 10.1261/rna.031054.111. [DOI] [PMC free article] [PubMed] [Google Scholar]
- 14.Bujnicki JM, Elofsson A, Fischer D, Rychlewski L. LiveBench-1: continuous benchmarking of protein structure prediction servers. Protein Sci. 2001;10:352–361. doi: 10.1110/ps.40501. [DOI] [PMC free article] [PubMed] [Google Scholar]
- 15.Koh IY, Eyrich VA, Marti-Renom MA, Przybylski D, Madhusudhan MS, Eswar N, Grana O, Pazos F, Valencia A, Sali A, et al. EVA: evaluation of protein structure prediction servers. Nucleic Acids Res. 2003;31:3311–3315. doi: 10.1093/nar/gkg619. [DOI] [PMC free article] [PubMed] [Google Scholar]
- 16.Berman HM, Westbrook J, Feng Z, Gilliland G, Bhat TN, Weissig H, Shindyalov IN, Bourne PE. The Protein Data Bank. Nucleic Acids Res. 2000;28:235–242. doi: 10.1093/nar/28.1.235. [DOI] [PMC free article] [PubMed] [Google Scholar]
- 17.Andronescu M, Bereg V, Hoos HH, Condon A. RNA STRAND: the RNA secondary structure and statistical analysis database. BMC Bioinformatics. 2008;9:340. doi: 10.1186/1471-2105-9-340. [DOI] [PMC free article] [PubMed] [Google Scholar]
- 18.Ogurtsov AY, Shabalina SA, Kondrashov AS, Roytberg MA. Analysis of internal loops within the RNA secondary structure in almost quadratic time. Bioinformatics. 2006;22:1317–1324. doi: 10.1093/bioinformatics/btl083. [DOI] [PubMed] [Google Scholar]
- 19.Aksay C, Salari R, Karakoc E, Alkan C, Sahinalp SC. taveRNA: a web suite for RNA algorithms and applications. Nucleic Acids Res. 2007;35:W325–W329. doi: 10.1093/nar/gkm303. [DOI] [PMC free article] [PubMed] [Google Scholar]
- 20.Sato K, Hamada M, Asai K, Mituyama T. CENTROIDFOLD: a web server for RNA secondary structure prediction. Nucleic Acids Res. 2009;37:W277–W280. doi: 10.1093/nar/gkp367. [DOI] [PMC free article] [PubMed] [Google Scholar]
- 21.Frith MC, Hamada M, Horton P. Parameters for accurate genome alignment. BMC Bioinformatics. 2010;11:80. doi: 10.1186/1471-2105-11-80. [DOI] [PMC free article] [PubMed] [Google Scholar]
- 22.Hamada M, Yamada K, Sato K, Frith MC, Asai K. CentroidHomfold-LAST: accurate prediction of RNA secondary structure using automatically collected homologous sequences. Nucleic Acids Res. 2011;39:W100–W106. doi: 10.1093/nar/gkr290. [DOI] [PMC free article] [PubMed] [Google Scholar]
- 23.Zakov S, Goldberg Y, Elhadad M, Ziv-Ukelson M. Rich parameterization improves RNA structure prediction. J. Comput. Biol. 2011;18:1525–1542. doi: 10.1089/cmb.2011.0184. [DOI] [PubMed] [Google Scholar]
- 24.Do CB, Woods DA, Batzoglou S. CONTRAfold: RNA secondary structure prediction without physics-based models. Bioinformatics. 2006;22:e90–e98. doi: 10.1093/bioinformatics/btl246. [DOI] [PubMed] [Google Scholar]
- 25.Gardner DP, Ren P, Ozer S, Gutell RR. Statistical potentials for hairpin and internal loops improve the accuracy of the predicted RNA structure. J. Mol. Biol. 2011;413:473–483. doi: 10.1016/j.jmb.2011.08.033. [DOI] [PMC free article] [PubMed] [Google Scholar]
- 26.Bindewald E, Kluth T, Shapiro BA. CyloFold: secondary structure prediction including pseudoknots. Nucleic Acids Res. 2010;38:W368–W372. doi: 10.1093/nar/gkq432. [DOI] [PMC free article] [PubMed] [Google Scholar]
- 27.Reuter JS, Mathews DH. RNAstructure: software for RNA secondary structure prediction and analysis. BMC Bioinformatics. 2010;11:129. doi: 10.1186/1471-2105-11-129. [DOI] [PMC free article] [PubMed] [Google Scholar]
- 28.Ren J, Rastegari B, Condon A, Hoos HH. HotKnots: heuristic prediction of RNA secondary structures including pseudoknots. RNA. 2005;11:1494–1504. doi: 10.1261/rna.7284905. [DOI] [PMC free article] [PubMed] [Google Scholar]
- 29.Sato K, Kato Y, Hamada M, Akutsu T, Asai K. IPknot: fast and accurate prediction of RNA secondary structures with pseudoknots using integer programming. Bioinformatics. 2011;27:i85–i93. doi: 10.1093/bioinformatics/btr215. [DOI] [PMC free article] [PubMed] [Google Scholar]
- 30.Lu ZJ, Gloor JW, Mathews DH. Improved RNA secondary structure prediction by maximizing expected pair accuracy. RNA. 2009;15:1805–1813. doi: 10.1261/rna.1643609. [DOI] [PMC free article] [PubMed] [Google Scholar]
- 31.Parisien M, Major F. The MC-Fold and MC-Sym pipeline infers RNA structure from sequence data. Nature. 2008;452:51–55. doi: 10.1038/nature06684. [DOI] [PubMed] [Google Scholar]
- 32.Metzler D, Nebel ME. Predicting RNA secondary structures with pseudoknots by MCMC sampling. J. Math. Biol. 2008;56:161–181. doi: 10.1007/s00285-007-0106-6. [DOI] [PubMed] [Google Scholar]
- 33.Bindewald E, Afonin K, Jaeger L, Shapiro BA. Multistrand RNA secondary structure prediction and nanostructure design including pseudoknots. ACS Nano. 2011;5:9542–9551. doi: 10.1021/nn202666w. [DOI] [PMC free article] [PubMed] [Google Scholar]
- 34.Rivas E, Eddy SR. A dynamic programming algorithm for RNA structure prediction including pseudoknots. J. Mol. Biol. 1999;285:2053–2068. doi: 10.1006/jmbi.1998.2436. [DOI] [PubMed] [Google Scholar]
- 35.Reeder J, Steffen P, Giegerich R. pknotsRG: RNA pseudoknot folding including near-optimal structures and sliding windows. Nucleic Acids Res. 2007;35:W320–W324. doi: 10.1093/nar/gkm258. [DOI] [PMC free article] [PubMed] [Google Scholar]
- 36.Bellaousov S, Mathews DH. ProbKnot: fast prediction of RNA secondary structure including pseudoknots. RNA. 2010;16:1870–1880. doi: 10.1261/rna.2125310. [DOI] [PMC free article] [PubMed] [Google Scholar]
- 37.Ying X, Luo H, Luo J, Li W. RDfolder: a web server for prediction of RNA secondary structure. Nucleic Acids Res. 2004;32:W150–W153. doi: 10.1093/nar/gkh445. [DOI] [PMC free article] [PubMed] [Google Scholar]
- 38.Zuker M, Stiegler P. Optimal computer folding of large RNA sequences using thermodynamics and auxiliary information. Nucleic Acids Res. 1981;9:133–148. doi: 10.1093/nar/9.1.133. [DOI] [PMC free article] [PubMed] [Google Scholar]
- 39.Li Y, Zhang S. Finding stable local optimal RNA secondary structures. Bioinformatics. 2011;27:2994–3001. doi: 10.1093/bioinformatics/btr510. [DOI] [PubMed] [Google Scholar]
- 40.zu Siederdissen CH, Bernhart SH, Stadler PF, Hofacker IL. A folding algorithm for extended RNA secondary structures. Bioinformatics. 2011;27:i129–i136. doi: 10.1093/bioinformatics/btr220. [DOI] [PMC free article] [PubMed] [Google Scholar]
- 41.Markham NR, Zuker M. UNAFold: software for nucleic acid folding and hybridization. Methods Mol. Biol. 2008;453:3–31. doi: 10.1007/978-1-60327-429-6_1. [DOI] [PubMed] [Google Scholar]
- 42.Dawson W, Fujiwara K, Kawai G, Futamura Y, Yamamoto K. A method for finding optimal rna secondary structures using a new entropy model (vsfold) Nucleosides Nucleotides Nucleic Acids. 2006;25:171–189. doi: 10.1080/15257770500446915. [DOI] [PubMed] [Google Scholar]
- 43.Dawson WK, Fujiwara K, Kawai G. Prediction of RNA pseudoknots using heuristic modeling with mapping and sequential folding. PLoS One. 2007;2:e905. doi: 10.1371/journal.pone.0000905. [DOI] [PMC free article] [PubMed] [Google Scholar]
- 44.Touzet H, Perriquet O. CARNAC: folding families of related RNAs. Nucleic Acids Res. 2004;32:W142–W145. doi: 10.1093/nar/gkh415. [DOI] [PMC free article] [PubMed] [Google Scholar]
- 45.Hamada M, Sato K, Asai K. Improving the accuracy of predicting secondary structure for aligned RNA sequences. Nucleic Acids Res. 2011;39:393–402. doi: 10.1093/nar/gkq792. [DOI] [PMC free article] [PubMed] [Google Scholar]
- 46.Yao Z, Weinberg Z, Ruzzo WL. CMfinder—a covariance model based RNA motif finding algorithm. Bioinformatics. 2006;22:445–452. doi: 10.1093/bioinformatics/btk008. [DOI] [PubMed] [Google Scholar]
- 47.Lindgreen S, Gardner PP, Krogh A. MASTR: multiple alignment and structure prediction of non-coding RNAs using simulated annealing. Bioinformatics. 2007;23:3304–3311. doi: 10.1093/bioinformatics/btm525. [DOI] [PubMed] [Google Scholar]
- 48.Mathews DH, Turner DH. Dynalign: an algorithm for finding the secondary structure common to two RNA sequences. J. Mol. Biol. 2002;317:191–203. doi: 10.1006/jmbi.2001.5351. [DOI] [PubMed] [Google Scholar]
- 49.Xu Z, Mathews DH. Multilign: an algorithm to predict secondary structures conserved in multiple RNA sequences. Bioinformatics. 2011;27:626–632. doi: 10.1093/bioinformatics/btq726. [DOI] [PMC free article] [PubMed] [Google Scholar]
- 50.Sankoff D. Simultaneous solution of the RNA folding, alignment and protosequence problems. SIAM J. Appl. Math. 1985;45:810–825. [Google Scholar]
- 51.Kiryu H, Tabei Y, Kin T, Asai K. Murlet: a practical multiple alignment tool for structural RNA sequences. Bioinformatics. 2007;23:1588–1598. doi: 10.1093/bioinformatics/btm146. [DOI] [PubMed] [Google Scholar]
- 52.Tabei Y, Asai K. A local multiple alignment method for detection of non-coding RNA sequences. Bioinformatics. 2009;25:1498–1505. doi: 10.1093/bioinformatics/btp261. [DOI] [PubMed] [Google Scholar]
- 53.Seemann SE, Menzel P, Backofen R, Gorodkin J. The PETfold and PETcofold web servers for intra- and intermolecular structures of multiple RNA sequences. Nucleic Acids Res. 2011;39:W107–W111. doi: 10.1093/nar/gkr248. [DOI] [PMC free article] [PubMed] [Google Scholar]
- 54.Knudsen B, Hein J. Pfold: RNA secondary structure prediction using stochastic context-free grammars. Nucleic Acids Res. 2003;31:3423–3428. doi: 10.1093/nar/gkg614. [DOI] [PMC free article] [PubMed] [Google Scholar]
- 55.Sukosd Z, Knudsen B, Vaerum M, Kjems J, Andersen ES. Multithreaded comparative RNA secondary structure prediction using stochastic context-free grammars. BMC Bioinformatics. 2011;12:103. doi: 10.1186/1471-2105-12-103. [DOI] [PMC free article] [PubMed] [Google Scholar]
- 56.Xu X, Ji Y, Stormo GD. RNA Sampler: a new sampling based algorithm for common RNA secondary structure prediction and structural alignment. Bioinformatics. 2007;23:1883–1891. doi: 10.1093/bioinformatics/btm272. [DOI] [PubMed] [Google Scholar]
- 57.Spirollari J, Wang JT, Zhang K, Bellofatto V, Park Y, Shapiro BA. Predicting consensus structures for RNA alignments via pseudo-energy minimization. Bioinform. Biol. Insights. 2009;3:51–69. doi: 10.4137/bbi.s2578. [DOI] [PMC free article] [PubMed] [Google Scholar]
- 58.Harmanci AO, Sharma G, Mathews DH. TurboFold: iterative probabilistic estimation of secondary structures for multiple RNA sequences. BMC Bioinformatics. 2011;12:108. doi: 10.1186/1471-2105-12-108. [DOI] [PMC free article] [PubMed] [Google Scholar]
- 59.Gardner PP, Daub J, Tate J, Moore BL, Osuch IH, Griffiths-Jones S, Finn RD, Nawrocki EP, Kolbe DL, Eddy SR, et al. Rfam: Wikipedia, clans and the “decimal” release. Nucleic Acids Res. 2011;39:D141–D145. doi: 10.1093/nar/gkq1129. [DOI] [PMC free article] [PubMed] [Google Scholar]
- 60.Nawrocki EP, Kolbe DL, Eddy SR. Infernal 1.0: inference of RNA alignments. Bioinformatics. 2009;25:1335–1337. doi: 10.1093/bioinformatics/btp157. [DOI] [PMC free article] [PubMed] [Google Scholar]
- 61.Li W, Godzik A. Cd-hit: a fast program for clustering and comparing large sets of protein or nucleotide sequences. Bioinformatics. 2006;22:1658–1659. doi: 10.1093/bioinformatics/btl158. [DOI] [PubMed] [Google Scholar]
- 62.Machnicka MA, Milanowska K, Osman Oglou O, Purta E, Kurkowska M, Olchowik A, Januszewski W, Kalinowski S, Dunin-Horkawicz S, Rother KM, et al. MODOMICS: a database of RNA modification pathways—2012 update. Nucleic Acids Res. 2013;41:D262–D267. doi: 10.1093/nar/gks1007. [DOI] [PMC free article] [PubMed] [Google Scholar]
- 63.Rother M, Rother K, Puton T, Bujnicki JM. ModeRNA: a tool for comparative modeling of RNA 3D structure. Nucleic Acids Res. 2011;39:4007–4022. doi: 10.1093/nar/gkq1320. [DOI] [PMC free article] [PubMed] [Google Scholar]
- 64.Yang H, Jossinet F, Leontis N, Chen L, Westbrook J, Berman H, Westhof E. Tools for the automatic identification and classification of RNA base pairs. Nucleic Acids Res. 2003;31:3450–3460. doi: 10.1093/nar/gkg529. [DOI] [PMC free article] [PubMed] [Google Scholar]
- 65.Leontis NB, Westhof E. Geometric nomenclature and classification of RNA base pairs. RNA. 2001;7:499–512. doi: 10.1017/s1355838201002515. [DOI] [PMC free article] [PubMed] [Google Scholar]
- 66.Gorodkin J, Stricklin SL, Stormo GD. Discovering common stem-loop motifs in unaligned RNA sequences. Nucleic Acids Res. 2001;29:2135–2144. doi: 10.1093/nar/29.10.2135. [DOI] [PMC free article] [PubMed] [Google Scholar]
- 67.Cumming G, Fidler F, Vaux DL. Error bars in experimental biology. J. Cell Biol. 2007;177:7–11. doi: 10.1083/jcb.200611141. [DOI] [PMC free article] [PubMed] [Google Scholar]
- 68.Zuker M. Mfold web server for nucleic acid folding and hybridization prediction. Nucleic Acids Res. 2003;31:3406–3415. doi: 10.1093/nar/gkg595. [DOI] [PMC free article] [PubMed] [Google Scholar]
- 69.Wei D, Alpert LV, Lawrence CE. RNAG: a new Gibbs sampler for predicting RNA secondary structure for unaligned sequences. Bioinformatics. 2011;27:2486–2493. doi: 10.1093/bioinformatics/btr421. [DOI] [PMC free article] [PubMed] [Google Scholar]
- 70.Bauer M, Klau GW, Reinert K. Accurate multiple sequence-structure alignment of RNA sequences using combinatorial optimization. BMC Bioinformatics. 2007;8:271. doi: 10.1186/1471-2105-8-271. [DOI] [PMC free article] [PubMed] [Google Scholar]
- 71.Schlessinger A, Punta M, Yachdav G, Kajan L, Rost B. Improved disorder prediction by combination of orthogonal approaches. PLoS One. 2009;4 doi: 10.1371/journal.pone.0004433. e4433. [DOI] [PMC free article] [PubMed] [Google Scholar]
- 72.Widmann J, Stombaugh J, McDonald D, Chocholousova J, Gardner P, Iyer MK, Liu Z, Lozupone CA, Quinn J, Smit S, et al. RNASTAR: an RNA STructural Alignment Repository that provides insight into the evolution of natural and artificial RNAs. RNA. 2012;18:1319–1327. doi: 10.1261/rna.032052.111. [DOI] [PMC free article] [PubMed] [Google Scholar]
- 73.Moult J. Rigorous performance evaluation in protein structure modelling and implications for computational biology. Philos. Trans. R. Soc. Lond. B Biol. Sci. 2006;361:453–458. doi: 10.1098/rstb.2005.1810. [DOI] [PMC free article] [PubMed] [Google Scholar]
Associated Data
This section collects any data citations, data availability statements, or supplementary materials included in this article.