

Abstract
Postnatal cortical synaptic development is characterized by stages of exuberant growth, pruning, and stabilization during adulthood. How gene expression orchestrates these stages of synaptic development is poorly understood. Here we report that synaptic growth-related gene expression alone does not determine cortical synaptic density changes across the human lifespan, but instead, the dynamics of cortical synaptic density can be accurately simulated by a first-order kinetic model of synaptic growth and elimination that incorporates two separate gene expression patterns. Surprisingly, modeling of cortical synaptic density is optimized when genes related to oligodendrocytes are used to determine synaptic elimination rates. Expression of synaptic growth and oligodendrocyte genes varies regionally, resulting in different predictions of synaptic density among cortical regions that concur with previous regional data in humans. Our analysis suggests that modest rates of synaptic growth persist in adulthood, but that this is counterbalanced by increasing rates of synaptic elimination, resulting in stable synaptic number and ongoing synaptic turnover in the human adult cortex. Our approach provides a promising avenue for exploring how complex interactions among genes may contribute to neurobiological phenomena across the human lifespan.
Keywords: brain development, synaptic plasticity, brain gene expression
Ramón y Cajal was first to report that neurite density during childhood exceeded that of an adult (1). Subsequent seminal studies have established that synaptic density increases rapidly during early postnatal cortical development, followed by a discrete period of synaptic pruning that typically occurs during adolescence (2–5). Synaptic and spine numbers subsequently stabilize during adulthood. Brain glucose metabolism (6) and oxygen consumption (7, 8) follow a similar course, presumably reflecting associated changes in synaptic density and proliferation. Some regional variability in the timing of these stages is apparent in primates, with higher-order association areas of the cortex exhibiting protracted periods of growth and glucose metabolism compared with primary cortical areas (9–12).
How do genes orchestrate these stages of synaptic development in the human brain? We investigated this question by comparing data from the BrainSpan Study—a genome-wide mRNA microarray analysis of dozens of regions of human brains ranging in age from several weeks postconception to 82 y of age—to published data on changes in cortical spine and synaptic density across the human lifespan (9, 11, 13). We performed weighted gene coexpression network analysis (WGCNA) of the BrainSpan data to reduce the large number of genes (17,565) to a manageable 40 modes of gene expression patterns (14). WGCNA categorizes each gene into a single cluster or module with a characteristic pattern of expression (i.e., eigengene), which can then be used for comparisons with other data (e.g., synaptic density) or, as we demonstrate here, can be used in a model with or without other eigengenes to examine how gene expression may contribute to the dynamics of synaptic density (14).
Results
Our first step was to determine whether any of the eigengenes, after constant-normalization, reflect changes in postnatal human cortical spine density (Methods and Materials; Fig. S1). We found that two eigengenes, B16 and B21, closely follow the rapid postnatal rise and subsequent gradual adolescent fall seen in cortical spine and synaptic density (Fig. 1A). Surprisingly, the genes represented by each eigengene strongly conform to those associated with mitochondria (Tables S1 and S2). The finding that gene expression related to mitochondria closely follows synaptic density is consistent with previous work demonstrating that most ATP utilization in the brain results from synaptic activity (15–17).
Fig. 1.
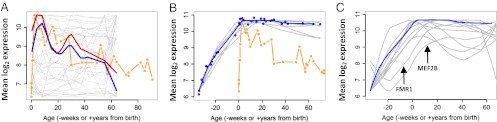
Expression of mitochondrial genes, but not of synaptic growth or elimination genes, follow the course of spine density changes across the lifespan. (A) Cortical expression of each of the 40 eigengenes and spine density data (11) were constant-normalized to a common arbitrary scale. The normalized spine density is plotted in orange, and overlying plots represent each of the eigengenes. The gray lines represent eigengenes that visually do not match the course of spine density changes. The red and blue lines represent the two eigengenes, B16 and B21, respectively, that most closely follow the spine density course. Clusters B16 and B21 are both highly enriched for mitochondrial genes. (B) Individual gene expression (gray lines, smoothed to individual gene expression values) and average gene expression (blue circles and line, smoothed to average expression values) of synaptic growth-related genes (HOMER1, MAP1A, CAMK2A, SYP, SYN1, and BAIAP2) across all cortical regions do not mirror changes in synaptic or spine density after birth (orange line). (C) Individual expression (gray lines, smoothed to individual gene expression values) of synaptic elimination-related genes (MEF2A, MEF2B, MEF2D, C1q, PARK2, FMR1, and PCDH10) are very similar to the expression of synaptic growth genes (blue line, smoothed to average expression values), with the notable exceptions of FMR1 and MEF2B, which demonstrate a somewhat delayed onset of expression.
What then about genes that have been directly associated with regulating new synaptic growth? Previous work in human brains investigating the expression of such genes have found that their expression does not diminish during childhood, and instead persists at high levels well into adulthood (13, 18). We explored the expression of these and other genes commonly associated with neurite and synaptic growth: HOMER1, MAP1A, CAMK2A, SYP, SYN1, and BAIAP2. Of note, five of these six genes are represented by cluster B1, and, collectively, their expression correlates most closely with the B1 eigengene. Cluster B1, as analyzed by Gene Ontology and brain-specific enrichment analysis, is most representative of synapses, as well as synapse formation (Tables S1 and S2) (14, 19, 20). The cortical expression of eigengene B1 and these six genes rises during periods of exuberant synaptic growth and remains elevated from childhood onward, with only a minimal decline during adulthood (Fig. 1B). This pattern of expression does not follow that of postnatal changes in human cortical spine or synaptic density (9, 11).
One possible way to reconcile this discrepancy is to suggest that genes involved in synaptic elimination are expressed with a delay compared to genes involved in synaptic growth (Fig. 2B). The difference in timing of synaptic growth- and elimination- related gene expression could then account for changes in synaptic density. We explored this possibility by examining the expression of several genes related to synaptic elimination: MEF2A, MEF2B, MEF2D, C1QA, C1QB, C1QC, LGI1, PARK2, FMR1, and PCDH10. This list includes genes primarily expressed by microglia (e.g., C1QA), another related to fragile X syndrome (FMR1), and others that also have been implicated in the processes of synaptic elimination (21). Although two of these genes (FMR1 and MEF2B) show mildly delayed expression relative to synaptic growth genes, expression of most of these elimination-related genes occurs alongside that of the synaptic growth genes (Fig. 1C). This is consistent with evidence from in vivo two-photon imaging in the rodent cortex showing that synaptic growth and elimination occur concurrently (22, 23).
Fig. 2.
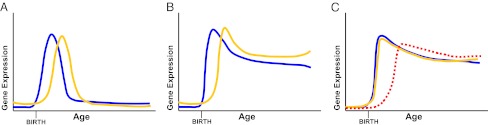
Potential models of gene expression regulating synaptic density. (A) The “classic” model of synaptic development describes an initial period of exuberant growth soon after birth (blue line) followed by a period of pruning (orange line). Theoretically, it is possible that each period is defined by the isolated expression of a set of genes. Examination of the eigengenes in Fig. S2 show that such isolated patterns of gene expression are not present, at least among the 40 modes of expression identified by WGCNA. (B) Alternatively, growth may occur during a period of unopposed expression of growth-related genes (blue line), followed by delayed onset of synaptic elimination-related genes (orange), which balance the former to produce a period of pruning and then stabilization. (C) A final model suggests that although growth and elimination genes (blue and orange lines, respectively) are expressed concurrently, a third factor (red dashed line) can alter the balance by potentiating elimination, inhibiting growth, or both.
Another possibility is that a separate set of genes may alter the balance between synaptic growth and elimination during brain development, favoring growth during childhood and a balance between the two during adulthood (Fig. 2C). Although most of the genetic machinery underlying synaptic growth and elimination is coexpressed, a separate set of genes may potentiate synaptic elimination and/or inhibit synaptic growth, thereby “triggering” a balance between synaptic growth and elimination during adulthood. To investigate this possibility, we constructed a model (designated model A) that relates cortical synaptic density to zero-order growth and first-order elimination kinetics as determined by gene (or eigengene) expression:
 |
where growth rate is set to the expression of synaptic growth genes or their related eigengene (B1), and k and c represent constants to be optimized when fitting the model to actual data. We then assigned each of the 40 eigengenes to elimination rate and compared their accuracy in producing calculated synaptic density values that best fit actual human cortical synaptic density measurements from previous studies (9, 11). Importantly, the constants k and c were optimized independently for each tested eigengene.
We found that assignment of two eigengenes, B9 and B35, to Elimination Rate minimized the error between the actual data and that predicted by model A (Fig. 3). Similar results were obtained when Growth Rate was set to the expression of synaptic growth genes rather than to that of eigengene B1 (Fig. S2). Clusters B9 and B35 are enriched for genes specific to oligodendrocytes (Table S3) (24). In addition, genes in both clusters have been identified as markers of mature and immature oligodendrocytes (e.g., MAG and MOG in B9 and GALC in B35) (24). Cluster B9 also is identified as related to oligodendrocytes by a brain-specific gene list enrichment analysis (userListEnrichment in the WGCNA package) (Table S2). Interestingly, the eigengenes for B9 and B35 are quite different during the fetal period, although in the cortex their expression rises in a similar fashion after birth (Fig. S1); the increased fetal expression of B35 is further evidence of its possible relationship to immature oligodendrocytes.
Fig. 3.

Lifespan dynamics of synaptic density can be accurately modeled by incorporating cluster B9 or B35 eigengenes to determine synaptic elimination rate. A model was constructed that relates synaptic density to zero-order growth rates established by eigengene B1 and first-order elimination rates established by a second unknown cluster. Each of the 40 gene clusters was then tested in the model as the unknown cluster, and the cumulative residual sum of squares error between predicted and actual synaptic density data were calculated. This shows that clusters B9 and B35 (green circles, indicated by the arrow) minimize the residual sum of squares. Similar results are seen when using the average expression of the six synaptic growth genes (Fig. S2).
To further evaluate the accuracy of the model, we explored how well each combination of eigengenes (40 × 40 = 1,600) incorporated into model A fit the measured spine density data. For eigengenes B1 and B9, the Akaike information criterion (AIC) was among the top 1.3% of fits. In addition, Elimination Rate was most frequently represented by eigengene B9 among the top model fits (i.e., when clusters other than B1 represent growth rate). For this reason, and considering that B35 contains far fewer genes than B9, yielding less certain Gene Ontology and enrichment results, we focused on B9 for the remainder of our analysis.
Incorporating eigengene B9 in model A with optimized k and c values yielded synaptic density calculations that rose rapidly after birth, “pruned” during adolescence, and stabilized during adulthood (Fig. 4 A and B, Right), closely following measurements from previously published data (9, 11). The model predicted an ∼3.2% synaptic growth rate and ∼1.0% synaptic elimination rate per week during infancy. The growth rate subsequently fell to ∼1.8% in adults, but was matched by an increased synaptic elimination rate of 1.8%. These values are gross approximations, given the relative simplicity of the model, and do not take into consideration that some synapses are nearly permanently stable, whereas others are highly transient. Nevertheless, the predicted rates are similar to those identified in adult mouse cortex via two-photon imaging (22, 23, 25). Furthermore, whereas synaptic turnover rates in adult mice vary across laboratories—possibly owing to differences in skull preparation techniques, among other factors (23)—and also may differ between rodents and humans, our results remain consistent with the general finding of a twofold to threefold decrease in cortical synaptic growth rates from infancy to adulthood, as seen in mice (22).
Fig. 4.

Modeling synaptic density with gene expression patterns predicts differences among association areas, primary sensorimotor regions, and limbic system of the cortex. (A) In neocortical association areas, which include prefrontal, medial frontal, and parietal regions of the cortex, eigengene expression of synaptic growth gene cluster B1 (Left, blue circles and line) and the oligodendrocyte-related cluster B9 (Left, red circles and line) accurately predict spine density changes in the prefrontal cortex of humans (Right, blue line prediction); red circles represent actual spine density measurements, replotted from Petanjek et al. (11). (B) Similar analysis in primary sensorimotor cortical regions reveals a close fit to actual synaptic density changes in the auditory cortex, replotted from Huttenlocher and Dabholkar (9). (C) Similar analysis in limbic regions, including the hippocampus and amygdala, shows marked differences in the eigengene expression related to synaptic growth (Left, blue) and oligodendrocytes (Left, red) compared with other cortical regions in A and B. The predicted synaptic density (Right, orange line) in the limbic system is also different from other cortical regions in that it does not demonstrate a distinct period of pruning during adolescence. Comparative data from human hippocampus or amygdala are currently not available.
Previous studies have demonstrated that changes in spine and synaptic density may vary among cortical regions (9, 10, 26). We compared our calculated synaptic density with these data by examining the differences in eigengene expression of the synaptic growth genes (B1) and oligodendrocyte genes (B9), divided into cortical groups: neocortical association areas, primary sensorimotor areas, and the limbic system (hippocampus and amygdala). Expression levels of the synaptic growth eigengene (B1) were slightly higher for association areas compared with primary areas, and higher for primary areas compared with the limbic system (Fig. 4, Left). However, oligodendrocyte-related (B9) eigengene expression exceeds B1 expression earlier and to a greater degree in primary areas than in association areas, and even more so in limbic regions. Model A again predicts close approximations of actual data for the prefrontal cortex and primary auditory cortex (Fig. 4 A and B, Right). The model also predicts decreased synaptic density in the limbic system (Fig. 4C, Right). No data on synaptic or spine density changes in the human hippocampus are currently available for comparison, but our results will provide a testable hypothesis once such data become available.
It is feasible that other models may improve the fit in relating eigengenes B1 and B9 to the temporal dynamics of synaptic density. Model A involves two free constants (k and c), zero-order growth, and first-order elimination kinetics. Other models involving one, two, or even three free parameters; models applying linear and log transformations; and models using B9 as a divisive rather than a subtractive factor may provide a better fit to actual synaptic density data. We constructed 18 alternative models and optimized the free constants in each using the technique described above. Model A fit the data better than all of these alternative models except model R, which had a 1.1-point lower corrected AIC value (Table S4). Model R is nearly identical to model A, except it also incorporates a third parameter that uses B9 as a divisive “growth inhibitory” factor, suggesting that growth inhibition may be an additional mechanism through which B9 genes influence synaptic density.
Discussion
Accumulating evidence indicates that the processes underlying synaptic development continue well beyond childhood (27); examples include protracted periods of myelination and pruning in the human frontal lobe, preserved capacity of structural gray matter changes in adults after learning tasks, and direct visualization of continual synaptic turnover in adult mice (11, 23, 25, 28). Myelination in particular appears to vary in both developmental timing and extent across brain regions and across species (29, 30). Our results suggest that this process may have important effects on the plasticity of different brain regions in each species.
Further evidence exists for the role of oligodendrocytes and oligodendrocyte precursor cells in regulating synaptic elimination (21). Recent studies have demonstrated increases in synaptic density after selective knockout of oligodendrocytes in mice (31). Oligodendrocytes also produce chondroitin sulfate proteoglycans, which are the primary constituents of perineuronal nets and increase synaptic elimination rates (21). In the present study, a more complex but equivalently informative model (model R) predicts that oligodendrocyte genes also inhibit synaptic growth, consistent with previous reports that myelin-associated proteins and glycoproteins have potent neurite growth inhibitory properties (32, 33). Thus, oligodendrocytes likely play an important role in synaptic elimination and maturation of cortical circuits beyond their traditional role in myelination, perhaps by destabilizing unwanted and immature synapses. It is important to recognize that our results do not negate the important roles of other cells, such as microglia, in synaptic elimination (21), although our data do suggest that these other processes are timed to occur alongside synaptic growth gene expression rather than at a delay.
Although synaptic growth genes remain highly expressed in the cortex, cortical synaptic density nevertheless remains stable, or even decreases slightly over time, in adults. Our model suggests that this stability in synaptic number is related not only to a modest decrease in synaptic growth rate, but also to an equal potentiation of synaptic elimination rates during adulthood. Thus, stable synaptic density in the adult brain results from homeostatic balance between genes that control synaptic growth and elimination, rather than near cessation of synaptic growth altogether. Our model hints at the potential to recover exuberant synaptic growth in the adult brain by inhibiting mechanisms that potentiate synaptic elimination. Whether this would improve or impair recovery from brain injury is difficult to predict, however, and endogenous mechanisms that perform this inhibitory action may already exist.
It is striking that the eigengenes that most closely follow the trajectory of postnatal spine density change are associated with mitochondria. Mitochondria are the main sources of ATP from glycolysis, which in the brain is driven largely by synaptic activity (15–17). Correspondingly, whole brain oxygen consumption, which likely reflects ATP production and utilization in the brain, follows a similar course (8). Cerebral glucose metabolism also increases during early childhood (6), at a greater rate compared with whole brain oxygen consumption (∼2-fold vs 1.5-fold, respectively, compared with adult levels of glucose and oxygen consumption). It is intriguing to speculate that this may represent excess glucose consumption [i.e., “aerobic glycolysis” (34)] during early childhood, precisely when synaptic growth rates are highest as predicted by our model A.
Our study has some important limitations. As is typical for any study based primarily on mRNA levels, our study neglects the important contributions of posttranscriptional processing and regulation. The choice of genes to represent synaptic growth is arbitrary and subject to an evolving science that might eventually redefine the roles of these genes in the brain. We tested other genes thought to be involved with synaptic growth (e.g., BDNF) with unchanged results, but ultimately, it remains possible that future investigations will identify a few of the genes used in this study as responsible for functions other than synaptic growth. A similar limitation applies to our selection of genes to represent synaptic elimination. Another limitation of this study is that our modeling cannot hope to account for the myriad factors that can affect synaptic growth and elimination rates; the most successful model in our study used three different free parameters, and given the complexity of neurologic systems, our models are almost certainly oversimplified. Continued collection of mammalian cortical data across the lifespan will provide further insight into these additional factors and their relative importance.
Our goal in this effort was to introduce a gene expression-based modeling approach to generate hypotheses on how complex genetic interactions may result in neurobiological phenomena, such as lifespan changes in human cortical synaptic density. An interesting finding from this approach is that oligodendrocyte-related genes may have a role in determining synaptic elimination rates. Applied to animal models and/or more extensive data comparing healthy and diseased brains, this approach can be extended to test various hypotheses and, ultimately, uncover increasingly complex interactions through which genes and the environment influence synaptic and other biological changes in the healthy or diseased brain.
Methods and Materials
Whole-genome exon microarray data summarized to genes was downloaded from the Gene Expression Omnibus database using GEOqueryR (dataset record: GDS25219) (13). The data were divided into an expression set (17,565 genes and 1,340 samples) and a phenotypic set, each with details on all samples, including age, brain region, postmortem interval, and RNA integrity number (RIN). To ensure high-quality data, any donor brain sample set with >25% of samples with an RIN <7.5 were removed. Given that only two samples were acquired from donor brain HSB169, that sample was also deleted from the dataset, leaving 1,130 samples in the final dataset. The data were then quantile-normalized. Normalization to exclude batch effects could not be performed, because batches were highly correlated with age, a critical variable in this analysis.
WGCNA was performed on this preprocessed dataset (14). Different WGCNA parameters were tested (with power varying from 5 to 7, merge-cut height varying from 0.10 to 0.20, and signed and unsigned networks), and the parameter set that yielded 40 clusters (power, 5; merge-cut height, 0.10; signed hybrid network) was used, to help better differentiate clusters of genes and increase the power of the analysis. All clusters were related to one another using WGCNA (Fig. S3), analyzed with a popular Gene Ontology method, the Database for Annotation, Visualization, and Integrated Discovery v. 6.7 (DAVID), and further inspected with a brain-specific gene list enrichment program (userListEnrichment in the WGCNA R package) (14, 19, 20). To balance regional specificity with statistical power, regions were collated into six broad classifications: cerebellum, thalamus, striatum, hippocampus and amygdala, primary sensorimotor areas, and neocortical association areas. Eigengenes, which represent the first principle component of expression for all of the genes within each cluster, were calculated as described previously (14), and their expression was evaluated in each of the foregoing six regions.
Cortical eigengene expression was constant-normalized (i.e., multiplied by a constant to equalize range and then mean-adjusted), and then visually compared with spine density changes over the postnatal period for which spine density data are available. Only those eigengenes that closely overlapped spine density changes (B16 and B21) were selected.
To demonstrate the discrepancy between synaptic growth gene expression and synaptic density, genes related to synaptic growth were manually curated from the literature. Given the uncertainty in the literature regarding how each gene contributes to synaptic growth, we used different combinations of the six genes chosen, to ensure that results were robust to varying selection of these genes. The cluster most closely associated with synaptic growth genes (B1) was identified by choosing the highest Pearson correlation between a cluster’s eigengene and the average spatiotemporal expression of synaptic growth genes. Similarly, to examine the expression pattern of synaptic elimination genes, independent genes known to be associated with cortical synaptic elimination were curated from the literature. Inclusion of additional genes with less current evidence for either process did not significantly alter the results.
Synaptic density was modeled according to model A. For each time point t, growth rate was defined as equal to the cortical eigengene expression of the synaptic growth cluster (B1) before and nearest to time point t. Elimination rate was similarly defined as equal to the cortical eigengene expression of an unknown cluster, to be chosen among the 40 clusters from the WGCNA. Note that time intervals were counted in weeks. Constants k and c were optimized via the default gradient descent technique (Nelder–Mead), implemented in optimR to minimize the sum-squared error between the modeled synaptic density and previously collected spine and synaptic density data in humans.
This process was repeated for each of the 40 clusters, including the synaptic growth cluster (B1). The results showed that clusters B9 and B35 provided the best fit to the data. The analysis was then repeated assigning the average expression of the six synaptic growth genes to growth rate to show that this, rather than the B1 eigengene, yielded nearly identical results. A similar analysis was then performed with each paired combination of eigengenes (a total of 1,600 versions of model A) to demonstrate how well the particular combination of B1 and B9 or B35 fit the data compared with other eigengenes. The data demonstrated that clusters B9 and B35 are related to oligodendrocytes by showing that among the 40 clusters analyzed, these were, respectively, the first and third most strongly enriched for genes specific to oligodendrocytes (Tables S1, S2, and S3) (24). Finally, with B1 and B9, synaptic density was again calculated independently for association areas, primary cortex, and limbic cortex. Because independent spine or synaptic density data in human limbic regions across the lifespan are not available, k and c optimized for primary cortex (auditory) data were used to derive expected synaptic density changes in the limbic cortex based on model A.
An additional 18 models were constructed involving one, two, or three free constants; B1 eigengene expression to represent growth rate; and B9 eigengene expression to represent the elimination and/or inhibitory rate with various linear, log, subtractive, and divisive operators. The constants in each of these models were optimized using the default gradient optimization technique in optimR as above, to minimize the residual sum of squares calculated between the predicted synaptic densities and actual spine densities from Petanjek et al. (11). A corrected AIC value was calculated using the minimized residual sum of squares and number of parameters in each model. The data analysis (R script), raw data reformatted from the BrainSpan study Gene Expression Omnibus submission (R data format), and other data (R data format) are available at ftp://imaging.wustl.edu/pub/goyal/.
Supplementary Material
Acknowledgments
We thank Ed Lein (Allen Institute for Brain Science) and Bradley Schlaggar (Washington University School of Medicine) for their suggestions and reviews of earlier versions of this manuscript. We also thank our reviewers for their thoughtful criticisms and suggestions.
Footnotes
The authors declare no conflict of interest.
This article contains supporting information online at www.pnas.org/lookup/suppl/doi:10.1073/pnas.1303453110/-/DCSupplemental.
References
- 1.Ramón y Cajal S. Recollections of My Life. Cambridge, MA: MIT Press; 1989. [Google Scholar]
- 2.Huttenlocher PR, de Courten C, Garey LJ, Van der Loos H. Synaptogenesis in human visual cortex—evidence for synapse elimination during normal development. Neurosci Lett. 1982;33(3):247–252. doi: 10.1016/0304-3940(82)90379-2. [DOI] [PubMed] [Google Scholar]
- 3.Rakic P, Bourgeois JP, Eckenhoff MF, Zecevic N, Goldman-Rakic PS. Concurrent overproduction of synapses in diverse regions of the primate cerebral cortex. Science. 1986;232(4747):232–235. doi: 10.1126/science.3952506. [DOI] [PubMed] [Google Scholar]
- 4.Cragg BG. The density of synapses and neurons in normal, mentally defective ageing human brains. Brain. 1975;98(1):81–90. doi: 10.1093/brain/98.1.81. [DOI] [PubMed] [Google Scholar]
- 5.Lund JS, Boothe RG, Lund RD. Development of neurons in the visual cortex (area 17) of the monkey (Macaca nemestrina): A Golgi study from fetal day 127 to postnatal maturity. J Comp Neurol. 1977;176(2):149–188. doi: 10.1002/cne.901760203. [DOI] [PubMed] [Google Scholar]
- 6.Chugani HT, Phelps ME, Mazziotta JC. Positron emission tomography study of human brain functional development. Ann Neurol. 1987;22(4):487–497. doi: 10.1002/ana.410220408. [DOI] [PubMed] [Google Scholar]
- 7.Takahashi T, Shirane R, Sato S, Yoshimoto T. Developmental changes of cerebral blood flow and oxygen metabolism in children. AJNR Am J Neuroradiol. 1999;20(5):917–922. [PMC free article] [PubMed] [Google Scholar]
- 8.Kennedy C, Sokoloff L. An adaptation of the nitrous oxide method to the study of the cerebral circulation in children: Normal values for cerebral blood flow and cerebral metabolic rate in childhood. J Clin Invest. 1957;36(7):1130–1137. doi: 10.1172/JCI103509. [DOI] [PMC free article] [PubMed] [Google Scholar]
- 9.Huttenlocher PR, Dabholkar AS. Regional differences in synaptogenesis in human cerebral cortex. J Comp Neurol. 1997;387(2):167–178. doi: 10.1002/(sici)1096-9861(19971020)387:2<167::aid-cne1>3.0.co;2-z. [DOI] [PubMed] [Google Scholar]
- 10.Elston GN, Oga T, Fujita I. Spinogenesis and pruning scales across functional hierarchies. J Neurosci. 2009;29(10):3271–3275. doi: 10.1523/JNEUROSCI.5216-08.2009. [DOI] [PMC free article] [PubMed] [Google Scholar]
- 11.Petanjek Z, et al. Extraordinary neoteny of synaptic spines in the human prefrontal cortex. Proc Natl Acad Sci USA. 2011;108(32):13281–13286. doi: 10.1073/pnas.1105108108. [DOI] [PMC free article] [PubMed] [Google Scholar]
- 12.Epstein HT. Stages of increased cerebral blood flow accompany stages of rapid brain growth. Brain Dev. 1999;21(8):535–539. doi: 10.1016/s0387-7604(99)00066-2. [DOI] [PubMed] [Google Scholar]
- 13.Kang HJ, et al. Spatio-temporal transcriptome of the human brain. Nature. 2011;478(7370):483–489. doi: 10.1038/nature10523. [DOI] [PMC free article] [PubMed] [Google Scholar]
- 14.Langfelder P, Horvath S. WGCNA: An R package for weighted correlation network analysis. BMC Bioinformatics. 2008;9:559. doi: 10.1186/1471-2105-9-559. [DOI] [PMC free article] [PubMed] [Google Scholar]
- 15.Sibson NR, et al. Stoichiometric coupling of brain glucose metabolism and glutamatergic neuronal activity. Proc Natl Acad Sci USA. 1998;95(1):316–321. doi: 10.1073/pnas.95.1.316. [DOI] [PMC free article] [PubMed] [Google Scholar]
- 16.Kasischke KA, Vishwasrao HD, Fisher PJ, Zipfel WR, Webb WW. Neural activity triggers neuronal oxidative metabolism followed by astrocytic glycolysis. Science. 2004;305(5680):99–103. doi: 10.1126/science.1096485. [DOI] [PubMed] [Google Scholar]
- 17.Raichle ME, Mintun MA. Brain work and brain imaging. Annu Rev Neurosci. 2006;29:449–476. doi: 10.1146/annurev.neuro.29.051605.112819. [DOI] [PubMed] [Google Scholar]
- 18.Eastwood SL, et al. Synaptophysin protein and mRNA expression in the human hippocampal formation from birth to old age. Hippocampus. 2006;16(8):645–654. doi: 10.1002/hipo.20194. [DOI] [PubMed] [Google Scholar]
- 19.Huang W, Sherman BT, Lempicki RA. Systematic and integrative analysis of large gene lists using DAVID bioinformatics resources. Nat Protoc. 2009;4(1):44–57. doi: 10.1038/nprot.2008.211. [DOI] [PubMed] [Google Scholar]
- 20.Miller JA, et al. Strategies for aggregating gene expression data: The collapseRows R function. BMC Bioinformatics. 2011;12:322. doi: 10.1186/1471-2105-12-322. [DOI] [PMC free article] [PubMed] [Google Scholar]
- 21.Eroglu C, Barres BA. Regulation of synaptic connectivity by glia. Nature. 2010;468(7321):223–231. doi: 10.1038/nature09612. [DOI] [PMC free article] [PubMed] [Google Scholar]
- 22.Maret S, Faraguna U, Nelson AB, Cirelli C, Tononi G. Sleep and waking modulate spine turnover in the adolescent mouse cortex. Nat Neurosci. 2011;14(11):1418–1420. doi: 10.1038/nn.2934. [DOI] [PMC free article] [PubMed] [Google Scholar]
- 23.Bhatt DH, Zhang S, Gan WB. Dendritic spine dynamics. Annu Rev Physiol. 2009;71:261–282. doi: 10.1146/annurev.physiol.010908.163140. [DOI] [PubMed] [Google Scholar]
- 24.Cahoy JD, et al. A transcriptome database for astrocytes, neurons, and oligodendrocytes: A new resource for understanding brain development and function. J Neurosci. 2008;28(1):264–278. doi: 10.1523/JNEUROSCI.4178-07.2008. [DOI] [PMC free article] [PubMed] [Google Scholar]
- 25.Holtmaat A, Svoboda K. Experience-dependent structural synaptic plasticity in the mammalian brain. Nat Rev Neurosci. 2009;10(9):647–658. doi: 10.1038/nrn2699. [DOI] [PubMed] [Google Scholar]
- 26.Sowell ER, et al. Mapping cortical change across the human life span. Nat Neurosci. 2003;6(3):309–315. doi: 10.1038/nn1008. [DOI] [PubMed] [Google Scholar]
- 27.Bruer JT. The Myth of the First Three Years: A New Understanding of Early Brain Development and Lifelong Learning. New York: Free Press; 1999. [Google Scholar]
- 28.Zatorre RJ, Fields RD, Johansen-Berg H. Plasticity in gray and white: Neuroimaging changes in brain structure during learning. Nat Neurosci. 2012;15(4):528–536. doi: 10.1038/nn.3045. [DOI] [PMC free article] [PubMed] [Google Scholar]
- 29.Miller DJ, et al. Prolonged myelination in human neocortical evolution. Proc Natl Acad Sci USA. 2012;109(41):16480–16485. doi: 10.1073/pnas.1117943109. [DOI] [PMC free article] [PubMed] [Google Scholar]
- 30.Miller JH, McKinstry RC, Philip JV, Mukherjee P, Neil JJ. Diffusion-tensor MR imaging of normal brain maturation: A guide to structural development and myelination. AJR Am J Roentgenol. 2003;180(3):851–859. doi: 10.2214/ajr.180.3.1800851. [DOI] [PubMed] [Google Scholar]
- 31.Doretto S, et al. Oligodendrocytes as regulators of neuronal networks during early postnatal development. PLoS ONE. 2011;6(5):e19849. doi: 10.1371/journal.pone.0019849. [DOI] [PMC free article] [PubMed] [Google Scholar]
- 32.McKerracher L, et al. Identification of myelin-associated glycoprotein as a major myelin-derived inhibitor of neurite growth. Neuron. 1994;13(4):805–811. doi: 10.1016/0896-6273(94)90247-x. [DOI] [PubMed] [Google Scholar]
- 33.Chen MS, et al. Nogo-A is a myelin-associated neurite outgrowth inhibitor and an antigen for monoclonal antibody IN-1. Nature. 2000;403(6768):434–439. doi: 10.1038/35000219. [DOI] [PubMed] [Google Scholar]
- 34.Vaishnavi SN, et al. Regional aerobic glycolysis in the human brain. Proc Natl Acad Sci USA. 2010;107(41):17757–17762. doi: 10.1073/pnas.1010459107. [DOI] [PMC free article] [PubMed] [Google Scholar]
Associated Data
This section collects any data citations, data availability statements, or supplementary materials included in this article.