

Abstract
Children with language-learning impairment (LLI) have consistently shown difficulty with tasks requiring precise, rapid auditory processing. Remediation based on neural plasticity assumes that the temporal precision of neural coding can be improved by intensive training protocols. Here, we examined the extent to which early oscillatory responses in auditory cortex change after audio-visual training, using combined source modeling and time-frequency analysis of the human electroencephalogram (EEG). Twenty-one elementary school students diagnosed with LLI underwent the intervention for an average of 32 days. Pre- and post-training assessments included standardized language/literacy tests and EEG recordings in response to fast-rate tone doublets. Twelve children with typical language development were also tested twice, with no intervention given. Behaviorally, improvements on measures of language were observed in the LLI group following completion of training. During the first EEG assessment, we found reduced amplitude and phase-locking of early (45–75 ms) oscillations in the gamma-band range (29–52 Hz), specifically in the LLI group, for the second stimulus of the tone doublet. Amplitude reduction for the second tone was no longer evident for the LLI children post-intervention, although these children still exhibited attenuated phase-locking. Our findings suggest that specific aspects of inefficient sensory cortical processing in LLI are ameliorated after training.
Keywords: auditory temporal processing, computerized training, electroencephalography, phase locking, specific language impairment, spectral power
The human cerebral cortex is a massively parallel, dynamic network, which is continuously reorganizing itself in a nonlinear fashion (Elbert & Heim, 2001). During ontogenesis, the development of this complex neuropil is impacted by a spectrum of factors ranging from genetic to experience-related influences (Gilbert, Dobyns, & Lahn, 2005; Penhune, 2011). Variations in genes and environment may result in conditions, which negatively diverge from typical brain and behavioral development. In this vein, language-based learning disabilities, including specific language impairment (SLI; problems in oral language acquisition) and dyslexia (difficulty in learning to read and spell) have been hypothesized to be a consequence of atypical cortical organization (Merzenich, Schreiner, Jenkins, & Wang, 1993). Given the neurobehavioral similarities between SLI and dyslexia, the term language-learning impairment (LLI) has become increasingly popular among researchers to encompass children with language and/or literacy difficulties (Tallal, 2001). Children with LLI have frequently been found to exhibit deficiencies in perceiving rapid changes in acoustic signals. This deficit may hinder the acquisition of precise phonemic temporal structures, during sensitive periods of development (Tallal, 2004). Phonemic representations are thought to contribute to higher-level linguistic learning, from semantics (word meaning) to syntax (grammatical rules), and ultimately for linking graphemes (printed characters) to phonemes (smallest meaningful sounds; Pennington & Bishop, 2009; Peeva et al., 2010). Accordingly, a set of prospective longitudinal studies using convergent methods have emphasized the essential role of rapid auditory processing (RAP) skills in infancy for later language achievement (Heim & Benasich, 2006; Choudhury & Benasich, 2011). Research on experience-related changes of sensory cortical maps in animals (de Villers-Sidani & Merzenich, 2011) has supported the notion that dysfunctional phonemic representations may be altered beyond early childhood. This approach has led to the design of neuroplasticity-based remedies, which assume that the temporal precision of neural coding can be enhanced by intense training in an optimal learning environment. Fast ForWord Language® (FFW) is a computerized intervention program with the focus to establish RAP skills underlying oral language and early reading abilities (Scientific Learning Corporation, 2001). Children with LLI who completed FFW in controlled learning settings exhibited not only an acceleration in auditory rate processing, but also significant gains on measures of language and literacy, as well as complimentary changes in metabolic brain activity (Merzenich et al., 1996; Tallal et al., 1996; Temple et al., 2003; Gaab, Gabrieli, Deutsch, Tallal, & Temple, 2007).
The present research examined the extent to which FFW intervention is related to changes in the temporal organization of sensory processing in LLI. A sensory brain response that is well-suited to study temporal organization is the evoked gamma-band response (GBR), which can be readily extracted from the electroencephalogram (EEG). Evoked GBRs in sensory systems have been associated with re-tuning of cortical networks underlying perception as a function of emotional learning (Heim & Keil, 2006; Keil, Stolarova, Moratti, & Ray, 2007). Of interest for the present study, evoked GBRs have also been implicated as a potential index of matching processes comparing incoming stimulus features with existing memory representations (Herrmann, Munk, & Engel, 2004). Auditory GBRs are quantified by time-frequency analysis of EEG segments recorded while listening to auditory events (Pantev, 1995). Typically characterized by an early onset (50–70 ms post-stimulus) and a frequency of around 40 Hz, these phase-locked oscillations have been linked to integrative processing and plastic changes in sensory networks (Knief, Schulte, Bertrand, & Pantev, 2000). Because GBRs are defined in the frequency domain, phase-locking indices can be computed in addition to amplitude measures, describing the temporal stability of oscillatory activity across trials (Lachaux, Chavez, & Lutz, 2003).
Previous work has demonstrated the sensitivity of early GBRs to inter-individual differences in RAP: Adults with poor reading abilities have been reported to show attenuated cross-scalp coherence in the gamma range (a measure of spectral similarity across electrodes) to brief and rapid successive tones, compared to adults with average reading performance (Nagarajan et al., 1999). With respect to the condition LLI, Heim, Friedman, Keil, and Benasich (2011) found that diagnosed school-age children exhibited lower gamma power and phase synchronization to the second of two fast-rate complex tones than their typically developing peers. The goal of the present study was to explore whether the atypical GBRs to rapid acoustic signals in LLI change after an intervention protocol tapping into RAP skills. Because we were interested in sequence processing, crucial for language decoding, we used a paradigm presenting stimuli in rapidly sequential pairs, focusing our analysis on the second tone of the pair. Brain responses to the second stimulus of a doublet are often considered a reflection of temporally extended effects exerted by the first stimulus. Thus stimulus-pair relations are frequently examined in studies of sensory gating (Müller, Keil, Kissler, & Gruber, 2001), or rapid serial presentation (Keil & Heim, 2009). In the present study, we hypothesized that training with FFW under the guidance of a certified provider is accompanied by relative enhancement of GBR amplitude and phase-locking evoked by the second tone in the pair. Consistent with the perspective that RAP skills contribute to successful language acquisition, and discrepancies in RAP have been linked to LLI (Heim & Benasich, 2006; Tallal & Gaab, 2006), improvements in standardized measures of oral and written language were predicted as well. Little or no variation across a time interval comparable to FFW implementation was expected to occur in the non-treatment group of children with typical language development (TLD). Although the present study design does not permit drawing conclusions in terms of causal contributions of a specific treatment, adding this group allowed us to evaluate effects not related to the intervention, such as short-term maturational/developmental changes or the consequences of retesting on oscillatory brain activity and behavioral performance.
1. Methods
1.1 Study participants
Children who were tested in our previous study, exploring early auditory oscillatory responses to fast-rate stimulus sequences (Heim et al., 2011), were invited to participate in the current research. The LLI group (n = 29) had the opportunity to receive FFW intervention, which was followed upon completion by a second assessment period at the laboratory. Four children and their parents decided not to attend the program, three discontinued FFW, and one child did not complete post-testing. Of the 18 children with TLD, six were not available for further behavioral and EEG assessment. Accordingly, a total of 33 children with English as the primary language constituted the present study sample. During the children’s first visit to the laboratory, they were 6 to 9 years old with an average age of 8.11 years. Twelve participants (6 girls) with TLD comprised the control group and 21 participants (6 girls), formally diagnosed as language impaired, the LLI group. The LLI children were ascertained from private speech and language services in the metropolitan New York area and throughout New Jersey. Participants had to meet the following LLI criteria:
-
Language skills assessment based on administered standardized measures: (a) Overall standard Core Language score or at least two overall standard language Index scores (Receptive Language, Expressive Language, Language Content, Language Structure) of the Clinical Evaluation of Language Fundamentals – Fourth Edition (CELF-4; Semel, Wiig, & Secord, 2003) less than or equal to 85 (≥ 1 standard deviation [SD] below the mean of 100); or (b) At least three standard subtest scores of the CELF-4 less than or equal to 8 (≤ 25th percentile) with a history of language therapy or intervention within the last six months; or (c) Criteria #b plus standard reading scores of three Woodcock Reading Mastery Tests – Revised (WRMT-R; Woodcock, 1987), namely Word Identification, Word Attack, and Passage Comprehension less than or equal to 85.
Criteria #1b and #1c allowed children into the study having significant disparities in various language functions, with very low performance in some skills and average performance in others. Using overall language scores (CELF-4 Core or Index scores) alone would obscure such weaknesses because multiple subtests are used to generate composite scores and can “average out” to a standard score in the normal range.
Nonverbal intelligence score as indicated by the performance IQ of the Wechsler Abbreviated Scale of Intelligence (WASI; The Psychological Corporation, 1999) of at least 85.
Absence of hearing impairment, neurological disease, pervasive developmental disorder, dyspraxia, and psychiatric condition as determined by parental report.
Control participants with TLD were matched by chronological age (Table 1) and fulfilled Criteria #2 and #3. Oral language skills had to fall within the normal range (standard score > 85) as assessed by the CELF-4. In addition, the children must have had unremarkable pre- and perinatal circumstances, been born full-term and of normal birth weight, and have no known family history of LLI.
Table 1.
Basic demographic characteristics by participant group (typical language developers, TLD versus language-learning impaired, LLI) during children’s first visit to the laboratory.
| TLD (n = 12) | LLI (n = 21) | t-value | p-value | |
|---|---|---|---|---|
| Age (years) | 8.24 (0.92) | 8.04 (0.95) | 0.58 | < .569 |
| Birth Weight (grams)a | 3364.25 (608.23) | 3458.05 (832.65) | −0.34 | < .738 |
| Gestational Age (weeks)a | 39.83 (0.58) | 39.15 (3.13) | 0.74 | < .464 |
| Familial SESb | 57.88 (6.66) | 52.43 (9.42) | 1.76 | < .088 |
| Maternal Age (years) | 39.92 (3.55) | 42.19 (3.56) | −1.77 | < .088 |
| Maternal Education Levelc | 6.25 (0.62) | 5.90 (0.83) | 1.25 | < .221 |
Note. Means (standard deviations) are shown; all p-values are 2-tailed and non-significant.
Information unknown in one LLI participant.
Familial socioeconomic status (SES) is based on the Hollingshead Four Factor Index of Social Status (Hollingshead, 1975). A mean score of 57.88 falls within the social stratum of major professional (55–66), while 52.43 corresponds to the minor professional category (40–54).
Maternal education level ranging from 1 to 7 according to the Hollingshead criteria. A value of 5 represents partial college, while 6 indicates college/university graduation.
The TLD participants were recruited through local New Jersey schools. Children and siblings of children involved in a prospective longitudinal study at the Infancy Studies Laboratory at Rutgers University were invited to participate as well; these children were originally ascertained from pediatric practices in Northern New Jersey.
Basic demographic information is listed in Table 1, indicating that the LLI and TLD group did not significantly differ in terms of birth weight, gestational age, socioeconomic status, maternal age, and maternal education level. While all of the TLD participants reported right-hand dominance, there were two left-handed children and one ambidextrous child in the LLI group. Since handedness might have an influence on the interhemispheric configuration of the oscillatory brain response, the statistical analyses presented below were also carried out with a subsample that only included right-handed individuals. The observed effects in the Results section were replicated, which prompted us to retain the non-right-handed LLI children in the study sample.
Table 2 shows that both groups satisfied inclusion criteria related to language and cognitive status. Consistent with their difficulties, LLI children had, on average, significantly lower scores in oral language (CELF-4) and reading (WRMT-R) measures than TLD children. All participants performed in the average or above-average age range on the WASI Performance scale, with no significant group differences in nonverbal intellectual functioning. Paired samples t-tests between CELF-4 (Core, Receptive, and Expressive) and WASI Performance IQ variables revealed that the LLI children had lower language scores than would be expected given their nonverbal cognitive ability, ts (20) = −5.84 to −6.26, ps < .001, which is a diagnostic feature of SLI (Bishop, 1997; American Psychiatric Association, 2000). As expected, this was not true for the TLD group, ts (11) = 0.53 to 0.63, ps < .541 to .607.
Table 2.
Standardized language and cognitive scores by participant group (typical language developers, TLD versus language-learning impaired, LLI) during children’s first visit to the laboratory.
| TLD (n = 12) | LLI (n = 21) | t-value | p-value | |
|---|---|---|---|---|
| CELF-4 | ||||
| Core Language | 111.25 (12.87) | 79.95 (12.97) | 6.69 | < .001 |
| Receptive Language | 111.33 (11.97) | 82.33 (10.51) | 7.25 | < .001 |
| Expressive Language | 111.25 (11.16) | 80.95 (13.50) | 6.58 | < .001 |
| WRMT-R | ||||
| Word Identification | 109.17 (17.99) | 90.19 (12.77) | 3.54 | < .01 |
| Word Attack | 104.75 (18.35) | 87.86 (16.35) | 2.73 | < .05 |
| Passage Comprehension | 107.58 (12.67) | 85.24 (12.47) | 4.92 | < .001 |
| WASI Performance IQa | 108.67 (13.16) | 101.48 (13.50) | 1.49 | < .148 |
Note. Means (standard deviations) are shown; all p-values are 2-tailed and all but the p-value for WASI Performance IQ are significant.
Abbreviations. CELF-4 = Clinical Evaluation of Language Fundamentals – Fourth Edition; WRMT-R = Woodcock Reading Mastery Tests – Revised; WASI = Wechsler Abbreviated Scale of Intelligence.
In two TLD children the Abstract Visual Reasoning cluster of The Stanford-Binet Intelligence Scale, fourth edition (Thorndike, Hagen, & Sattler, 1986) was used as a WASI Performance IQ equivalent.
1.2 Study protocol
The study protocol was approved by the Institutional Review Board of Rutgers University. Written informed consent was obtained from the parents of the child participants; children provided verbal assent. Each participant underwent the behavioral assessment battery as detailed in Section 1.1 as well as electrophysiological testing spread across two days during his/her first visit period at the Rutgers’ Infancy Studies Laboratory. Subsequently, the LLI group participated in the FFW training program, which was provided off-site. One to four weeks after completing FFW, children returned to the laboratory for post-intervention behavioral and electrophysiological sessions (visit 2). Again the sessions took place on two separate days and were identical to the visit-1 testing except that the WASI performance IQ was not reassessed. This decision was based on the finding that practice effects on the performance subtests are greater than on the verbal scale and may decrease only significantly after a 1- to 2-year interval (Matarazzo, 1972; Matarazzo, Carmody, & Jacobs, 1980). For one child in the LLI group, the WRMT-R subtest Passage Comprehension was not administered at the second visit. The average number of days between the LLI children’s first and second visits were 116 days (SD = 45) for the behavioral and 102 days (SD = 42) for the electrophysiological assessment.
The TLD group was also tested twice, but did not participate in any intervention program in the interim. On average 92 (SD = 37) and 95 (SD = 53) days for the behavioral and electrophysiological parts elapsed. Non-paired t-tests revealed no significant differences in the visit 1 to visit 2 intervals between the two groups of children, ts (31) = −1.60 and −0.40, ps < .120 and .691 for the behavioral and electrophysiological session, respectively. Thus, the TLD children served as a control for changes on the behavioral and neuronal level related to factors other than the training regimen, such as repeated assessment (e.g., familiarization with the testing environment, practice effects) as well as short-term developmental and maturational effects.
1.2.1 Computerized audio-visual training
The FFW intervention program applied here focuses on auditory rate processing underlying language abilities, but also trains sequencing skills and aspects of attention and working memory (Tallal, 2004). The software comes in seven visually appealing exercises and includes acoustic events that range from frequency sweeps, to phonemes, to words, up to the sentence level: The objective of Circus Sequence is to indicate the temporal order of two frequency-modulated tones (upward or downward gliding in frequency) at a specified interstimulus interval (ISI). Children are asked to duplicate the sequence of the two sweeps (up-up, up-down, down-up, down-down) by mouse clicking on the element on the computer screen. Old MacDonald’s Flying Farm involves detecting individual phoneme changes in repeated consonant-vowel syllables (e.g., /do/…/do/…/to/). In this exercise, the child is invited to capture a flying animal by using the computer mouse, clicking and holding the button down until he or she hears a sound change, and then releasing the button and thus the animal. The objective of Phoneme Identification is to identify a target phoneme in one of two contrasting consonant-vowel or vowel-consonant-vowel combinations (such as /bi/-/di/ or /aba/-ada/, respectively). After the child has listened to a target sound, he or she hears two sounds produced sequentially by two characters, and indicates via mouse click which character uttered the target. Phonic Match requires matching syllable pairs in simple words (e.g., /pack/-/pat/). When a tile in a grid is clicked, the child hears a word and has to find the second tile that hides the same sound. Phonic Words involves discrimination between words that differ only by an initial or a final consonant sound (such as /bee/-/knee/ or /run/-/rung/, respectively). The child listens to a word introduced by the prompt “point to” and then clicks on the correct representational image of the word, choosing from the picture pair (e.g., bee vs. knee) presented. Block Commander focuses on following commands of increasing length and grammatical complexity (e.g., “Touch the green square!” or “After touching the yellow square, touch the blue circle!”). Children perform their answers via the computer mouse on a board game shown on the screen. Finally, Language Comprehension Builder aims at training each rule of English grammar, such as negation (e.g., “The baby is not crying.”) or clefting (e.g., “It’s the girl that the boy pulls.”). The child is asked to click on the picture that matches the sentence he or she just heard.
All children with LLI received the intervention regimen under the guidance of a certified provider, who was a licensed speech and language pathologist. Children trained either at the FFW provider’s office or at home following the same administration procedure. Each participant was seated in front of a computer screen where the visual stimuli were shown (e.g., a circus or a farm theme), and accompanying tonal and linguistic sounds were delivered via headphones. Early FFW training utilized acoustic events in which rapid transitions were prolonged in time and differentially amplified. As a child progressed through the exercises and performance improved, the modified acoustic stimuli were presented at rates and amplitude levels closer and closer to those that occur in natural speech. Participants responded via mouse clicks at appropriate locations in the visual array. Feedback was provided on a trial-by-trial basis for the delivered responses: Correct responses were rewarded, for instance, in terms of point gains or auditory/visual animations, incorrect clicks were communicated by an extra auditory cue and by indicating the correct answer prior to the next trial. The presentation of trials in each exercise was self-paced based on an individual child’s skill level. The adaptive algorithm of the software ensured that each participant responded correctly approximately 80% of the time. This is an important principle common to many neuroplasticity-based programs, in order to provide a heavy dose of correct trials and positive reinforcement (e.g., Tallal, Merzenich, Miller, & Jenkins, 1998; Wilson et al., 2006).
The FFW administrators monitored children’s training participation and progress daily. On each training day, participants’ performance scores from the exercises were uploaded over the Internet to Scientific Learning Corporation and then returned to the provider as a detailed progress report. Completion of the program was confirmed for each student by the provider and the company’s final level report. The LLI group trained about 100 min daily, 5 times a week for an average of 32 days (SD = 12).
1.2.2 Electrophysiological assessment
The data were originally collected in the context of a larger, wide-ranging longitudinal project using an oddball paradigm (see below) to monitor the development of auditory event-related potentials (ERPs), including the classical mismatch response. Although analysis of gamma-band information was not the primary, a priori purpose of this project, spectral power analysis was always planned as one of the data techniques to be used. A paper dealing with intervention effects on the ERP components in the same sample of children is currently being prepared for submission.
In the electrophysiological visit 1 and visit 2 sessions, the two groups of children were exposed to complex tones, having a fundamental frequency of 100 or 300 Hz with 15 harmonics (6 dB roll-off per octave). Each tone was 70 ms in duration (rise and fall times of 5 ms). The tones were presented in pairs with varying ISIs of 300, 70, or 10 ms using a block design. Due to the length of the sessions, participants received only two of the three ISI blocks at each visit: either 300 and 70 ms blocks or 70 and 10 ms blocks. Thus, all children were exposed to the 70-ms ISI tone doublets across visits. In this study, we exclusively considered the 70-ms ISI pairs for two reasons: First, this choice has the advantage of high statistical power and greater signal-to-noise ratio, as compared to the blocks containing other ISIs, which had smaller sample sizes. Second, to assess oscillatory activity in sensory cortex, we used Morlet wavelets (see Section 1.2.3), which cannot resolve the responses to paired tones when they are separated by only 10 ms. As compared to the 70-ms ISI condition, the 300-ms presentation rate was also problematic as this ISI leads to longer analytic epochs, which may be differentially affected by slow shifts in the oscillatory activity between the two stimuli. Consequently, comparisons across different ISIs and thus segments with different lengths are invalid. Statistical tests contrasting the two ISI groups (70 and 10 ms; 70 and 300 ms) showed no effect of ISI combination with respect to examining spectral power and PLI, thus these groups were combined.
The 70-ms ISI also falls within the “tens of milliseconds range” (Tallal, Miller, & Fitch, 1993) that is critical for discrimination of rapid formant transitions (maximum ca. 80 ms) and voice-onset times (discrimination range ca. 25–70 ms, phonetic boundary ca. 30 ms) inherent to stop consonants (Borden & Harris, 1980; Kewley-Port, 1982; Phillips, 1999). In their seminal work, Tallal and Piercy (1973a, 1973b, 1974b, 1975) found that LLI children displayed low temporal sensitivity to both nonverbal and verbal acoustic changes, presented in the tens of milliseconds range. Specifically, these children required a gap of ≥ 305 ms in order to accurately sequence two successive 75-ms tones, and were able to discriminate the stop-consonant syllables /ba/ and /da/ when the formant transitions were synthetically extended to 95 ms, but not at 43 ms, i.e., near the natural speed of speech. Further, a series of studies examining RAP skills in infants suggests that the ability to resolve a 70-ms ISI predicts language outcome at later ages regardless of family history for LLI (e.g., Benasich & Tallal, 2002; Benasich, Thomas, Choudhury, & Leppänen, 2002; Benasich et al., 2006; Choudhury & Benasich, 2011).
Tone pairs were delivered with an intensity of 75 dB free field via speakers to the left and right of the child. Each ISI block comprised 833 tone pairs (tone pairs = trials), which occurred in a typical oddball paradigm. The standard tone doublet was 100–100 Hz (low-low), and the deviant a low-high pair (100–300 Hz). The deviant doublet was presented with 20% probability (166 trials) among the repetitive standard stimuli; a pseudo-random mode ensured that at least 3 and no more than 10 standards occurred between each deviant. The intertrial interval (onset to onset) was fixed at 700 ms. Four regularly placed pauses within a block allowed participants to take a short break. There were also brief pauses between ISI blocks, which typically lasted about 30 seconds.
Children were seated in a comfortable chair and listened to the tone doublets under two conditions: passive and active. The two different conditions allowed us to assess the consistency of the early evoked GBR across time and under different instructions across visits. In the passive condition, participants watched a silent video and were asked to ignore the sounds. During the pauses, the experimenter spoke to the children (to ask about fatigue, comfort, etc.) and posed questions about the movie to ensure they were attending to it. Each child was motivated to respond correctly in order to earn stickers (placed on a cut-out shape) needed to “buy” a prize at the end of the session (all participants received a prize at the end of each visit’s session regardless of the number of stickers they earned).
In the active condition, participants were invited to press a button on a response pad with the index finger of their preferred hand as quickly as possible when they heard the deviant (target) tone pair. A total of 33 practice trials ensured that each child understood the task correctly. Feedback was only provided at this time. While the passive condition always preceded the active condition, ISI block presentation order was counterbalanced among participants. Including both conditions allowed us to consider the reliability of sensory effects irrespective of instruction, at a higher signal-to-noise ratio, based on a greater number of trials.
During both conditions, the EEG was recorded from 64 sensors using an Electrical Geodesics ™ (EGI; Eugene, OR, USA) system with a sampling frequency of 250 Hz referenced to the vertex (recording site Cz). Impedances were maintained below 50 kΩ, as recommended for the EGI high input-impedance amplifiers. Horizontal and vertical electro-oculogram (EOG) was determined from electrodes above, below, and lateral to the eyes. All channels were pre-processed online by means of 0.1 Hz high-pass and 100 Hz low-pass filtering.
Channels with poor signal quality throughout the entire recording session (a maximum of 6 channels, 2.1 on average) were interpolated offline, using a spline interpolation method (Perrin, Pernier, Bertrand, & Echallier, 1989). Correction for ocular artifacts was performed on the raw data by applying the algorithm implemented in commercial BESA software (Version 5.1; Berg & Scherg, 1994). For both conditions, stimulus-locked epochs were then extracted from 400 ms prior to the onset of the first tone of a doublet until 800 ms after the onset of the first tone. Single trial epochs were inspected for artifact contamination using the interactive artifact module of BESA. This tool defines individual rejection criteria based on the distribution of epochs in terms of mean amplitude and gradient (first temporal derivate) values. For artifact rejection and all subsequent analyses, data were arithmetically re-referenced to average reference. Epochs that were contaminated with artifacts after eye correction were rejected, a total of 24% at visit 1 and 27% at visit 2 for standard stimuli. Thus, a mean of 531 trials were retained across visits in TLD children, with slightly fewer trials retained in the LLI group (mean = 522 trials). This difference was not significant when compared in a non-paired t-test, t (31) = −0.54, p < .587. The deviant’s probability of occurrence resulted in reduced signal-to-noise ratio, as compared to the number of standard trials. Since the present study focused on early mandatory auditory processing, we included only the standard tone pairs in all analyses presented below. Artifact-free epochs were then submitted to the source estimation and spectral analysis steps described in what follows.
1.2.3 Data analysis: oscillatory brain activity
To assess early oscillatory activity in sensory cortex, we projected the EEG segments to twelve discrete regional sources placed at fixed positions in a 4-shell ellipsoidal head model using BESA (Scherg & Von Cramon, 1986). Sources were not fitted to the data, and were not intended for iterative source localization but were pre-set based on their neurophysiological plausibility and regional sensitivity (see below). Thus, the array of sources was used as a spatial filter, for projection and reduction of the multidimensional data set. If properly applied, activity changes at regional dipoles are more easily interpreted in terms of neurophysiology (Scherg, Ille, Bornfleth, & Berg, 2002). By contrast, in voltage power maps, the fact that phase information is not shown poses problems in interpretation (e.g., dipolar voltage fields are no longer represented with opposite polarity; see Hauk, Keil, Elbert, & Müller, 2002). Regional sources in BESA are sensitive to current changes irrespective of their orientation in space, and therefore capture electrocortical activity originating from a wider range of areas. This is achieved by representing three orthogonal orientations, the magnitude (modulus) of which constitutes the source strength at a given location (Sabatinelli, Lang, Keil, & Bradley, 2007). When adopting this technique, it is important to ensure that activity is not misrepresented in another cortical area, far from the true underlying source. Here, we used source sensitivity maps to allow our source model as a whole to provide spatial specificity, such that the modeled sources were primarily sensitive to local activity. This is accomplished by using a sufficient number of model sources, evenly distributed across the cortex. If source sensitivity maps for all distributed source locations demonstrate local sensitivity and cover cortex evenly with little overlap, then the model can be used as a valid and reliable spatial filter (Sabatinelli et al., 2007).
Our model included (i) two lateral sources at locations corresponding to the left and right Heschl’s gyrus, thus capturing auditory cortex (i.e., the sources of interest), and (ii) 10 bilateral sources in left and right occipital, inferior temporal, parietal, central, and frontal areas (i.e., the control sources), for a total of 12 regional sources. A similar regional dipole model was validated against functional magnetic resonance imaging data in the visual domain in a previous study (Sabatinelli et al., 2007). Locations were selected to be spatially equidistant and to minimize the overlap of the sensitivity of the sources to currents from distant regions, using sensitivity maps in BESA. The model was applied to each participant’s artifact-free EEG segments, resulting in a time course of source strength at each regional source, for three orthogonal orientations of the source. In a first interactive step, it was ensured that the two sources in auditory cortex capture energy in the 50–100 ms segment after the onset of each standard pair, and that the control sources in non-auditory regions did not. This step also amplifies the contribution of local early sensory cortical activity to the dependent variable. Source configurations of all participants included in the final sample met the criterion. Then, we exported the single-trial source-projected data representing bi-lateral auditory cortex activity, discarding the activity at the control loci. The three source orientations at each of the two auditory cortex locations were kept separately and submitted to wavelet analysis.
Time-frequency representations of the signal were established using convolution of the signal with complex Morlet wavelets as described in detail elsewhere (Tallon-Baudry, Bertrand, Peronnet, & Pernier, 1998; Tallon-Baudry & Bertrand, 1999). Morlet wavelets were employed in previous research of auditory GBRs (Knief et al., 2000) and thus facilitate cross-study comparisons. In our study, complex Morlet wavelets were generated in the time domain for different analysis frequencies f0, ranging from 20 to 80 Hz in steps of 0.833 Hz. This range of frequencies allows showing the extent to which any observed effects are specific to oscillations in a given frequency band, or are reflective of transient events or artifacts (Yuval-Greenberg, Tomer, Keren, Nelken, & Deouell, 2008), affecting the spectrum on a wide scale from lowest to highest frequencies equally. The parameter σf specifies the width of the wavelet in the frequency domain, and varies with the analysis frequency f0 and the user-selected ratio m, with m = f0/σf = 7. Time and frequency resolution for oscillations below 20 Hz is sub-optimum with the wavelet family employed here (Kronland-Martinet, Morlet, & Grossmann, 1987), and thus these frequencies are not reported in the current study. Wavelets were then applied to the source-space projected signal at two auditory locations (left and right Heschl’s gyrus) with three time series each, representing orthogonal source orientations. For each artifact-free epoch, time-varying energy in a given frequency band was obtained as the squared absolute value of the convolution of the cosine-square-tapered source signal with the wavelet. This was done separately for the three orientations of the regional source at each of the two locations. Single trial time-by-frequency matrices were averaged in order to obtain the evolutionary spectrum for each source location, orientation, and experimental condition. After averaging, the model source orientations at each source location were combined as the Euclidean distance. An epoch from 280 to 100 ms prior to stimulus onset was used as an estimate of general noise. The time-by-frequency matrices for each frequency and time point for each source location were divided by the mean of this baseline segment, respectively.
In addition to time-varying spectral amplitude, we also analyzed the intertrial phase-locking of the neural oscillations measured with the wavelet family. To this end, the normalized, complex representations of the time-frequency matrices were averaged according to the algorithm described e.g., in Tallon-Baudry and Bertrand (1999). This procedure results in a measure of phase stability across trials, for each time point and frequency, referred to as the phase-locking index (PLI; Keil et al., 2007, for an application in conjunction with source estimation). The PLI is bound between 0 and 1; 0 indicating random distribution of phase across trials and 1 indicating perfect identity of the phase across trials, at a given time and frequency.
For both time-varying amplitude changes and time-varying PLI, we extracted the mean of a time-frequency window representing early (45–75 ms) oscillations in the lower gamma-band range (29.167–51.667 Hz), for the left and right regional source locations. This range was chosen to account for the inter-individual variability of the peak GBR that was located between 30 and 50 Hz across participants, which is consistent with previous reports of this brain response (Pantev, 1995).
1.3 Statistical analyses
To examine the extent to which FFW intervention is related to changes in early oscillatory brain activity, amplitude and PLI values for the standard tone doublet were entered into mixed-model Analyses of Variance (ANOVAs); Group (2; LLI, TLD) constituted the between-subjects factor and Visit (2; 1, 2), Tone (2; first, second), Condition (2; passive, active), and Hemisphere (2; left, right) the within-subjects factors. Contrast analyses were used to follow up significant third and higher-order interaction effects.
Changes in language and reading measures from visit 1 to visit 2 for the LLI (FFW training) and TLD (no training) children were analyzed, using a set of 2(Group) × 2(Visit) mixed factors ANOVAs. Outcome variables included CELF-4 Core Language standard score, CELF-4 Receptive Language standard score, CELF-4 Expressive Language standard score, WRMT-R Word Identification standard score, WRMT-R Word Attack standard score, and WRMT-R Passage Comprehension standard score. If main effects of Group and Visit without a significant interaction of these factors were identified, paired samples t-tests were planned to further investigate the changes in language and reading performance from visit 1 to visit 2 in each group of children. For all ANOVAs run on behavioral as well as electrophysiological data, we report partial eta-squared (η2 P) values as a measure of effect size (Cohen, 1988).
One overarching hypothesis of the present study assumes that improved temporal accuracy in auditory sensory processing should be associated with enhanced language function (Tallal & Gaab, 2006). PLIs for the sensory evoked GBR measure the amount of reproducibility of the exact spatio-temporal dynamics across trials. Accordingly, we used this parameter of sensory temporal accuracy to predict changes in performance on the different language tests. Change quotients were calculated instead of difference scores as they are independent of a participant’s initial status (O’Connor, 1972). For the three CELF-4 and WRMT-R measures, respectively, as well as the PLI values associated with each tone, averaged across conditions and hemispheres, we calculated ratios by expressing the second visit in terms of the first: A PLI change quotient for the first tone was obtained by calculating (PLI of First Tone Visit 2)/(PLI of First Tone Visit 1); PLI change quotient for the second tone was obtained by calculating (PLI of Second Tone Visit 2)/(PLI of Second Tone Visit 1). The same logic was applied to CELF-4 and WRMT-R standard scores. Importantly, because we were interested in capturing the relationship between the change in sensory gamma synchrony and changes in language performance in general, we included the entire sample, LLI children as well as TLD controls. Accordingly, two multiple regression models were calculated: one including the change quotients of the CELF-4 standard scores (Core, Receptive, and Expressive Language), and the other the change quotients of the WRMT-R standard scores (Word Identification, Word Attack, and Passage Comprehension) as a set of dependent variables. In both cases, the PLI change quotients of the first and second tone, respectively, served as regressors. Significant results on the overall regression model were followed up with simple regression testing, involving one dependent and one predictor variable each. All regression analyses were presented with corrected R2 as an effect size index.
Because no irrelevant variables were included in the present analyses, we refrained from Bonferroni correction for multiple post-hoc comparisons (Nakagawa, 2004). This approach was intended to result in a compromise between maintaining statistical power and avoiding the risk of Type II error inflation. For all analyses, effects were deemed significant when p < .05.
2. Results
The goal of this study was to investigate the extent to which early oscillatory responses in auditory cortex change after FFW training, designed to enhance the temporal precision of auditory and linguistic encoding. Theoretically, alterations in neural sensory integration should be accompanied by improvements in ecologically valid behavioral measures, such as standardized tests of oral and written language.
2.1 Oscillatory brain responses
In both groups of children, the standard tone pair elicited a reliable evoked oscillatory response occurring in the time segment between 45 and 75 ms and in a frequency band ranging from 29 to 52 Hz. This early activity in the auditory cortex is illustrated in the time-frequency representation of amplitude averaged across hemispheres and conditions (passive, active) at the two assessment times (Figure 1). When examining the time by frequency representation of intertrial phase-locking at each visit (Figure 2), two instances of heightened phase-locking coincided in time with the evoked gamma amplitude modulations in both the LLI and TLD children. This further supports the premise that the early responses under consideration are indeed the result of phase alignment across trials.
Figure 1.

Grand mean baseline-corrected time by frequency plots at visit 1 (left) and visit 2 (right) for the two groups in the study, 12 children with typical language development (TLD; top), and 21 language-learning impaired children (LLI; bottom). Values are averaged across conditions and hemispheres and were obtained by wavelet analyses of the single-trial source waveforms at two regional sources, one in each temporal lobe. The plots show time running from left to right, frequency from bottom to top. The amount of spectral amplitude change at a given time and frequency is coded by color, with increase over the baseline level coded in increasingly warm (red) colors. A pre-stimulus segment was used as the baseline, and amplitude values indicate relative change after dividing the baseline mean (change/baseline). Note the two oscillatory responses to the tone doublet, each with an onset latency of approximately 45 ms, with respect to the onset of each tone in the pair. The white rectangles in the plots highlight the time-frequency window used to extract the mean of early oscillations (45–75 ms post-tone onset) in the lower gamma-band range (29–52 Hz) for statistical analyses.
Figure 2.

Grand mean time by frequency representation of the phase-locking index (PLI) for 12 children with typical language development (TLD; top), and 21 language-learning impaired children (LLI; bottom) at visit 1 (left) and visit 2 (right). Values are averaged across conditions and hemispheres. Phase-locking indices reflect the amount of phase stability across trials for a given time and frequency. The plots show time running from left to right, frequency from bottom to top. The amount of spectral phase-locking across trials is coded by color, with greater numbers indicating greater phase-locking. Note the two instances of heightened phase-locking, each with an onset latency of about 45 ms, with respect to the onset of each tone in the doublet. The white rectangles in the plots characterize the time-frequency window used to extract the mean of early oscillations (45–75 ms post-tone onset) in the lower gamma-band range (29–52 Hz) for statistical analyses.
As revealed by mixed-factors ANOVA, mean gamma amplitudes were overall higher in TLD than LLI children, F (1, 31) = 7.60, p < .01, η2 P = .20, more pronounced at visit 2 than visit 1, F (1, 31) = 22.78, p < .001, η2 P = .42, and reduced when evoked by the second, compared to the first tone in the doublet, F (1, 31) = 41.17, p < .001, η2 P = .57. The main effects of factors Group, Visit, and Tone, respectively were modulated by three significant two-way interactions: (1) Visit x Tone, F (1, 31) = 37.49, p < .001, η2 P = .55, indicating that the response increase from visit 1 to visit 2 is exclusively evident for the second tone, while the first-tone amplitude showed a small decline; (2) Visit x Group, F (1, 31) = 7.09, p < .05, η2 P = .19, resulting from a striking enhancement across assessment times in the LLI group and little or no amplitude changes in TLD children; and (3) Tone x Group, F (1, 31) = 4.44, p < .05, η2 P = .13, revealing that the attenuated response to the second tone occurred to a greater extent in participants with LLI. As illustrated in Figure 3, the two-way interactions were subordinate to a significant Visit by Tone by Group interaction, F (1, 31) = 7.08, p < .05, η2 P = .19. Focused contrasts indicated that the oscillatory activity evoked by the second tone was significantly smaller in LLI than TLD students at visit 1, F (1, 31) = 43.08, p < .001. This was no longer true at visit 2, where both groups showed equally strong responses to each sound in the doublet.
Figure 3.

Amplitude change of the early gamma response across stimulus positions in the tone doublet (first, second) for the two groups of children at visits 1 and 2. Values represent means of 12 children with typical language development (TLD; open circles) and 21 language-learning impaired children (LLI; filled circles). Vertical bars indicate standard errors of mean. At visit 1, the gamma amplitude for the second tone of the doublet was attenuated, specifically in the LLI group. At visit 2, responses to both tones in a pair were similarly prominent in both groups of children.
ANOVA results of the phase stability of early gamma oscillations across trials (i.e., PLI) paralleled in several instances the effects on the amplitude measure, but also differed in terms of interaction patterns. Consistent with the response magnitude, mean PLI was generally stronger in TLD than LLI participants, F (1, 31) = 13.53, p < .001, η2 P = .30, more prominent at visit 2 than visit 1, F (1, 31) = 269.56, p < .001, η2 P = .90, and attenuated for the second, compared to the first of the two tones, F (1, 31) = 42.08, p < .001, η2 P = .58. These main effects were influenced by three significant two-way interactions: (1) Visit x Tone, F (1, 31) = 6.28, p < .05, η2 P = .17, pointing to a larger PLI gain across assessment times for the first than the second tone; (2) Visit x Group, F (1, 31) = 63.44, p < .001, η2 P = .67, showing that the PLI increase was more prominent in children with LLI than TLD; and (3) Tone x Group, F (1, 31) = 31.83, p < .001, η2 P = .51, being reflective of reduced phase stability to the second stimulus in LLI children only. These results were in turn subordinate to a significant Visit by Tone by Group interaction, F (1, 31) = 19.66, p < .001, η2 P = .39 (Figure 4). Although children with LLI demonstrated overall gains in phase stability from assessment time 1 to 2, contrast analyses revealed a similar PLI pattern across times, with lower values for the second than the first tone, Fs (1, 31) = 99.89 and 85.28, ps < .001 for visit 1 and 2, respectively. Both at visit 1, F (1, 31) = 91.31, p < .001, and at visit 2, F (1, 31) = 20.00, p < .001, the LLI group’s PLIs were systematically below the ones from the TLD group, but only for the second stimulus of the tone pair.
Figure 4.

Phase-locking index of early gamma activity across stimulus positions in the tone pair (first, second) for the two experimental groups at visits 1 and 2. Mean values of 12 children with typical language development (TLD; open circles) and 21 language-learning impaired children (LLI; filled circles) are depicted. Vertical bars represent standard errors of mean. Children with LLI showed overall gains in phase stability from visit 1 to visit 2. Across visits, however, the LLI group exhibited reduced PLI values for the second stimulus of the tone pair, compared to the TLD group.
Mixed-model ANOVAs were also conducted on the oscillatory activity at the level of scalp electrodes, focusing on a sensor cluster around the vertex (electrode sites Cz, FCz, and their five nearest neighbors), where early auditory signals typically project. The scalp data replicated the general pattern of effects obtained for the two dependent variables, gamma amplitude and PLI, with bilateral regional sources (Figure 5). Specifically, all of the reported interactions involving the factor Group (Visit x Group, Tone x Group, and Visit x Tone x Group) reached statistical significance in the sensor space as well. The minimum and maximum F (1, 31) values for these interactions were 9.11 (p < .01, η2 P = .23) and 13.49 (p < .001, η2 P = .30) for gamma amplitude, and 4.36 (p < .05, η2 P = .12) and 33.30 (p < .001, η2 P = .52) for PLI. As for the source space data, this pattern of findings did not change when controlling for handedness (see section 1.1). Furthermore, testing the influence of ISI combinations (participants exposed to 300 and 70 ms ISIs versus participants who listened to 70 and 10 ms ISIs) did not yield significant results (see section 1.2.2).
Figure 5.

Time-frequency representations of the amplitude (top) and phase-locking index (PLI; bottom) at an electrode cluster around the vertex, spanning Cz, FCz, and their 5 nearest neighbors, averaged across conditions and visits for the whole sample of children (n = 33). The plots show time running from left to right, frequency from bottom to top. Amounts of spectral amplitude change at a given time, and phase-locking across trials are coded by color. Increasingly warm (red) colors reflect amplitude rise over baseline level and enhancement of phase stability, respectively. Note the two oscillatory responses (top) accompanied by two instances of heightened phase-locking (bottom), each with an onset latency of approximately 45 ms with respect to the onset of each stimulus in the tone doublet.
2.2 Language and reading outcome
Language scores from visits 1 and 2 for the TLD and LLI groups are pictured in Figure 6. For all CELF-4 measures examined, the 2 × 2 ANOVAs yielded significant main effects of factors Group [Core, F (1, 31) = 40.89, p < .001, η2 P = .57; Receptive, F (1, 31) = 36.06, p < .001, η2 P = .54; Expressive, F (1, 31) = 41.88, p < .001, η2 P = .57] and Visit [Core, F (1, 31) = 27.87, p < .001, η2 P = .47; Receptive, F (1, 31) = 15.05, p < .001, η2 P = .33; Expressive, F (1, 31) = 16.86, p < .001, η2 P = .35]. CELF-4 scores were overall higher in TLD than LLI children and generally higher at visit 2 than visit 1. The main effects were affected by a significant Group by Visit interaction, for both the Core Language composite, F (1, 31) = 12.02, p < .01, η2 P = .28, and the Receptive Language index, F (1, 31) = 9.60, p < .01, η2 P = .24. This indicates considerable gains in standard Core and Receptive Language scores for the LLI group, and little to no changes in the TLD group. In terms of the Expressive Language index, the two-way interaction failed to reach significance, F (1, 31) = 3.71, p < .064, η2 P = .11. To explore whether there is a differential change from the first to the second visit as a function of treatment, paired t-tests were performed within each group. While no significant change was found in the TLD children’s expressive language scores from the first to the second visit, t (11) = −1.91, p < .083, the LLI group significantly improved CELF-4 performance in the expressive domain, t (20) = −4.44, p < .001.
Figure 6.

CELF-4 standard scores (Core Language composite, Receptive Language index, Expressive Language index) at visit 1 (dark gray bars) and visit 2 (light gray bars) are shown for 12 children with typical language development (TLD; left) and 21 language-learning impaired children (LLI; right). While there were no significant changes in oral language performance in the TLD group, all CELF-4 scores in the LLI group increased considerably from visit 1 to visit 2 (*).
ANOVAs performed on the WRMT-R reading measures did not reveal significant changes from visit 1 to visit 2 in either group of children. Mean differences in standard scores between the two assessment sessions (Difference = Visit 2 - Visit 1) averaged across the three WRMT-R subtests amounted to 1.14 (standard error of the mean [SEM] = 1.40) and 0.37 (SEM = 0.87) in children with TLD and LLI, respectively. As shown by a significant main effect of Group for all subscales examined, TLD children showed overall superior reading: Word Identification, F (1, 31) = 14.31, p < .001, η2 P = .32; Word Attack, F (1, 31) = 9.65, p < .01, η2 P = .24; Passage Comprehension, F (1, 30) = 23.74, p < .001, η2 P = .44. On average, the TLD group exhibited a reading head start of 18.82 standard score points across visits and the three subscales tested.
2.3 Predicting changes in behavioral performance from changes in oscillatory activity
Critical to the auditory rate processing hypothesis, the ability to process rapidly presented brief sounds should be predictive of changes in language measures. In a final step, PLI change quotients of the first and second tones [(PLI of First Tone Visit 2)/(PLI of First Tone Visit 1); (PLI of Second Tone Visit 2)/(PLI of Second Tone Visit 1)] were treated as predictor variables for the change quotients of the three CELF-4 measures (Visit 2/Visit 1 standard scores for Core, Receptive, and Expressive Language; see Section 1.3), using a multiple regression approach for the whole sample. The overall model showed that the PLI change quotients for the first and second tones significantly predict alterations in parameters of oral language: The coefficients multiple R and corrected R2, respectively, amounted to 0.58 and 0.30, F (2, 30) = 7.79, p < .01, for Core Language; 0.56 and 0.27, F (2, 30) = 6.96, p < .01, for Receptive Language; and 0.53 and 0.24, F (2, 30) = 5.99, p < .01, for Expressive Language.
As detailed by post-hoc simple regression analysis, improvements in receptive language abilities (Figure 7, center graph) were predicted by PLI gains for the second tone, R = 0.52, corrected R2 = 0.25, F (1, 31) = 11.68, p < .01. When removing the outlier (a participant with LLI exhibiting a Receptive Language change quotient of 1.08 and a second-tone related PLI change quotient of 2.64) from the regression analysis, the prediction was enhanced: R = 0.68, corrected R2 = 0.45, F (1, 30) = 26.27, p < .001. Follow-up testing also revealed that improvements in expressive language skills (Figure 7, bottom graph) were determined by PLI increases for the first sound of the doublet, R = 0.53, corrected R2 = 0.26, F (1, 31) = 12.36, p < .01. Changes in the Core Language measure (Figure 7, top graph) mirrored the pattern of the change quotient of the Expressive Language index, being positively linked to PLI alterations for the first tone, R = 0.57, corrected R2 = 0.31, F (1, 31) = 15.30, p < .001. The latter result is reflective of a higher expressive than receptive proportion in the composite score and will be addressed in detail in the Discussion section.
Figure 7.
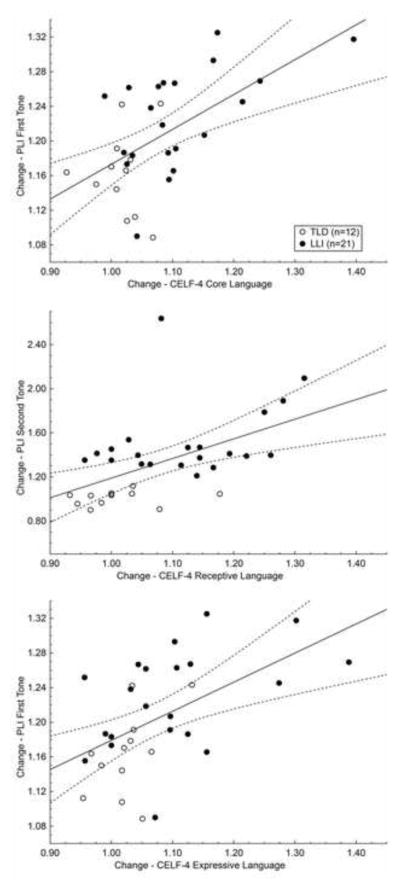
PLI change quotients for the first and second tones are plotted against the change quotients for the standard language scores obtained in the three CELF-4 measures. Change quotients reflect the ratio of visit 2 to visit 1 in each dimension. Although the single regression models are based on the whole study sample (n = 33), values in each graph are depicted according to their group membership: open circles represent 12 children with typical language development (TLD), and filled circles 21 peers with language-learning impairment (LLI). Both improvements in the Core Language composite and the Expressive Language index were predicted by PLI increases for the first sound of the tone pair (top and bottom graph, respectively). In contrast, ameliorations in Receptive Language index were determined by PLI gains for the second tone (center graph).
Regressing the PLI change quotients for the first and second tones onto the change quotients of the three WRMT-R reading measures did not yield significant results. The overall model provided multiple R coefficients between 0.13 and 0.27 and corrected Rs2 centered around zero, Fs (2, 29) = 0.24 to 1.14, ps > .33.
3. Discussion
Early auditory GBRs have been demonstrated to discriminate between groups of children with LLI and children with TLD in a paradigm challenging sensory integration of fast-rate tone sequences (Heim et al., 2011). Neural mass activity and temporal stability in the gamma range was identical across groups for the first tone, but LLI children showed substantially reduced spectral amplitude and phase-locking for the second of two tones. This was taken to indicate that neural masses cannot be engaged in a well-synchronized fashion in LLI, when RAP is needed, making GBRs a potential marker of the rate processing deficits often observed in developmental language disorders (Heim et al., 2011). It has been well-documented that the developing brain possesses a great capacity for neural plasticity (Johnston, 2009) and it has also been recognized that RAP deficits can be ameliorated by training protocols tapping into this potential (Tallal, 2004). Here, the computerized FFW program was administered to a subset of LLI children who had participated in the Heim et al. (2011) study. This program is designed to improve language ability by enhancing underlying RAP skills via active exercises. While monitoring changes in oral and written language performance, we tested the hypothesis that atypical GBRs to rapid acoustic signals in LLI will normalize through appropriate training. Specifically, we expected relative increase of gamma amplitude and phase-locking in response to the second stimulus of a tone doublet. Little or no variation across a comparable time interval was expected to occur in the no-treatment TLD group. Pertinent to the theoretical perspective that enhanced temporal resolution in auditory cortex should be associated with advanced language performance, we used changes in PLI values to predict changes in standardized tests of oral and written language (CELF-4 and WRMT-R measures, respectively). The preference of PLI over amplitude values as an index of neural sensory processing is due to the fact that the former represent a measure of temporal response consistency across the whole set of trials on a standardized scale (values between 0 and 1). The regression analyses were conducted across both groups to quantify any type of relationship between oscillatory activity and performance, including correlations reflecting short-term maturational/developmental factors, or the consequences of extensive exposure to the experimental stimuli during the recording sessions.
Sample size may be regarded as one potential limitation of the present study. This seems especially true for the TLD group, which is compared to a 1.75 times larger group of children with an LLI diagnosis. However, such a pattern is not uncommon in clinical and translational research, where the variability on a given measure tends to be larger in the affected, as compared to the control group. As a consequence, smaller numbers of control individuals are often included in such studies. In addition, the effect sizes in the present ANOVA results suggest enough power to enable a substantive discussion of the data (Cohen, 1988). For instance, 62.5 % of the statistically significant results including the factor Group for the behavioral and source-space related brain parameters exceeded what is often referred to as ‘large’ effect sizes (≥ .25; observed range: .28–.67), and the remaining 37.5 % fell in the ‘moderate’ magnitude range (≈ .09–.24; observed range: .13–.24).
Our results showed that LLI children exhibited gains in all measures of oral language following training. This is consistent with reports of positive outcomes as a consequence of proper FFW implementation (e.g., Krumpe & Harlow, 2008; Stevens, Fanning, Coch, Sanders, & Neville, 2008). Improvements in reading scores previously reported in children with dyslexia (Temple et al., 2003; Gaab et al., 2007), were not observed here. Although the FFW program administered across these studies (viz., Fast ForWord Language®) trains listening skills essential for early reading, it does not directly address the abilities connecting spoken and written language (e.g., decoding, word recognition) as is the case, for instance, with the follow-up version Fast ForWord Language to Reading® (see http://www.scilearn.com/products/). While the dyslexic students in the Temple/Gaab research attended a special school for language and literacy difficulties, and worked on the exercises during session, our LLI group underwent the intervention during summer vacation where no classroom instruction and assignments took place. It is thus conceivable that secondary enhancements in written language are not apparent, because the LLI children did not have sufficient educational instruction necessary to translate their practiced RAP skills into advanced reading.
When discussing benefits of FFW training, it is important to consider that the current design is limited in terms of its sensitivity of specific treatment effects. Because we focused on brain correlates of extensive experience per se, we did not include an alternative treatment group, or a placebo group, necessary to evaluate the specific effect of FFW. Such an analysis is outside the scope of this paper. An extension of the present work, however, might incorporate a group of non-treated LLI children, thus allowing the investigation of developmental and experience-related factors in the affected population. Additional follow-up assessments after the initial intervention would provide information about long-term behavioral and neurophysiological outcomes.
As expected, the LLI group demonstrated evidence of normalized gamma power in response to the second tone of the doublet after FFW completion. PLI values, in contrast, did not follow the same pattern: Although there were overall gains in intertrial phase stability, children with LLI still showed a significant decline in gamma PLI to the second stimulus after training. This dissociation between phase stability and power of gamma oscillations is an important conceptual point of the current study. In line with previous work (Fründ, Busch, Körner, Schadow, & Herrmann, 2007), the present alterations in gamma-band PLI and amplitude were not always positively related and seemed to possess differential sensitivity to changes in the functional architecture as a consequence of FFW training.
The relationship between phase and amplitude of high-frequency oscillations in auditory cortex has been studied extensively in the animal model (Schroeder & Lakatos, 2009). This work has suggested that oscillatory processes at different frequencies interact to facilitate integrative processing, and that high frequency oscillatory activity in the gamma range, modulated by phase fluctuations in lower frequency bands, may represent variations of the concerted excitability in cortical cell assemblies (Lakatos et al., 2005). Although not within the scope of the present manuscript, future work in LLI may examine coupling among frequencies within and outside the gamma range as it is altered by inter-individual differences or intervention remedies.
In humans, heightened phase-locking in the gamma-band range has been associated with the formation of learned, multi-feature representations embedded in cortical networks (Heim & Keil, 2006). It has been argued that the formation of new Hebbian connections may result in increased phase-locking, indicating temporally stable and effective ignition of an established network (Miltner, Braun, Arnold, Witte, & Taub, 1999). Such network formation would not necessarily have to be accompanied by heightened amplitude (Gruber, Malinowski, & Müller, 2004) reflecting hypothetical processes such as sharpening, in which a neuronal network has fewer, but efficiently connected members. Vice versa, amplitude enhancement without changes in phase stability across trials may indicate that – while the temporal organization of the neural masses generating the scalp recorded potential remains unaltered – the signal amplitude is enhanced through factors such as recruitment of greater numbers of neurons (Lachaux et al., 2005). This pattern is consistent with the present findings, suggesting that training may result in increased neuronal recruitment or increased gain, when processing fast-rate acoustic signals. Although our focus was on PLI and amplitude in response to the second of two tones, we also observed PLI and amplitude enhancement in the LLI group in response to the first tone, after treatment. Such heightened temporal organization could be related to learning and experience mediated by the training program. Alternatively, enhancement for the initial tone may reflect non-specific effects such as familiarity with the recording setting and better signal-to-noise due to better compliance and lower anxiety/arousal in the test situation. Suggestive evidence for the latter possibility emerges from the pattern of results in the TLD group, demonstrating higher phase stability at visit 2 compared to visit 1, only for the first stimulus of the doublet.
To explore the specific statistical relationship between changes in oscillatory brain activity and behavioral changes after training, we conducted regression analyses of change scores across individuals. In support of the view that successful language acquisition involves the ability to integrate rapidly presented, brief acoustic cues in sensory cortex (Tallal, 2004; Choudhury & Benasich, 2011), we found that improvements in oral language from visit 1 to visit 2 were systematically determined by enhanced phase stability of auditory gamma cycles regardless of LLI status. While PLI alterations for the first tone of the doublet were predictive of changes in the Expressive Language index and Core Language composite, PLI gains for the second sound explained ameliorated performance on the Receptive Language scale. According to the test manual, the Core Language composite of the CELF-4 is derived by calculating the sum across a defined set of subtests of the receptive and expressive language domains (Semel et al., 2003). Children in our study fell in age ranges for which a higher proportion of expressive than receptive skills define the overall score. This will lead to similarities as were apparent in the Expressive and Core Language regression patterns. In contrast, no significant associations were observed between changes in phase stability and changes in reading performance. Common to all alphabetic orthographies, formal instruction and exposure to print are essential factors in the acquisition of literacy skills. Moreover, English is characterized by an inconsistent orthography, making the learning process more laborious and longer lasting than in many other languages (Ziegler & Goswami, 2005). Considering the short inter-assessment interval and the fact that school was not in session over that time period, any systematic changes in literacy may not have had time to manifest and were therefore not evident. Overall, the high predictive value of change in PLI is in line with the notion that receptive language function greatly depends on temporally accurate processing. In the same vein, previous behavioral work has demonstrated the relationship between poor auditory analysis and language comprehension deficits in children with LLI (Tallal, Stark, & Mellits, 1985). Furthermore, poor reading performance in adults was found to be linked to attenuated magnetocortical responses to the second of two brief, successive tones, which translated into the concurrent assessed behavioral deficits in the temporal order task (Nagarajan et al., 1999).
In the current study, TLD children were not trained but did show changes in amplitude and phase stability across visits. These changes were reflected in the regression analyses, where changes in PLI values for each tone as well as changes in oral language measures were defined as ratios by expressing the second visit in terms of the first. Although maturational/developmental factors on a short-term scale may be contributing to the regression effects, it is also conceivable that repeated exposure to the experimental tones alters the neuronal response. Suggestive evidence comes from animal work, using a rodent model for impaired auditory temporal discrimination: Perinatally induced microgyria negatively influenced auditory discrimination in adult rats with no prior exposure to complex sounds (Threlkeld, Hill, Rosen, & Fitch, 2009). Acoustically exposed, microgyric animals showed no such deficits. Together with electrophysiological studies in humans, these results may open an exciting new avenue of research in infants at risk for developing LLI due to familial aggregation of language and reading disorders. More precisely, sound experiences early in infancy may help drive enhanced neural responses to rapid acoustic signals and ultimately benefit in acquiring proper language and literacy skills.
Gamma oscillations co-vary with a variety of cognitive processes, including feature binding, attention, working memory, and learning (Headley & Weinberger, 2011). In the auditory mammalian cortex, they have been argued to be at the top of a hierarchy of phase-amplitude relationships across oscillations in multiple frequency bands (Lakatos et al., 2005). Although FFW is designed to target RAP, the training exercises affect attention and working memory as well (Stevens et al., 2008). In fact, several of the FFW games were explicitly designed to additionally enhance attention span, selective attention, and memory (Tallal, 2004; Tallal & Gaab, 2006). The question arises if the changes in neural mass activity observed in LLI following FFW might represent an index of enhanced RAP skills. Two aspects may provide supportive evidence: First, as will be detailed elsewhere, the present LLI group showed gains in RAP performance in a behavioral test from visit 1 to visit 2. Second, auditory evoked GBRs in the very early time region have been shown to be sensitive to learning, conditioning, and habituation in healthy individuals (Kaiser & Lutzenberger, 2005), making them a candidate indicator for sensory plasticity. In the case of training-induced effects in LLI, such plasticity may involve heightened response amplitude while the temporal organization of oscillatory activity is still atypical. Future work may examine if language exposure in an ecological setting affects phase stability beyond immediate effects of intense training.
Highlights.
Children with LLI differ from typical peers in sensory cortical processing
Electrocortical gamma activity was measured in response to fast-rate tone doublets
Training modulates early auditory oscillatory activity in LLI children
Oscillatory activity in LLI normalized following completion of training
Temporal stability of gamma oscillations in LLI was still atypical after training
Acknowledgments
This work was supported by grants from the National Institute of Child Health and Human Development (R01-HD29419) and the National Science Foundation (#SBE-0542013 to the “Temporal Dynamics of Learning Center”) with additional support from the Ellison Medical Foundation and the Elizabeth H. Solomon Center for Neurodevelopmental Research to A.A. Benasich, and from the National Institute of Mental Health (R01 MH084932-02) to A. Keil. We would like to thank the children, who volunteered their time to participate in this research, as well as the parents for their commitment. Special thanks to Cecylia Chojnowska and Stephani Babcock for help in acquisition and reduction of electrophysiological data.
Footnotes
Publisher's Disclaimer: This is a PDF file of an unedited manuscript that has been accepted for publication. As a service to our customers we are providing this early version of the manuscript. The manuscript will undergo copyediting, typesetting, and review of the resulting proof before it is published in its final citable form. Please note that during the production process errors may be discovered which could affect the content, and all legal disclaimers that apply to the journal pertain.
References
- American Psychiatric Association (APA) Diagnostic and statistical manual of mental disorders. 4. Washington, DC: Author; 2000. textrev. [Google Scholar]
- Benasich AA, Choudhury N, Friedman JT, Realpe-Bonilla T, Chojnowska C, Gou Z. The infant as a prelinguistic model for language learning impairments: predicting from event-related potentials to behavior. Neuropsychologia. 2006;44:396–411. doi: 10.1016/j.neuropsychologia.2005.06.004. [DOI] [PMC free article] [PubMed] [Google Scholar]
- Benasich AA, Tallal P. Infant discrimination of rapid auditory cues predicts later language impairment. Behavioural Brain Research. 2002;136:31–49. doi: 10.1016/s0166-4328(02)00098-0. [DOI] [PubMed] [Google Scholar]
- Benasich AA, Thomas JJ, Choudhury N, Leppänen PH. The importance of rapid auditory processing abilities to early language development: evidence from converging methodologies. Developmental Psychobiology. 2002;40:278–292. doi: 10.1002/dev.10032. [DOI] [PMC free article] [PubMed] [Google Scholar]
- Berg P, Scherg M. A multiple source approach to the correction of eye artifacts. Electroencephalography and Clinical Neurophysiology. 1994;90:229–241. doi: 10.1016/0013-4694(94)90094-9. [DOI] [PubMed] [Google Scholar]
- Bishop DV. Uncommon understanding: Development and disorders of language comprehension in children. Hove, UK: Psychology Press; 1997. [Google Scholar]
- Borden GJ, Harris KS. Speech science primer: Physiology, acoustics, and perception of speech. Baltimore, MD: Williams & Wilkins; 1980. [Google Scholar]
- Choudhury N, Benasich AA. Maturation of auditory evoked potentials from 6 to 48 months: prediction to 3 and 4 year language and cognitive abilities. Clinical Neurophysiology. 2011;122:320–338. doi: 10.1016/j.clinph.2010.05.035. [DOI] [PubMed] [Google Scholar]
- Cohen J. Statistical power analysis for the behavioral sciences. 2. Hillsdale, NJ: Erlbaum; 1988. [Google Scholar]
- de Villers-Sidani E, Merzenich MM. Lifelong plasticity in the rat auditory cortex: basic mechanisms and role of sensory experience. Progress in Brain Research. 2011;191:119–131. doi: 10.1016/B978-0-444-53752-2.00009-6. [DOI] [PubMed] [Google Scholar]
- Elbert T, Heim S. Cortical reorganization: a light and a dark side. Nature. 2001;411:139. doi: 10.1038/35075678. [DOI] [PubMed] [Google Scholar]
- Fründ I, Busch NA, Körner U, Schadow J, Herrmann CS. EEG oscillations in the gamma and alpha range respond differently to spatial frequency. Vision Research. 2007;47:2086–2098. doi: 10.1016/j.visres.2007.03.022. [DOI] [PubMed] [Google Scholar]
- Gaab N, Gabrieli JD, Deutsch GK, Tallal P, Temple E. Neural correlates of rapid auditory processing are disrupted in children with developmental dyslexia and ameliorated with training: an fMRI study. Restorative Neurology and Neuroscience. 2007;25:295–310. [PubMed] [Google Scholar]
- Gilbert SL, Dobyns WB, Lahn BT. Genetic links between brain development and brain evolution. Nature Reviews Genetics. 2005;6:581–590. doi: 10.1038/nrg1634. [DOI] [PubMed] [Google Scholar]
- Gruber T, Malinowski P, Müller MM. Modulation of oscillatory brain activity and evoked potentials in a repetition priming task in the human EEG. European Journal of Neuroscience. 2004;19:1073–1082. doi: 10.1111/j.0953-816x.2004.03176.x. [DOI] [PubMed] [Google Scholar]
- Hauk O, Keil A, Elbert T, Müller MM. Comparison of data transformation procedures to enhance topographical accuracy in time-series analysis of the human EEG. Journal of Neuroscience Methods. 2002;113:111–122. doi: 10.1016/s0165-0270(01)00484-8. [DOI] [PubMed] [Google Scholar]
- Headley DB, Weinberger NM. Gamma-band activation predicts both associative memory and cortical plasticity. Journal of Neuroscience. 2011;31:12748–12758. doi: 10.1523/JNEUROSCI.2528-11.2011. [DOI] [PMC free article] [PubMed] [Google Scholar]
- Heim S, Benasich AA. Developmental disorders of language. In: Cicchetti D, Cohen DJ, editors. Developmental psychopathology: Risk, disorder, and adaptation. 2. Vol. 3. Hoboken, NJ: Wiley; 2006. pp. 268–316. [Google Scholar]
- Heim S, Friedman JT, Keil A, Benasich AA. Reduced sensory oscillatory activity during rapid auditory processing as a correlate of language-learning impairment. Journal of Neurolinguistics. 2011;24:539–555. doi: 10.1016/j.jneuroling.2010.09.006. [DOI] [PMC free article] [PubMed] [Google Scholar]
- Heim S, Keil A. Effects of classical conditioning on identification and cortical processing of speech syllables. Experimental Brain Research. 2006;175:411–424. doi: 10.1007/s00221-006-0560-1. [DOI] [PubMed] [Google Scholar]
- Herrmann CS, Munk MH, Engel AK. Cognitive functions of gamma-band activity: memory match and utilization. Trends in Cognitive Sciences. 2004;8:347–355. doi: 10.1016/j.tics.2004.06.006. [DOI] [PubMed] [Google Scholar]
- Hollingshead AB. Unpublished working paper. New Haven (CT): Department of Sociology, Yale University; 1975. Four factor index of social status. Available from http://www.yale.edu/sociology/archives.html. [Google Scholar]
- Johnston MV. Plasticity in the developing brain: implications for rehabilitation. Developmental Disabilities Research Reviews. 2009;15:94–101. doi: 10.1002/ddrr.64. [DOI] [PubMed] [Google Scholar]
- Kaiser J, Lutzenberger W. Human gamma-band activity: a window to cognitive processing. Neuroreport. 2005;16:207–211. doi: 10.1097/00001756-200502280-00001. [DOI] [PubMed] [Google Scholar]
- Keil A, Heim S. Prolonged reduction of electrocortical activity predicts correct performance during rapid serial visual processing. Psychophysiology. 2009;46:718–725. doi: 10.1111/j.1469-8986.2009.00824.x. [DOI] [PMC free article] [PubMed] [Google Scholar]
- Keil A, Stolarova M, Moratti S, Ray WJ. Adaptation in human visual cortex as a mechanism for rapid discrimination of aversive stimuli. Neuroimage. 2007;36:472–479. doi: 10.1016/j.neuroimage.2007.02.048. [DOI] [PMC free article] [PubMed] [Google Scholar]
- Kewley-Port D. Measurement of formant transitions in naturally produced stop consonant-vowel syllables. Journal of the Acoustical Society of America. 1982;72:379–389. doi: 10.1121/1.388081. [DOI] [PubMed] [Google Scholar]
- Knief A, Schulte M, Bertrand O, Pantev C. The perception of coherent and non-coherent auditory objects: a signature in gamma frequency band. Hearing Research. 2000;145:161–168. doi: 10.1016/s0378-5955(00)00091-5. [DOI] [PubMed] [Google Scholar]
- Kronland-Martinet R, Morlet J, Grossmann A. Analysis of sound patterns through wavelet transforms. International Journal of Pattern Recognition and Artificial Intelligence. 1987;1:273–302. [Google Scholar]
- Krumpe JA, Harlow S. Effects of a computer-assisted language intervention in a rural Nevada center. Perceptual and Motor Skills. 2008;106:679–689. doi: 10.2466/pms.106.3.679-689. [DOI] [PubMed] [Google Scholar]
- Lachaux JP, Chavez M, Lutz A. A simple measure of correlation across time, frequency and space between continuous brain signals. Journal of Neuroscience Methods. 2003;123:175–188. doi: 10.1016/s0165-0270(02)00358-8. [DOI] [PubMed] [Google Scholar]
- Lachaux JP, George N, Tallon-Baudry C, Martinerie J, Hugueville L, Minotti L, Kahane P, Renault B. The many faces of the gamma band response to complex visual stimuli. Neuroimage. 2005;25:491–501. doi: 10.1016/j.neuroimage.2004.11.052. [DOI] [PubMed] [Google Scholar]
- Lakatos P, Shah AS, Knuth KH, Ulbert I, Karmos G, Schroeder CE. An oscillatory hierarchy controlling neuronal excitability and stimulus processing in the auditory cortex. Journal of Neurophysiology. 2005;94:1904–1911. doi: 10.1152/jn.00263.2005. [DOI] [PubMed] [Google Scholar]
- Matarazzo JD. Wechsler’s measurement and appraisal of adult intelligence. 5. Baltimore (MD): Williams & Wilkins; 1972. [Google Scholar]
- Matarazzo JD, Carmody TP, Jacobs LD. Test-retest reliability and stability of the WAIS: a literature review with implications for clinical practice. Journal of Clinical Neuropsychology. 1980;2:89–105. [Google Scholar]
- Merzenich MM, Jenkins WM, Johnston P, Schreiner C, Miller SL, Tallal P. Temporal processing deficits of language-learning impaired children ameliorated by training. Science. 1996;271:77–81. doi: 10.1126/science.271.5245.77. [DOI] [PubMed] [Google Scholar]
- Merzenich MM, Schreiner C, Jenkins W, Wang X. Neural mechanisms underlying temporal integration, segmentation, and input sequence representation: some implications for the origin of learning disabilities. Annals of the New York Academy of Sciences. 1993;682:1–22. doi: 10.1111/j.1749-6632.1993.tb22955.x. [DOI] [PubMed] [Google Scholar]
- Miltner WH, Braun C, Arnold M, Witte H, Taub E. Coherence of gamma-band EEG activity as a basis for associative learning. Nature. 1999;397:434–436. doi: 10.1038/17126. [DOI] [PubMed] [Google Scholar]
- Müller MM, Keil A, Kissler J, Gruber T. Suppression of the auditory middle-latency response and evoked gamma-band response in a paired-click paradigm. Experimental Brain Research. 2001;136:474–479. doi: 10.1007/s002210000597. [DOI] [PubMed] [Google Scholar]
- Nagarajan S, Mahncke H, Salz T, Tallal P, Roberts T, Merzenich MM. Cortical auditory signal processing in poor readers. Proceedings of the National Academy of Sciences, USA. 1999;96:6483–6488. doi: 10.1073/pnas.96.11.6483. [DOI] [PMC free article] [PubMed] [Google Scholar]
- Nakagawa S. A farewell to Bonferroni: the problems of low statistical power and publication bias. Behavioral Ecology. 2004;15:1044–1045. [Google Scholar]
- O’Connor EF., Jr Extending classical test theory to the measurement of change. Review of Educational Research. 1972;42:73–97. [Google Scholar]
- Pantev C. Evoked and induced gamma-band activity of the human cortex. Brain Topography. 1995;7:321–330. doi: 10.1007/BF01195258. [DOI] [PubMed] [Google Scholar]
- Peeva MG, Guenther FH, Tourville JA, Nieto-Castanon A, Anton JL, Nazarian B, Alario FX. Distinct representations of phonemes, syllables, and supra-syllabic sequences in the speech production network. Neuroimage. 2010;50:626–638. doi: 10.1016/j.neuroimage.2009.12.065. [DOI] [PMC free article] [PubMed] [Google Scholar]
- Penhune VB. Sensitive periods in human development: evidence from musical training. Cortex. 2011;47:1126–1137. doi: 10.1016/j.cortex.2011.05.010. [DOI] [PubMed] [Google Scholar]
- Pennington BF, Bishop DV. Relations among speech, language, and reading disorders. Annual Review of Psychology. 2009;60:283–306. doi: 10.1146/annurev.psych.60.110707.163548. [DOI] [PubMed] [Google Scholar]
- Perrin F, Pernier J, Bertrand O, Echallier JF. Spherical splines for scalp potential and current density mapping. Electroencephalography and Clinical Neurophysiology. 1989;72:184–187. doi: 10.1016/0013-4694(89)90180-6. [DOI] [PubMed] [Google Scholar]
- Phillips DP. Auditory gap detection, perceptual channels, and temporal resolution in speech perception. Journal of the American Academy of Audiology. 1999;10:343–354. [PubMed] [Google Scholar]
- Sabatinelli D, Lang PJ, Keil A, Bradley MM. Emotional perception: correlation of functional MRI and event related potentials. Cerebral Cortex. 2007;17:1085–1091. doi: 10.1093/cercor/bhl017. [DOI] [PubMed] [Google Scholar]
- Scherg M, Ille N, Bornfleth H, Berg P. Advanced tools for digital EEG review: virtual source montages, whole-head mapping, correlation, and phase analysis. Journal of Clinical Neurophysiology. 2002;19:91–112. doi: 10.1097/00004691-200203000-00001. [DOI] [PubMed] [Google Scholar]
- Scherg M, Von Cramon D. Evoked dipole source potentials of the human auditory cortex. Electroencephalography and Clinical Neurophysiology. 1986;65:344–360. doi: 10.1016/0168-5597(86)90014-6. [DOI] [PubMed] [Google Scholar]
- Schroeder CE, Lakatos P. Low-frequency neuronal oscillations as instruments of sensory selection. Trends in Neurosciences. 2009;32:9–18. doi: 10.1016/j.tins.2008.09.012. [DOI] [PMC free article] [PubMed] [Google Scholar]
- Scientific Learning Corporation. Fast ForWord Language [computer software] Oakland, CA: Author; 2001. [Google Scholar]
- Semel E, Wiig EH, Secord WA. The clinical evaluation of language fundamentals. 4. San Antonio, TX: The Psychological Corporation; 2003. [Google Scholar]
- Stevens C, Fanning J, Coch D, Sanders L, Neville H. Neural mechanisms of selective auditory attention are enhanced by computerized training: electrophysiological evidence from language-impaired and typically developing children. Brain Research. 2008;1205:55–69. doi: 10.1016/j.brainres.2007.10.108. [DOI] [PMC free article] [PubMed] [Google Scholar]
- Tallal P. Language learning impairment. In: Smelser NJ, Baltes PB, editors. International encyclopedia of the social & behavioral sciences. Oxford, UK: Pergamon; 2001. pp. 8353–8357. [Google Scholar]
- Tallal P. Improving language and literacy is a matter of time. Nature Reviews Neuroscience. 2004;5:721–728. doi: 10.1038/nrn1499. [DOI] [PubMed] [Google Scholar]
- Tallal P, Gaab N. Dynamic auditory processing, musical experience and language development. Trends in Neurosciences. 2006;29:382–390. doi: 10.1016/j.tins.2006.06.003. [DOI] [PubMed] [Google Scholar]
- Tallal P, Merzenich MM, Miller S, Jenkins W. Language learning impairments: integrating basic science, technology, and remediation. Experimental Brain Research. 1998;123:210–219. doi: 10.1007/s002210050563. [DOI] [PubMed] [Google Scholar]
- Tallal P, Miller SL, Bedi G, Byma G, Wang X, Nagarajan SS, Schreiner C, Jenkins WM, Merzenich MM. Language comprehension in language-learning impaired children improved with acoustically modified speech. Science. 1996;271:81–84. doi: 10.1126/science.271.5245.81. [DOI] [PubMed] [Google Scholar]
- Tallal P, Miller S, Fitch RH. Neurobiological basis of speech: a case for the preeminence of temporal processing. Annals of the New York Academy of Sciences. 1993;682:27–47. doi: 10.1111/j.1749-6632.1993.tb22957.x. [DOI] [PubMed] [Google Scholar]
- Tallal P, Piercy M. Defects of non-verbal auditory perception in children with developmental aphasia. Nature. 1973a;241:468–469. doi: 10.1038/241468a0. [DOI] [PubMed] [Google Scholar]
- Tallal P, Piercy M. Developmental aphasia: impaired rate of non-verbal processing as a function of sensory modality. Neuropsychologia. 1973b;11:389–398. doi: 10.1016/0028-3932(73)90025-0. [DOI] [PubMed] [Google Scholar]
- Tallal P, Piercy M. Developmental aphasia: rate of auditory processing and selective impairment of consonant perception. Neuropsychologia. 1974;12:83–93. doi: 10.1016/0028-3932(74)90030-x. [DOI] [PubMed] [Google Scholar]
- Tallal P, Piercy M. Developmental aphasia: the perception of brief vowels and extended stop consonants. Neuropsychologia. 1975;13:69–74. doi: 10.1016/0028-3932(75)90049-4. [DOI] [PubMed] [Google Scholar]
- Tallal P, Stark RE, Mellits D. The relationship between auditory temporal analysis and receptive language development: evidence from studies of developmental language disorder. Neuropsychologia. 1985;23:527–534. doi: 10.1016/0028-3932(85)90006-5. [DOI] [PubMed] [Google Scholar]
- Tallon-Baudry C, Bertrand O. Oscillatory gamma activity in humans and its role in object representation. Trends in Cognitive Sciences. 1999;3:151–162. doi: 10.1016/s1364-6613(99)01299-1. [DOI] [PubMed] [Google Scholar]
- Tallon-Baudry C, Bertrand O, Peronnet F, Pernier J. Induced gamma-band activity during the delay of a visual short-term memory task in humans. Journal of Neuroscience. 1998;18:4244–4254. doi: 10.1523/JNEUROSCI.18-11-04244.1998. [DOI] [PMC free article] [PubMed] [Google Scholar]
- Temple E, Deutsch GK, Poldrack RA, Miller SL, Tallal P, Merzenich MM, Gabrieli JD. Neural deficits in children with dyslexia ameliorated by behavioral remediation: evidence from functional MRI. Proceedings of the National Academy of Sciences, USA. 2003;100:2860–2865. doi: 10.1073/pnas.0030098100. [DOI] [PMC free article] [PubMed] [Google Scholar]
- The Psychological Corporation. Wechsler abbreviated scale of intelligence (WASI) San Antonio, TX: Author; 1999. [Google Scholar]
- Thorndike RL, Hagen EP, Sattler JM. The Stanford-Binet intelligence scale. 4. Chicago, IL: Riverside Publishing; 1986. [Google Scholar]
- Threlkeld SW, Hill CA, Rosen GD, Fitch RH. Early acoustic discrimination experience ameliorates auditory processing deficits in male rats with cortical developmental disruption. International Journal of Developmental Neuroscience. 2009;27:321–328. doi: 10.1016/j.ijdevneu.2009.03.007. [DOI] [PMC free article] [PubMed] [Google Scholar]
- Wilson AJ, Dehaene S, Pinel P, Revkin SK, Cohen L, Cohen D. Principles underlying the design of “The Number Race”, an adaptive computer game for remediation of dyscalculia. Behavioral and Brain Functions. 2006;2:19. doi: 10.1186/1744-9081-2-19. [DOI] [PMC free article] [PubMed] [Google Scholar]
- Woodcock RW. Woodcock reading mastery tests – Revised. Circle Pines, MN: American Guidance Service, Inc; 1987. [Google Scholar]
- Yuval-Greenberg S, Tomer O, Keren AS, Nelken I, Deouell LY. Transient induced gamma-band response in EEG as a manifestation of miniature saccades. Neuron. 2008;58:429–441. doi: 10.1016/j.neuron.2008.03.027. [DOI] [PubMed] [Google Scholar]
- Ziegler JC, Goswami U. Reading acquisition, developmental dyslexia, and skilled reading across languages: a psycholinguistic grain size theory. Psychological Bulletin. 2005;131:3–29. doi: 10.1037/0033-2909.131.1.3. [DOI] [PubMed] [Google Scholar]