

Abstract
The present study represents the first longitudinal, within-subject 1H MRS investigation of the developing rat brain spanning infancy, adolescence, and early adulthood. We obtained neurometabolite profiles from a voxel located in a central location of the forebrain, centered on the striatum, with smaller contributions for cortex, thalamus, and hypothalamus, on postnatal days 7, 35, and 60. Water-scaled metabolite signals were corrected for T1 effects and quantified using the automated processing software LCModel, yielding molal concentrations. Our findings indicate age-related concentration changes in N-acetylaspartate + N-acetylaspartylglutamate, myo-inositol, glutamate + glutamine, taurine, creatine + phosphocreatine, and glycerophosphocholine + phosphocholine. Using a repeated measures design and analysis, we identified significant neurodevelopment change across all three developmental ages and identified adolescence as a distinctive phase in normative neurometabolic brain development. Between postnatal days 35 and 60, changes were observed in concentrations of N-acetylaspartate + N-acetylaspartylglutamate, glutamate + glutamine, and glycerophosphocholine + phosphocholine observed between postnatal days 35 and 60. Our data replicate past studies of early neurometabolite development and, for the first time, link maturational profiles in the same subjects across infancy, adolescence, and adulthood.
Keywords: MRS, adolescence, rat, development, brain, longitudinal, NMR, spectroscopy
INTRODUCTION
In vivo MR imaging is yielding astounding new insights into brain development and maturation. Technological developments are rapidly increasing the range of possibilities for applying advanced imaging modalities to neonatal and pediatric populations (1). MR spectroscopy (MRS) can be used to detect metabolic information in structurally intact tissue in areas that were traditionally inaccessible. More recent expansion of high-field MR systems to small animal imaging is yielding new data that are critical for validating clinical approaches in relation to underlying biological mechanisms. The developing rat is a time-honored model for studying mammalian neurodevelopment over a short timeframe. The newborn rat brain has a maturational status similar to that of the late gestation human fetus, and within two months, reaches young adulthood (2). Thus longitudinal studies of the rat spanning infancy to adulthood can rapidly provide important new insights into human brain development across the lifespan.
The safety of high magnetic field exposure makes MRS particularly useful for repeated longitudinal monitoring of developmental responses to early life insults (3). Altered brain development can be identified in preclinical models of developmental disease if proper attention is given to common neurodevelopmental stages in animals and humans (4). Thus, findings derived from small animal MRS studies are directly translatable to clinical concerns. A number of studies have reported metabolite concentration changes in the developing rat brain (5–11). Most researchers have focused on early developmental ages (prior to adolescence) and adulthood with few (or none) following the same subjects from early to adult life. This leaves a significant gap in our understanding of normative neurometabolic changes across the lifespan. Since individual metabolite concentrations rarely follow a linear trajectory across maturation, longitudinal analysis of the same subjects throughout neurometabolite development is an important step toward filling this void.
Adolescence is a major transitional state during mammalian development marked by significant hormonal, behavioral, and physiological alterations. In the rat, adolescence spans postnatal days (P) 28 to 42 (12). The beginning of this period is marked by the onset of puberty and accompanying growth spurt (13). While no single event signals the conclusion of adolescence, a rat is considered to be post-adolescent by P56 (14), corresponding to a recognized adolescent period in humans between 10 and 19 years of age (15). Numerous maturational changes occur in the brain during adolescence, including synaptic pruning (16), apoptosis (17), and decreased rates of neurogenesis (18) relative to earlier developmental stages. Clinical imaging studies conducted across adolescence have demonstrated a decreasing ratio of gray matter to white matter (19) and increasing fractional anisotropy of the corpus callosum (20) coinciding with brain myelination. High levels of brain metabolism gradually decline during the transition from adolescence to adulthood (21). Collectively, these findings indicate that the period of adolescence is characterized by highly dynamic neurodevelopmental changes. Longitudinal in vivo spectroscopy incorporating normal adolescence will facilitate our understanding of the neurochemical trajectory of brain development and maturation, thereby significantly expanding our ability to identify abnormal metabolite concentrations relative to developmental timing.
The present study is the first to report longitudinal, within-subject neurochemical profiles in the rat brain spanning infancy, adolescence, and early adulthood. Using a 7T small animal scanner and 1H MRS, we acquired neurometabolic profiles of the forebrain, centered on the striatum, with smaller contributions for cortex, thalamus, and hypothalamus from the same rats at postnatal days (P)7, 35, and 60. While large-scale, longitudinal (within-subject) studies of normative brain metabolite concentrations in humans are prohibitively time-consuming, our data using the altricial at birth, rapidly maturing rat provide a solid translational context for interpreting understanding clinically-observed metabolite changes from infancy to adulthood.
METHODS
Subjects
Nine male offspring derived from nine time-mated Sprague-Dawley female rats bred with Sprague-Dawley males in our vivarium (Taconic Farms, Germantown, NY) were used for this analysis. Day of conception (Gestational day [G] 0) was identified by daily examination of vaginal cytology for presence of sperm. Timebred dams were housed in groups of three in standard maternity cages (47cm × 26cm × 21cm) lined with corncob bedding and maintained under standard colony conditions (12:12 light/dark cycle [0600:1800]; 21 +/− 1°C at 30 – 50% humidity). Rat chow (Purina #5102) and water were available ad libitum. To avoid multiple births under group housing conditions, dams were singly housed on G21.
On the expected day of birth (G22), pregnant dams were remotely observed using videography. Characteristic behavioral changes signaled the onset of parturition. Immediately postpartum, pups were removed from the dam and placed in an incubator at 36.5°C. At 1hr postnatal, ten pups per litter were fostered to a newly (≤24hr) parturient dam. On P21, offspring were weaned and male offspring housed with same-sex littermates.
Animal experimentation was conducted in full accordance with the NRC Guide for the Care and Use of Laboratory Animals (National Academy of Sciences, copyright 1996). All procedures were approved by the Wake Forest School of Medicine Institutional Animal Care and Use Committee (IACUC).
In Vivo 1H MRS
MRS was performed using a horizontal 7 T magnet interfaced with a digital spectrometer operating at a resonant frequency of 300 MHz (Bruker BioSpin, Billerica, MA). The system is equipped with a 12 cm actively-shielded gradient set, with a maximum gradient strength of 400 mT/m. Radio frequency excitation and reception were accomplished with a 3.8 cm ID quadrature litzcage coil (Doty Scientific, Columbia, SC.). All proton MR spectra were acquired using previously published methods (22–25).
Spectra were acquired longitudinally from the same subjects on P7, 35, and 60 under isoflurane anesthesia (3% isoflurane in 100% O2 at a flow rate of 4 liter/min), using a gas anesthesia system (Surgivet, Waukesha, WI). Consistent with published recommendations for prolonged anesthesia exposure (26), respiration rate was monitored throughout scanning and isoflurane concentration was adjusted to maintain respirations within a specified target zone (35–45rpm). Each rat was placed in the prone position on a small bed with cranial landmarks positioned carefully in relation to the bed to provide a reproducible position within the scanner. A respiratory pillow and a temperature probe placed underneath the rat’s lower torso permitted continuous monitoring of respiration and skin temperature. An MR-compatible temperature controller (SAII, Stony Brook, NY) was used to maintain temperature within the bore using a heated blown air system. Skin temperature for 7-day-old rats was maintained at 32°C. The older rats’ skin temperatures were maintained at 30°C, within the rat’s thermoneutral zone (27).
A rapid acquisition with relaxation enhancement (RARE) sequence (TE = 41ms, TR = 3000ms) was used to acquire T2-weighted brain images. Continuously spaced multislice images (0.5–0.75mm slice thickness) were acquired in coronal (FOV = 3.2 × 3.2cm2) and axial (FOV = 3.5 × 3.5cm2) orientations with a matrix size = 256 × 256. These hi-resolution images were used to assess anatomical differences across experimental conditions and as localizers for proper positioning of the spectroscopic voxels. In all rat brains, signal was acquired from a voxel (27, 55, or 64mm3 positioned in P7, 35 and 60 day-old rat brains, respectively) in a central location of the forebrain, centered on the striatum, with smaller contributions for cortex, thalamus, and hypothalamus (Fig. 1). Voxel size increased as a function of age to maintain signal contribution from a similar proportion of tissue across development.
Figure 1. Representative voxel placement for each age for scanning.

A 27, 55, or 64 mm3 voxel was placed in the forebrain of 7, 35, and 60 day old rats, respectively, centered on the left striatum, below the cortex and encompassing surrounding tissues using T2 weighted images in the axial and sagittal planes.
All proton MR spectra were acquired using a single-voxel, point-resolved, double spin-echo spectroscopy (PRESS) sequence with TE = 20ms, TR = 2500ms, total number of acquisitions = 1024, and total acquisition time = 40 min. To perform LCModel (linear combination of model in vitro spectra from individual metabolite solutions) quantitative analysis, two separate MR spectra from the same volume of interest, one with, one without water suppression, were acquired for processing. Prior to each spectral acquisition, localized voxel shimming was performed using the FASTMAP technique (28). Shimming quality was determined by the line width of the water peak in the unsuppressed water spectra. Water suppression was achieved using the variable pulse power and optimized relaxation delays (VAPOR) sequence (29), with a proper adjustment of suppression pulse angles. Supplemental Figure 1 shows the degree of water suppression achieved. Each procedure lasted, on average, 90 min from induction of anesthesia until completion of signal acquisition.
MRS Spectral Processing and Data Analysis
For quantitative measurement of each brain metabolite, the raw spectral data were transferred to a Linux workstation and analyzed using LCModel (30, 31). All spectra were first corrected for eddy-current distortion using the unsuppressed water spectra as the reference. The Fourier transform was performed without zero-filling and apodization. Phase corrections were applied using a built-in algorithm in LCModel to allow for quick convergence during the fitting and optimization process. Each spectrum was fitted to a set of known spectra from a series of metabolite solutions of known concentrations. Spectral peaks were assigned relative to the singlet CH3 peak of NAA. LCModel scaled the spectral metabolite concentrations to a non-water-suppressed spectrum collected immediately prior to the water-suppressed spectrum. We determined age-appropriate brain water concentrations to be 88% (P7) and 78% (P35 and P60), confirming values observed in previous reports (5, 32–33).
Zero-order phase correction after ECC was necessitated by use of convdta to convert from Bruker DSP-collected data to LCModel-format data and by different receiver gain settings used between the unsuppressed and suppressed spectra. The broadness of several resonances and the comparatively low S/N of certain spectra, coupled with the simultaneous automatic baseline and phase fitting by LCModel gave rise to poor phase and baseline characteristics in some of our spectra. To resolve this, we determined the optimal phase corrections for a given receiver gain pairing on high S/N spectra and forced LCModel to optimize zero order phase near this value (SDDEGZ=10). We also limited spline node size by setting the LCModel parameter DKNTMN=0.2, as was used by Terpstra et al., 2010 (34).
We obtained a basis set of model metabolites appropriate for our acquisition parameters from Stephen Provencher (personal communication). Spectral processing with LCModel determined contributions from the following metabolites: L-alanine (Ala), aspartate (Asp), creatine (Cr), phosphocreatine (PCr), γ-aminobutyric acid (GABA), glucose (Glc), glutamate (Glu), glutamine (Gln), glycerophosphocholine (GPC), phosphocholine (PCh), myo-inositol (Ins), L-lactate (Lac), N-acetylaspartate (NAA), N-acetylaspartylglutamate (NAAG), taurine (Tau), scyllo-inositol (Scyllo), and guanidoacetate (Gua) as well as signal contributions from macromolecules and lipids. To determine the detectability of each metabolite from measured spectra, the percent standard deviation of each metabolite, defined as the Cramer-Rao lower bounds (CRLB) criteria, was derived as a measureable index for quantitation reliability (35). A CRLB of < 25% was considered as an acceptable level of quantitation reliability (30, 31). For each metabolite quantified, only rats with CRLB of < 25% for each of the three scanning ages were used in the final analysis, resulting in fewer metabolites analyzed than were initially acquired, as shown in Table 1.
Table 1.
Mean Cramer-Rao lower bounds (CRLB) of reliably detectable metabolites at P7, P35 and P60 as calculated by LCModel.
| Metabolite | N | Mean CRLB
|
||
|---|---|---|---|---|
| P7 | P35 | P60 | ||
| Ins | 8 | 10 | 5 | 5 |
| Tau | 9 | 4 | 4 | 5 |
| GPC+PCh | 9 | 3 | 3 | 3 |
| NAA+NAAG | 9 | 12 | 5 | 4 |
| Glu+Gln | 9 | 12 | 5 | 5 |
| Cr+PCr | 9 | 5 | 3 | 3 |
Water Content
Six P7, two P35, and two P60 rats were used to measure brain water content. Tissue water percentage was determined by removing the brain following euthanization and comparing the differential between wet brain weight and brain weight following dehydration at 90° C. Observed water content percentages were used in the determination of molal concentrations.
Relaxation Correction
T1relaxation times were determined in P7, P35, and P60 rats (n=3) from spectra acquired from the same forebrain voxel in the developmental analysis using the equipment and procedures described above. The resulting spectra were processed using LCModel without water referencing. To determine T1 relaxation for Ins, Tau, NAA+NAAG, GPC+PCh, Cr+PCr, and Glu+Gln, six spectra from each animal were acquired with a fixed 20 ms TE and six different TRs (1250, 2500, 3750, 5000, 6500, and 8000 ms).
Concentrations for the above metabolites were fit to an exponential recovery curve of the form [S = 1 - exp(-TR/T1)] to determine T1 relaxation times (Supplemental Fig. 2).
Statistical Analysis
Neurometabolite data were analyzed using one-way repeated measures analysis of variance (ANOVA), with pairwise Student Neuman–Keuls t-tests used to determine developmental differences in individual metabolites. T1 relaxation times were tested for significance using one-way ANOVA, with Student Neuman–Keuls t-tests used to determine significance between measured ages. An alpha level of p<0.05 was set for all statistical tests, which were run using Sigmastat Version 3.5 (Systat Software, Inc., 2006). Metabolite concentrations on P7, P35, and P60 were Pareto scaled and analyzed using the principle components analysis (PCA) module of MetaboAnalyst (36).
RESULTS
All spectra were initially processed using Topspin software (Bruker Biospin) to assess overall spectral quality. Each processed spectrum was reviewed by two independent readers to ensure well-resolved peaks for metabolites detectable in rat brain, proper voxel placement, zero order phase correction, chemical shift referencing, and smooth baselines. The mean ± standard deviation (SD) full-width at half-maximum (FWHM) values of the unsuppressed water signal, mean ± SD signal to noise ratio, defined as the ratio of the maximum in the spectrum minus baseline to twice the RMS residuals, and calculated brain water content used for quantification are shown in Table 2. Calculated T1 relaxation times used to correct measured metabolite concentrations are shown in Table 3. Representative spectra at each measured TR and fitted curves are shown in Supplemental Figure 2. Although T1 decreased with age, these differences were not statistically significant, except for GPC+PCh.
Table 2.
Signal to noise ratios and peak widths (± SD) from spectra used in analysis
| Signal / Noise | Unsuppressed water signal FWHM(Hz) | Brain water content | |
|---|---|---|---|
|
|
|||
| P7 | 10.7 ± 1.6 | 12.6 ± 4.5 | 87.42% |
| P35 | 12.7 ± 1.7 | 15.9 ± 1.8 | 79.64% |
| P60 | 12.8 ± 1.8 | 12.6 ± 1.26 | 79.32% |
Table 3.
Estimated T1 relaxation times (ms) ± SD for each metabolite on P7, P35 and P60.
| Metabolites | P7 | P35 | P60 | |||
|---|---|---|---|---|---|---|
|
| ||||||
| T1 (ms) | χ2 | T1 (ms) | χ 2 | T1 (ms) | χ 2 | |
| Ins | 1268 ± 560 | 148.2 | 1193 ± 277 | 17.7 | 1145 ± 198 | 9.8 |
| Tau | 1891 ± 370 | 24.9 | 1681 ± 105 | 9.4 | 1592 ± 216 | 6.1 |
| NAA + NAAG | 1260 ± 558 | 37.3 | 1364 ± 107 | 9.9 | 1254 ± 152 | 6.9 |
| GPC + PCh | 1072 ± 58 | 4.0 | 836 ± 125* | 1.9 | 789 ± 66* | 2.8 |
| Cr + PCr | 1858 ± 540 | 20.7 | 1496 ± 166 | 2.3 | 1402 ± 12 | 3.5 |
| Glu + Gln | 1310 ± 390 | 351.3 | 1047 ± 36 | 17.0 | 887 ± 55 | 12.3 |
Values marked with an * indicate significant difference (p<0.05) from P7 value.
Typical single-voxel MR spectra acquired from P7, 35, and 60 rats are shown in Figure 2A. Figure 2B shows a representative baseline-corrected and fitted P60 spectrum, the residuals, and the contribution of individual components as determined by LCModel.
Figure 2. Representative metabolite spectra at three measured ages.

(A) Single voxel MR spectra obtained from rats on postnatal day (P) 7, 35, and 60. The source spectrum is overlaid with the fitted LCModel result (red) fit from 4.2–0.2 ppm. (B) The contribution of individual metabolites, as well as lipids and macromolecules, to the fitted LCModel result in a representative P60 spectrum, shown with baseline subtraction.
Metabolites used in the final analysis were Ins, Tau, NAA+NAAG, GPC+PCh, Glu+Gln, and Cr+PCr. Combined values were reported for NAA+NAAG, GPC+PCh, Glu+Gln, and Cr+PCr due to inability to consistently resolve individual components. Reported values are water-scaled metabolite concentrations determined by LCModel via acquisition of a non-water suppressed spectra in the target voxel. All reported metabolites were quantified with a CRLB of < 25% at all three scanning ages.
Figure 3 shows the developmental trajectory of observed metabolites. A main effect of age on concentration was observed for the following metabolites: Ins [F (2, 23) = 10.959, p = 0.001], Tau [F (2, 26) = 103.805, p = 0.001], GPC+PCh [F (2, 26) = 74.614, p = 0.001], NAA+NAAG [F (2, 26) = 87.294, p = 0.001], Cr+PCr [F (2, 26) = 13.737, p = 0.001], and Glu+Gln [F (2, 26) = 76.363, p = 0.001]. Student Neuman–Keuls tests for multiple comparisons were used to identify statistical significance (p < 0.05) between P7, P35, and P60. Consistent with previous reports (5–11), Ins, NAA+NAAG, Cr+PCr, and Glu+Gln concentrations increased from the neonatal stage (P7) to young adulthood (P60), while Tau and GPC+PCh concentrations decreased from P7 to P60.
Figure 3. Neurochemical concentrations on postnatal days 7, 35, and 60.

Plots show the individual values from each subject for each measured metabolite at each age. Bars show the mean at each age. Significance determined by one-way repeated measures ANOVA, followed by post hoc Student Neuman-Keuls t-tests (p < 0.05) as follows, * statistically different from P7, † statistically different from P35. Measured metabolites were myo-inositol (Ins), taurine (Tau), glycerophosphocholine + phosphocholine (GPC+PCh), N-acetylaspartate + N-acetylaspartylglutamate (NAA+NAAG), creatine + phosphocreatine (Cr+PCr), and glutamate + glutamine (Glu+Gln). N=9 for all metabolites except Ins, N=8.
At P60 statistically significant increases from P7 values were observed in the concentration of Ins (p = 0.001), NAA+NAAG (p = 0.001), Cr+PCr (p = 0.001), and Glu+Gln (p = 0.001). Ins (p = 0.01), NAA+NAAG (p=0.001), Cr+PCr (p=0.001), and Glu+Gln (p=0.001) concentrations were observed to increase from P7 to P35. Concentrations of NAA+NAAG (p = 0.002) and Glu+Gln (p = 0.004) also increased from P35 to P60.
Tau and GPC+PCh concentrations were significantly lower at P60 relative to P7 (p = 0.001). Tau decreased (p = 0.001) from P7 to P35, while concentrations from P35 to P60 did not statistically differ. GPC+PCh concentrations differed significantly at all three ages, decreasing (p = 0.001) from P7 to P35, and then showing a significant increase (p = 0.006) at P60 relative to P35.
To further characterize changes in metabolite concentrations over the course of development, spectral profiles were analyzed using PCA (36). PCA differentiates between P7, P35, and P60, primarily along the first component, PC1, with P7 the most distinct (Fig. 4A). Analysis of the loading plot (Fig. 4B) shows that changes in Glu+Gln, NAA+NAAG, and Tau concentrations are the major contributors to PC1.
Figure 4. Principal Components Analysis (PCA) of developmental metabolite profiles in P7, P35, and P60 rat brain.
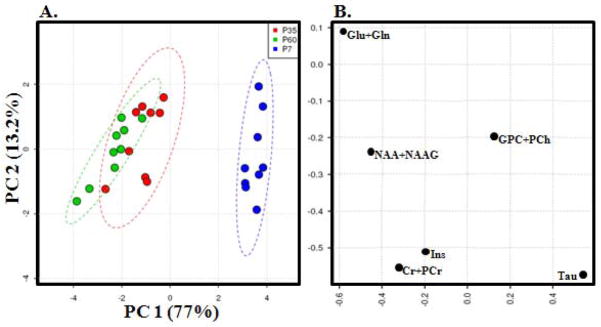
(A) Score plot demonstrating age-based clustering. Dashed lines indicate 95% confidence intervals. (B) Loading values of measured metabolites.
DISCUSSION
Our findings show profound developmental changes in neurometabolite levels between P7, P35, and P60 as measured by longitudinal 1H MRS in a 7T magnet. This study is the first to report on rat brain metabolites using in vivo MR imaging applied longitudinally from neonatal life through adolescence and into early adulthood. Our data are in agreement with previous reports demonstrating that the first four postnatal weeks are a period of dynamic change in the observed metabolite concentrations (5–11). Notably, by obtaining from the same subjects repeated metabolic profiles through the first eight postnatal weeks, we have been able to provide the first evidence that the adolescent rat brain continues to show developmental changes of MRS-observable metabolite concentrations during the continued period of maturation extending to adulthood.
Concentrations of Ins, NAA+NAAG, Cr+PCr, and Glu+Gln increased from P7 to P60. Tau and GPC+PCh concentrations decreased from P7 to P60. This study confirms previous reports of major developmental change in the metabolite concentrations of the rat’s striatum and surrounding forebrain nuclei occur between P7 and P35, and identifies further maturation between P35 and P60. The PCA analysis shows separation of P35 and P60 metabolite profiles, further demonstrating that adult neurometabolite profiles differ from those during adolescence.
The present study analyzes metabolite data quantified using internal water referencing to obtain molal concentrations. While metabolite spectral data are often scaled to an internal metabolite, the concentration of any given metabolite may vary throughout development or in response to disease or injury (33, 37–39). Therefore, the developmental component of the present study necessitated the estimation of absolute metabolite concentrations. Factors affecting the concentration estimates include brain water content, partial volume effects and metabolite relaxation effects. Given the longitudinal, within-subjects design of this study, we were unable to determine precise brain water content for each rat at each age. Table 2 presents developmental changes in brain water content derived from a subset of animals in our lab. The values are in strong concordance with earlier published reports (5, 32–33). Using these values, metabolites were water-referenced at each age. Our data were not corrected for T2 effects or partial volume effects due to low estimated signal contributions (~5%) of white matter and CSF.
TR (2500ms) was selected to avoid substantial signal attenuation from incomplete T1 relaxation while minimizing total scan time. Metabolite concentrations were corrected for T1relaxation effects following measurement of metabolite T1 in a subset of animals (Table 3). Attenuation of metabolite signals from T1 effects ranged from 10–35%. Our data show a consistent shortening of T1 with increasing age, except for NAA+NAAG; however, only GPC+PCh T1 showed a statistically significant change. Larvaron et al., 2009, in a report on developing mice conducted at 9.4 T, observed no change in T1 relaxation in the thalamus as a function of maturation (40). Following correction for T1 relaxation effects, our data fit within the range of metabolite concentrations found in literature reports of both in vivo and extracted rat brain neurochemical concentrations measured on or near the developmental ages investigated in this study, as shown in Table 4 (5, 41–49).
Table 4.
Metabolite concentrations ± SD (μmol/g) comparisons.
| Metabolites | P7 | P35 | P60 | |||
|---|---|---|---|---|---|---|
|
| ||||||
| This Study | Literature | This Study | Literature | This Study | Literature | |
| Ins | 3.17±0.78 | 0.8–3.2(5,41,42) | 3.93±0.45 | 3.76–5(41,42) | 4.34±0.61 | 3.84–5.9(41,45) |
| Tau | 11.64±1.2 | 11.4–21(5,42,43,48) | 6.97±0.57 | 5.5–10(43,48) | 6.26±0.57 | 3.5–7.6(42,45–48) |
| GPC+PCh | 1.87±0.18 | 1.4–1.57(5,42) | 1.24±0.08 | 1.37(42) | 1.41±0.08 | 1.54–1.71(46,47) |
| NAA+NAAG | 2.45±0.51 | 2.5–2.8(5,49) | 4.84±0.58 | 5–8(42,48,49) | 5.86±0.69 | 5.1–11.9(45–47) |
| Cropper | 5.40±1.1 | 5.2–5.96(5,42,43) | 6.75±0.82 | 6.71–9.5(42–44) | 6.58±0.82 | 8.1–10(43–47) |
| Glu+Gln | 5.38±0.77 | 4.9–9(5,42,43) | 8.96±0.79 | 13–14.1(42–44) | 10.4±0.86 | 10.1–16.8(43–47) |
Metabolite T2 relaxation times remain challenging to accurately measure in vivo with limited acquisition time and resolution, particularly in the presence of J-coupling, as noted in Xin et al., 2008 (50). Our data were acquired with TE=20 ms to limit T2 signal attenuation effects. Larvaron et al., 2009 (40) measured T2 relaxation times as a function of age in preweanling mice. They observed T2 times ranging from 100–150 ms for most metabolites, with the exception of 80 ms total choline T2 relaxation in neonatal mice and NAA T2 relaxation over 250 ms on P15 and P21. Their findings indicated potential developmental effects on T2 relaxation, though the effects are modest. These findings are in agreement with other published reports of metabolite T2 relaxation times measured at 9.4 T in adult Sprague-Dawley rat brain (50–52). De Graff et al., 2006 observed a shortening of T2 relaxation rate with increasing field strength (52); therefore T2 relaxation time at 7 T is likely longer than the above cited reports. With field strength of 7 T and TE=20ms, T2 effects in the present study are anticipated to be small, though potentially significant.
The report by Larvaron et al., 2006, (40) indicates an overall trend of increasing T2 times with age, as measured from one to three weeks old. This suggests that the observed P7 values may be relatively more attenuated than the observed values at P35 and P60. Therefore, any report of increased metabolite concentration with age may reflect an increase in T2 relaxation, if values are not properly adjusted for T2 effects. On the other hand, observed decreases in metabolite concentrations with age (the reduction in GPC+PCh and Tau from P7 to P35, for instance) may be partially masked by increased T2 relaxation. However, developmental T2 effects are unlikely to effect the interpretation of the observed data. Ins, NAA+NAAG, and Glu+Gln were observed to increase in the range of 25–95% from P7 to P35, with NAA+NAAG and Glu+Gln increasing by 15–20% from P35 to P60. GPC+PCh increased by 13% from P35 to P60. From previous reports of metabolite T2s in rodent brain during development and in adulthood (40, 50), it is likely that the observed increase in GPC+PCh from P35 to P60 could be due to T2 effects, given the shorter T2 rates and dynamic change with development. Assuming similar T2 rates as previously observed (40, 50), the age differences in the other observed metabolites concentrations cannot be explained solely as a developmental change in T2 times
The rapid changes in neurogenesis, myelination, and energy metabolism of the developing brain are reflected in neurometabolite development. NAA has the most prominent peak on the adult brain spectrum and has therefore been observed as a sensitive marker of neuronal dysfunction and degradation, due to its localization exclusive to neurons (53) and decreased concentration often associated with neuronal death (54). Functionally NAA has been proposed to play the role of an enhancer of mitochondrial synthesis, a precursor to NAAG, an osmoregulator, an axon-glia signal molecule, and a nitrogen regulator (55). It may also play a unique role in development, as evidenced by the transient, developmental localization of NAA in oligodendrocytes (56, 57). At this stage, NAA may undergo axonal to myelin transport as source of acetyl groups during myelin lipid synthesis (58). Given that the majority of neurogenesis in the rat occurs during the embryonic stage (4), our observed increase in NAA+NAAG concentration is likely attributable to ongoing neuronal maturation than increased neuron numbers.
Ins is an osmoregulator and often considered a glial marker due to its astrocyte localization (59). Pathological upregulation of Ins has been observed in neurodegenerative diseases such as Alzheimer’s and Huntington’s disease, potentially as a sign of gliosis (60–62). In the rat, astrogliogenesis peaks during the first postnatal week (63). Our observed Ins concentration increase from P7 to P60 may reflect a longitudinal developmental requirement for inositol-containing phospholipids (64).
Tau and GPC+PCh were observed to decrease with development, in agreement with previous in vivo 1H MRS reports of choline and taurine developmental decreases in rat and human studies (5–7, 65). In the perinatal period, sufficient levels of both taurine and choline are vital to proper brain development (66, 67). GPC+PCh levels have been previously interpreted as related to turnover of choline containing membrane constituents (68) as well as acetylcholine turnover (69). We also observed a significant increase in GPC+PCh between P35 and P60. To our knowledge, such a finding has not been previously reported in rats at these ages. Few studies have observed GPC+PCh at these ages, and ours is the first to have done so longitudinally within-subjects. The repeated measures design utilized in the present study provided an effective approach for identifying altered developmental trajectories. As discussed above, the observed increase may result from T2 effects. A longitudinal report on development of metabolites in the thalamus of preweanling mouse observed similar developmental trajectories in Cr+PCr, Glu+Gln, NAA, Tau, and choline-containing compounds, indicating that common patterns of developmental change may occur across species (40).
Collectively, our findings demonstrate that longitudinal in vivo MRS can reveal neurometabolic development spanning infancy to adulthood, with metabolite concentrations maturing at different rates over the course of rat brain development. This study examined three key developmental periods: neonatal, adolescent, and adult. Future work will need to provide a fuller characterization of metabolite changes during adolescence. Our findings reveal that Ins, Tau, and Cr+PCr achieve adult-like concentration levels by P35, while GPC+PCh, NAA+NAAG, and Glu+Gln concentrations exhibit continued developmental change between P35 and P60. Our data suggest that adolescence represents a phase of neurometabolite development distinct from both the neonate and the adult. Advanced understanding of lifespan neurometabolite profiles will significantly strengthen clinical applications of MRS to neurodevelopmental disorders. The ability to identify aberrant neurometabolite concentrations as well as deviations from normal maturational trajectories will optimize interpretations of clinical MRS findings in human development.
Supplementary Material
(A) Representative spectra from TR 1250, 2500, 3750, 5000, 6500, 8000 ms and (B) estimated T1 relaxation curves for each metabolite.
Acknowledgments
We would like to thank the reviewers for their critical comments that have significantly improved this manuscript. This work was supported by NIH HD050201, HD057488, the Harry O. Parker Neurosciences Research Fund, Wake Forest School of Medicine Venture Fund, and the Center for Biomolecular Imaging.
Abbreviations used
- MRS
magnetic resonance spectroscopy
- Ala
L-alanine
- Asp
aspartate
- Cr
creatine
- PCr
phosphocreatine
- GABA
γ-aminobutyric acid
- Glc
glucose
- Glu
glutamate
- Gln
glutamine
- GPC
glycerophosphocholine
- PCh
phosphocholine
- Ins
myo-Inositol
- Lac
L-lactate
- NAA
n-Acetylaspartate
- NAAG
n-acetylaspartylglutamate
- Tau
taurine
- Scyllo
scyllo-inositol
- Gua
guanidinoacetate
- PCA
principle components analysis
- G
gestational day
- P
postnatal day
- ANOVA
analysis of variance
- FWHM
full width at half-maximum
- CRLB
Cramer-Rao lower bounds
- SD
standard deviation
References
- 1.Panigrahy A, Borzage M, Bluml S. Basic principles and concepts underlying recent advances in magnetic resonance imaging of the developing brain. Semin Perinatol. 2010;34:3–19. doi: 10.1053/j.semperi.2009.10.001. [DOI] [PMC free article] [PubMed] [Google Scholar]
- 2.Dobbing J, Sands J. Comparative aspects of the brain growth spurt. Early Hum Dev. 1979;3:79–83. doi: 10.1016/0378-3782(79)90022-7. [DOI] [PubMed] [Google Scholar]
- 3.Chung SM. Safety issues in magnetic resonance imaging. J Neuroophthalmol. 2002;22:35–39. doi: 10.1097/00041327-200203000-00009. [DOI] [PubMed] [Google Scholar]
- 4.Clancy B, Kersh B, Hyde J, Darlington RB, Anand KJ, Finlay BL. Web-based method for translating neurodevelopment from laboratory species to humans. Neuroinformatics. 2007;5:79–94. doi: 10.1385/ni:5:1:79. [DOI] [PubMed] [Google Scholar]
- 5.Tkác I, Rao R, Georgieff MK, Gruetter R. Developmental and regional changes in the neurochemical profile of the rat brain determined by in vivo 1H NMR spectroscopy. Magn Reson Med. 2003;50 :24–32. doi: 10.1002/mrm.10497. [DOI] [PubMed] [Google Scholar]
- 6.Corbett RJ. In vivo multinuclear magnetic resonance spectroscopy investigations of cerebral development and metabolic encephalopathy using neonatal animal models. Semin Perinatol. 1990;14 :258–271. [PubMed] [Google Scholar]
- 7.Hida K, Kwee IL, Nakada T. In vivo 1H and 31P NMR spectroscopy of the developing rat brain. Magn Reson Med. 1992;23 :31–36. doi: 10.1002/mrm.1910230105. [DOI] [PubMed] [Google Scholar]
- 8.Agrawal HC, Davis JM, Himwich WA. Developmental changes in mouse brain: weight, water content and free amino acids. J Neurochem. 1968;15 :917–923. doi: 10.1111/j.1471-4159.1968.tb11633.x. [DOI] [PubMed] [Google Scholar]
- 9.Bates TE, Williams SR, Gadian DG, Bell JD, Small RK, Iles RA. 1H NMR study of cerebral development in the rat. NMR Biomed. 1989;2 :225–229. doi: 10.1002/nbm.1940020509. [DOI] [PubMed] [Google Scholar]
- 10.Behar KL, den Hollander JA, Stromski ME, Ogino T, Shulman RG, Petroff OA, Prichard JW. High-resolution 1H nuclear magnetic resonance study of cerebral hypoxia in vivo. Proc Natl Acad Sci U S A. 1983;80 :4945–4948. doi: 10.1073/pnas.80.16.4945. [DOI] [PMC free article] [PubMed] [Google Scholar]
- 11.Florian CL, Williams SR, Bhakoo KK, Noble MD. Regional and developmental variations in metabolite concentration in the rat brain and eye: a study using 1H NMR spectroscopy and high performance liquid chromatography. Neurochem Res. 1996;21:1065–1074. doi: 10.1007/BF02532417. [DOI] [PubMed] [Google Scholar]
- 12.Spear LP, Brake SC. Periadolescence: age-dependent behavior and psychopharmacological responsivity in rats. Dev Psychobiol. 1983;16 :83–109. doi: 10.1002/dev.420160203. [DOI] [PubMed] [Google Scholar]
- 13.Kennedy GC. Ontogeny of mechanisms controlling food and water intake. In: Code CF, editor. Handbook of physiology: alimentary canal, Food and water intake. American Physiological Society; Washington, DC: 1967. pp. 337–352. [Google Scholar]
- 14.Spear LP. The adolescent brain and age-related behavioral manifestations. Neurosci Biobehav Rev. 2000;24 :417–463. doi: 10.1016/s0149-7634(00)00014-2. [DOI] [PubMed] [Google Scholar]
- 15.World Health Organization. Ten facts on adolescent health. <. http://who.int/features/factfiles/adolescent_health/en/index.html>.
- 16.Bourgeois JP, Goldman-Rakic PS, Rakic P. Synaptogenesis in the prefrontal cortex of rhesus monkeys. Cereb Cortex. 1994;4 :78–96. doi: 10.1093/cercor/4.1.78. [DOI] [PubMed] [Google Scholar]
- 17.Markham JA, Morris JR, Juraska JM. Neuron number decreases in the rat ventral, but not dorsal, medial prefrontal cortex between adolescence and adulthood. Neuroscience. 2007;144 :961–968. doi: 10.1016/j.neuroscience.2006.10.015. [DOI] [PubMed] [Google Scholar]
- 18.He J, Crews FT. Neurogenesis decreases during brain maturation from adolescence to adulthood. Pharmacol Biochem Behav. 2007;86 :327–333. doi: 10.1016/j.pbb.2006.11.003. [DOI] [PubMed] [Google Scholar]
- 19.Crews F, He J, Hodge C. Adolescent cortical development: a critical period of vulnerability for addiction. Pharmacol Biochem Behav. 2007;86 :189–199. doi: 10.1016/j.pbb.2006.12.001. [DOI] [PMC free article] [PubMed] [Google Scholar]
- 20.Lebel C, Gee M, Camicioli R, Wieler M, Martin W, Beaulieu C. Diffusion tensor imaging of white matter tract evolution over the lifespan. Neuroimage. 2011;60 :340–352. doi: 10.1016/j.neuroimage.2011.11.094. [DOI] [PubMed] [Google Scholar]
- 21.Chugani HT, Phelps ME, Mazziotta JC. Positron emission tomography study of human brain functional development. Ann Neurol. 1987;22 :487–497. doi: 10.1002/ana.410220408. [DOI] [PubMed] [Google Scholar]
- 22.Atwood T, Payne VS, Zhao W, Brown WR, Wheeler KT, Zhu JM, Robbins ME. Quantitative magnetic resonance spectroscopy reveals a potential relationship between radiation-induced changes in rat brain metabolites and cognitive impairment. Radiat Res. 2007;168 :574–581. doi: 10.1667/RR0735.1. [DOI] [PubMed] [Google Scholar]
- 23.Atwood T, Robbins ME, Zhu JM. Quantitative in vivo proton MR spectroscopic evaluation of the irradiated rat brain. J Magn Reson Imaging. 2007;26 :1590–1595. doi: 10.1002/jmri.21095. [DOI] [PubMed] [Google Scholar]
- 24.Garcia-Espinosa MA, Shaltout HA, Olson J, Westwood BM, Robbins ME, Link K, Diz DI. Proton magnetic resonance spectroscopy detection of neurotransmitters in dorsomedial medulla correlate with spontaneous baroreceptor reflex function. Hypertension. 2010;55 :487–493. doi: 10.1161/HYPERTENSIONAHA.109.145722. [DOI] [PMC free article] [PubMed] [Google Scholar]
- 25.Shi L, Olson J, D’Agostino R, Jr, Linville C, Nicolle MM, Robbins ME, Wheeler KT, Brunso-Bechtold JK. Aging masks detection of radiation-induced brain injury. Brain Res. 2011;1385 :307–316. doi: 10.1016/j.brainres.2011.02.034. [DOI] [PMC free article] [PubMed] [Google Scholar]
- 26.Ewald AJ, Werb Z, Egeblad M. Monitoring of vital signs for long-term survival of mice under anesthesia. Cold Spring Harb Protoc. 2012;2011 doi: 10.1101/pdb.prot5563. [DOI] [PMC free article] [PubMed] [Google Scholar]
- 27.Romanovsky AA, Ivanov AI, Shimansky YP. Selected contribution: ambient temperature for experiments in rats: a new method for determining the zone of thermal neutrality. J Appl Physiol. 2002;92 :2667–2679. doi: 10.1152/japplphysiol.01173.2001. [DOI] [PubMed] [Google Scholar]
- 28.Gruetter R. Automatic, localized in vivo adjustment of all first- and second-order shim coils. Magn Reson Med. 1993;29 :804–811. doi: 10.1002/mrm.1910290613. [DOI] [PubMed] [Google Scholar]
- 29.Tkác I, Starcuk Z, Choi IY, Gruetter R. In vivo 1H NMR spectroscopy of rat brain at 1 ms echo time. Magn Reson Med. 1999;50 :649–656. doi: 10.1002/(sici)1522-2594(199904)41:4<649::aid-mrm2>3.0.co;2-g. [DOI] [PubMed] [Google Scholar]
- 30.Provencher SW. Estimation of metabolite concentrations from localized in vivo proton NMR spectra. Magn Reson Med. 1993;30 :672–679. doi: 10.1002/mrm.1910300604. [DOI] [PubMed] [Google Scholar]
- 31.Provencher SW. Automatic quantitation of localized in vivo 1H spectra with LCModel. NMR Biomed. 2001;14 :260–264. doi: 10.1002/nbm.698. [DOI] [PubMed] [Google Scholar]
- 32.De Souza SW, Dobbing J. Cerebral edema in developing brain. I. Normal water and cation content in developing rat brain and postmortem changes. Exp Neurol. 1971;32 :431–438. doi: 10.1016/0014-4886(71)90009-4. [DOI] [PubMed] [Google Scholar]
- 33.Kreis R, Ernst T, Ross BD. Development of the human brain: in vivo quantification of metabolite and water content with proton magnetic resonance spectroscopy. Magn Reson Med. 1993;30 :424–437. doi: 10.1002/mrm.1910300405. [DOI] [PubMed] [Google Scholar]
- 34.Terpstra M, Ugurbil K, Tkác I. Noninvasive quantification of human brain ascorbate concentration using 1H NMR spectroscopy at 7 T. NMR Biomed. 2010;23 :227–232. doi: 10.1002/nbm.1423. [DOI] [PMC free article] [PubMed] [Google Scholar]
- 35.Cavassila S, Deval S, Huegen C, van Ormondt D, Graveron-Demilly D. Cramer-Rao bounds: an evaluation tool for quantitation. NMR Biomed. 2001;14 :278–283. doi: 10.1002/nbm.701. [DOI] [PubMed] [Google Scholar]
- 36.Xia J, Psychogios N, Young N, Wishart DS. MetaboAnalyst: a web server for metabolomic data analysis and interpretation. Nucleic Acids Res. 2009;(Web Server issue):W652–W660. doi: 10.1093/nar/gkp356. [DOI] [PMC free article] [PubMed] [Google Scholar]
- 37.Connelly A, Jackson GD, Duncan JS, King MD, Gadian DG. Magnetic resonance spectroscopy in temporal lobe epilepsy. Neurology. 1994;44 :1411–1417. doi: 10.1212/wnl.44.8.1411. [DOI] [PubMed] [Google Scholar]
- 38.Iltis I, Hutter D, Bushara KO, Clark HB, Gross M, Eberly LE, Gomez CM, Oz G. (1)H MR spectroscopy in Friedreich’s ataxia and ataxia with oculomotor apraxia type 2. Brain Res. 2010;1358 :200–210. doi: 10.1016/j.brainres.2010.08.030. [DOI] [PMC free article] [PubMed] [Google Scholar]
- 39.Soliva JC, Moreno A, Fauquet J, Bielsa A, Carmona S, Gispert JD, Rovira M, Bulbena A, Vilarroya O. Cerebellar neurometabolite abnormalities in pediatric attention/deficit hyperactivity disorder: a proton MR spectroscopic study. Neurosci Lett. 2010;470 :60–64. doi: 10.1016/j.neulet.2009.12.056. [DOI] [PubMed] [Google Scholar]
- 40.Larvaron P, Bielicki G, Boespflug-Tanguy O, Renou J-P. Proton MRS of early post-natal mouse brain modifications in vivo. NMR Biomed. 2006;19 :180–187. doi: 10.1002/nbm.997. [DOI] [PubMed] [Google Scholar]
- 41.Burton LE, Ray RE, Bradford JR, Orr JP, Nickerson JA, Wells WW. myo-Inositol metabolism in the neonatal and developing rat fed a myo-inositol-free diet. J Nutr. 1976;106 :1610–1616. doi: 10.1093/jn/106.11.1610. [DOI] [PubMed] [Google Scholar]
- 42.Ward KL, Tkác I, Jing Y, Felt B, Beard J, Connor J, Schallert T, Georgieff MK, Rao R. Gestational and lactational iron deficiency alters the developing striatal metabolome and associated behaviors in young rats. J Nutr. 2007;137 :1043–1049. doi: 10.1093/jn/137.4.1043. [DOI] [PMC free article] [PubMed] [Google Scholar]
- 43.Oja SS, Uusitalo AJ, Vahvelainen ML, Piha RS. Changes in cerebral and hepatic amino acids in the rat and guinea pig during development. Brain Res. 1968;11 :655–661. doi: 10.1016/0006-8993(68)90153-4. [DOI] [PubMed] [Google Scholar]
- 44.Bayer SM, McMurray WC. The metabolism of amino acids in developing rat brain. J Neurochem. 1967;2 :695–706. doi: 10.1111/j.1471-4159.1967.tb10303.x. [DOI] [PubMed] [Google Scholar]
- 45.Wang J, Jiang L, Jiang Y, Ma X, Chowdhury GM, Mason GF. Regional metabolite levels and turnover in the awake rat brain under the influence of nicotine. J Neurochem. 2010;113 :1447–1458. doi: 10.1111/j.1471-4159.2010.06684.x. [DOI] [PMC free article] [PubMed] [Google Scholar]
- 46.Perrine SA, Ghoddoussi F, Michaels MS, Hyde EM, Kuhn DM, Galloway MP. MDMA administration decreases serotonin but not N-acetylaspartate in the rat brain. Neurotoxicology. 2010;31 :654–661. doi: 10.1016/j.neuro.2010.08.005. [DOI] [PMC free article] [PubMed] [Google Scholar]
- 47.Du F, Zhang Y, Iltis I, Marjanska M, Zhu XH, Henry PG, Chen W. In vivo proton MRS to quantify anesthetic effects of pentobarbital on cerebral metabolism and brain activity in rat. Magn Reson Med. 2009;62 :1385–1393. doi: 10.1002/mrm.22146. [DOI] [PMC free article] [PubMed] [Google Scholar]
- 48.Burri R, Bigler P, Straehl P, Posse S, Colombo JP, Herschkowitz N. Brain development: 1H magnetic resonance spectroscopy of rat brain extracts compared with chromatographic methods. Neurochem Res. 1990;15 :1009–1016. doi: 10.1007/BF00965747. [DOI] [PubMed] [Google Scholar]
- 49.Koller KJ, Coyle JT. Ontogenesis of N-acetyl-aspartate and N-acetyl-aspartyl-glutamate in rat brain. Brain Res. 1984;317 :137–140. doi: 10.1016/0165-3806(84)90150-0. [DOI] [PubMed] [Google Scholar]
- 50.Xin L, Gambarota G, Mlynárik V, Gruetter R. Proton T2 relaxation time of J-coupled cerebral metabolites in rat brain at 9.4 T. NMR Biomed. 2008;21 :396–401. doi: 10.1002/nbm.1205. [DOI] [PubMed] [Google Scholar]
- 51.Pfeuffer J, Tkác I, Provencher SW, Gruetter R. Toward an in vivo neurochemical profile: quantification of 18 metabolites in short-echo-time (1)H NMR spectra of the rat brain. J Magn Reson. 1999;141 :104–120. doi: 10.1006/jmre.1999.1895. [DOI] [PubMed] [Google Scholar]
- 52.de Graaf RA, Brown PB, McIntyre S, Nixon TW, Behar KL, Rothman DL. High magnetic field water and metabolite proton T1 and T2 relaxation in rat brain in vivo. Magn Reson Med. 2006;56 :386–394. doi: 10.1002/mrm.20946. [DOI] [PubMed] [Google Scholar]
- 53.Nadler JV, Cooper JR. Metabolism of the aspartyl moiety of N-acetyl-L-aspartic acid in the rat brain. J Neurochem. 1972;19 :2091–2105. doi: 10.1111/j.1471-4159.1972.tb05119.x. [DOI] [PubMed] [Google Scholar]
- 54.Mountford CE, Stanwell P, Lin A, Ramadan S, Ross B. Neurospectroscopy: the past, present and future. Chem Rev. 2010;110 :3060–3086. doi: 10.1021/cr900250y. [DOI] [PubMed] [Google Scholar]
- 55.Moffett JR, Ross B, Arun P, Madhavarao CN, Namboodiri AM. N-Acetylaspartate in the CNS: from neurodiagnostics to neurobiology. Prog Neurobiol. 2007;81 :89–131. doi: 10.1016/j.pneurobio.2006.12.003. [DOI] [PMC free article] [PubMed] [Google Scholar]
- 56.Urenjak J, Williams SR, Gadian DG, Noble M. Proton nuclear magnetic resonance spectroscopy unambiguously identifies different neural cell types. J Neurosci. 1993;13 :981–989. doi: 10.1523/JNEUROSCI.13-03-00981.1993. [DOI] [PMC free article] [PubMed] [Google Scholar]
- 57.Urenjak J, Williams SR, Gadian DG, Noble M. Specific expression of N-acetylaspartate in neurons, oligodendrocyte-type-2 astrocyte progenitors, and immature oligodendrocytes in vitro. J Neurochem. 1992;59 :55–61. doi: 10.1111/j.1471-4159.1992.tb08875.x. [DOI] [PubMed] [Google Scholar]
- 58.Chakraborty G, Mekala P, Yahya D, Wu G, Ledeen RW. Intraneuronal N-acetylaspartate supplies acetyl groups for myelin lipid synthesis: evidence for myelin-associated aspartoacylase. J Neurochem. 2001;78 :736–745. doi: 10.1046/j.1471-4159.2001.00456.x. [DOI] [PubMed] [Google Scholar]
- 59.Brand A, Richter-Landsberg C, Leibfritz D. Multinuclear NMR studies on the energy metabolism of glial and neuronal cells. Dev Neurosci. 1993;15 :289–298. doi: 10.1159/000111347. [DOI] [PubMed] [Google Scholar]
- 60.Sturrock A, Laule C, Decolongon J, Dar Santos R, Coleman AJ, Creighton S, Bechtel N, Reilmann R, Hayden MR, Tabrizi SJ, Mackay AL, Leavitt BR. Magnetic resonance spectroscopy biomarkers in premanifest and early Huntington disease. Neurology. 2010;75 :1702–1710. doi: 10.1212/WNL.0b013e3181fc27e4. [DOI] [PMC free article] [PubMed] [Google Scholar]
- 61.Moats RA, Ernst T, Shonk TK, Ross BD. Abnormal cerebral metabolite concentrations in patients with probable Alzheimer disease. Magn Reson Med. 1994;32:110–115. doi: 10.1002/mrm.1910320115. [DOI] [PubMed] [Google Scholar]
- 62.Griffith HR, den Hollander JA, Okonkwo OC, O’Brien T, Watts RL, Marson DC. Brain metabolism differs in Alzheimer’s disease and Parkinson’s disease dementia. Alzheimer’s Dementia. 2008;4 :421–427. doi: 10.1016/j.jalz.2008.04.008. [DOI] [PMC free article] [PubMed] [Google Scholar]
- 63.Skoff RP, Knapp PE. Division of astroblasts and oligodendroblasts in postnatal rodent brain: evidence for separate astrocyte and oligodendrocyte lineages. Glia. 1991;4 :165–174. doi: 10.1002/glia.440040208. [DOI] [PubMed] [Google Scholar]
- 64.Quarles RH, Macklin WB, Morell P. Myelin formation, structure and biochemistry. In: Siegel GJ, Albers RW, Brady ST, Price DL, editors. Basic Neurochemistry: Molecular, Cellular, and Medical Aspects. Elsevier; New York: 2006. pp. 51–71. [Google Scholar]
- 65.Pouwels PJ, Brockmann K, Kruse B, Wilken B, Wick M, Hanefeld F, Frahm J. Regional age dependence of human brain metabolites from infancy to adulthood as detected by quantitative localized proton MRS. Pediatr Res. 1999;46 :474–485. doi: 10.1203/00006450-199910000-00019. [DOI] [PubMed] [Google Scholar]
- 66.Caudill MA. Pre- and postnatal health: evidence of increased choline needs. J Am Diet Assoc. 2010;110 :1198–1206. doi: 10.1016/j.jada.2010.05.009. [DOI] [PubMed] [Google Scholar]
- 67.Aerts L, Van Assche FA. Taurine and taurine-deficiency in the perinatal period. J Perinat Med. 2002;30 :281–286. doi: 10.1515/JPM.2002.040. [DOI] [PubMed] [Google Scholar]
- 68.Fagerlund A, Heikkinen S, utti-Ramo I, Korkman M, Timonen M, Kuusi T, Riley EP, Lundbom N. Brain metabolic alterations in adolescents and young adults with fetal alcohol spectrum disorders. Alcohol Clin Exp Res. 2006;30 :2097–2104. doi: 10.1111/j.1530-0277.2006.00257.x. [DOI] [PubMed] [Google Scholar]
- 69.Wang XC, Du XX, Tian Q, Wang JZ. Correlation between choline signal intensity and acetylcholine level in different brain regions of rat. Neurochem Res. 2008;33 :814–819. doi: 10.1007/s11064-007-9509-4. [DOI] [PubMed] [Google Scholar]
Associated Data
This section collects any data citations, data availability statements, or supplementary materials included in this article.
Supplementary Materials
(A) Representative spectra from TR 1250, 2500, 3750, 5000, 6500, 8000 ms and (B) estimated T1 relaxation curves for each metabolite.