

Abstract
The CodY protein is a global transcriptional regulator that controls, directly or indirectly, expression of more than 100 genes and operons in Bacillus subtilis. We used in vitro DNA affinity purification combined with massively parallel sequencing, to identify B. subtilis chromosomal DNA fragments that bind CodY in vitro. A nonstandard strand-specific analysis of the data allowed us to pinpoint CodY-binding sites at single-nucleotide resolution. By comparing the extent of binding at decreasing CodY concentrations, we were able to classify binding regions according to their relative strengths and construct a subset of the 323 strongest CodY-binding regions that included sites associated with nearly all genes reported to be direct CodY targets. Many of the identified sites were located within coding regions. At such sites within the ispA, rapA, and rapE genes CodY-dependent repression was demonstrated using lacZ fusions and mutational analysis.
CodY is a dimeric 259-residue Bacillus subtilis protein that binds to DNA through a winged helix-turn-helix domain (1) and acts as a global transcriptional regulator to control expression of many metabolic genes (2–5). The DNA-binding activity of CodY is enhanced by interaction with two types of effectors, branched-chain amino acids [isoleucine, leucine, and valine (ILV)] (6, 7) and GTP (3, 7–9). CodY binding requires the presence of a 15-nt canonical consensus motif, AATTTTCWGAAAATT (10–12). CodY regulates transcription by at least four different mechanisms (13): negative or positive regulation by binding within or near a promoter site, negative regulation by interfering with the binding of a positive regulator, and negative regulation by acting as a roadblock to RNA polymerase. CodY homologs are present in most other low G + C Gram-positive bacteria and have been shown to play a global role in metabolic regulation and in coordinating expression of virulence-associated and metabolic genes (5) (see also refs. 14 and 15 and references therein).
Multiple direct and indirect targets of CodY have been detected previously in microarray and ChIP-to-chip experiments (3). However, the exact relationship between the ability of CodY to bind at a particular site and its ability to exert regulation at that site remains unknown. ChIP-to-chip experiments revealed extended regions of protein binding at a global level, but did not pinpoint binding sites, i.e., sequences that directly contribute to CodY binding. The boundaries of binding sites are generally determined by other methods, such as DNase I footprinting, one gene at a time. In the present work, we have identified, in most cases at single-nucleotide resolution, virtually all sites within the B. subtilis chromosome to which CodY is able to bind in vitro. By varying the concentration of CodY, we were also able to classify the CodY-binding regions with respect to their relative strength of binding. Although half of CodY-binding sites were in intergenic regions, a surprising number of the sites were located within coding regions. CodY binding to three different “internal” sites prevented expression of the genes via a roadblock mechanism.
Results
Genome-Scale Identification of B. subtilis CodY-Binding Regions in Vitro.
The method of genome-wide identification of protein-binding regions in vitro, which we call here in vitro DNA affinity purification sequencing (IDAP-Seq), has been successfully applied previously for identification of CodY-binding regions in Staphylococcus aureus, Clostridium difficile, and Bacillus anthracis (16–18). The CodY–DNA complexes formed by incubation of fragmented, adapter-ligated chromosomal DNA with purified His-tagged CodY are isolated using immobilized metal-ion affinity purification. The CodY-binding fragments are released from the complexes by incubation with proteinase K, amplified by PCR using adapter-specific primers, and subjected to sequencing en masse. Analysis of the resulting genome coverage maps allows identification of hundreds of peaks associated with CodY-binding regions across an entire genome. The method resembles a single-cycle genomic SELEX experiment (19, 20) combined with massively parallel sequencing.
We have used a similar approach (Materials and Methods) to isolate and sequence fragments (∼150–200 nt) of B. subtilis chromosomal DNA that interact with purified B. subtilis CodY, but varied the CodY concentration from 0.32 nM to 5 µM, to identify all binding regions and distinguish among regions of different strengths. To be considered as a binding region, a sequence needed to have at least threefold higher-than-average coverage over at least 61 consecutive nucleotides.
In a genome-wide binding experiment, three factors come into play: affinity of a DNA region for CodY, competition among fragments, and stoichiometry of CodY and DNA [we used 30-nM DNA fragments for the initial purifications and 3 nM for reiterative purifications (see below)]. At a given CodY concentration, affinity should be the primary determinant of binding strength to a particular region if the protein concentration is significantly higher than the concentration of binding regions; at lower ratios of protein to DNA, competition becomes a more important determinant of binding to a given region. As a result, only a limited number of high-affinity regions should be recovered at very low protein concentrations. In fact, only eight such regions with a binding strength >0.0001 (as defined by the fraction of the number of sequencing reads attributed to each region among the total number of reads for recovered DNA) were recovered at 1.6 nM CodY and only one region (associated with the ybgE gene) was recovered at 0.32 nM CodY (Dataset S1 A and B). By contrast, at 1 or 5 µM CodY, i.e., concentrations that are likely much higher than the apparent dissociation constant (KD) for physiologically relevant binding sites, more than 1,000 binding regions, most of them very weak, were identified. In fact, the CodY-binding regions appeared to form a continuum of regions of various strengths (the list of all 1,757 regions is presented in Dataset S2).
Because many of the weaker regions detected in vitro may not have physiological significance, we arbitrarily selected for further analysis a subset consisting of the 323 strongest CodY-binding regions, as defined by the maximal strength of each region in all IDAP-Seq experiments performed at CodY concentrations ≤200 nM (Dataset S1A). The correlation between this subset and the list of known CodY-regulated target genes or operons, based on the results of microarray experiments, is shown in Table 1. Forty-seven of 75 negatively regulated targets and 10 of 27 positively regulated targets are associated with CodY-binding regions.
Table 1.
Correlation between CodY-regulated genes and operons and CodY-binding regions
| Level of regulation | No. of genes or operons identified by microarray* | No. of corresponding regions identified by IDAP-Seq |
| Negative regulation | ||
| ≥10-fold | 21 | 18 |
| 5- to 10-fold | 14 | 12 |
| 3- to 5-fold | 40 | 17 |
| Positive regulation | ||
| ≥10-fold | 2 | 1 |
| 5- to 10-fold | 6 | 2 |
| 3- to 5-fold | 19 | 7 |
Ref. 4. See also Dataset S3.
The 323-region subset also includes regulatory regions for ten additional genes (rapA, citB, ackA, ywfH, comK, srfAA, acsA, gabP, gabT, and gltT) that have been shown to be under CodY control using approaches other than microarray analysis (Dataset S3). Thus, evidence of in vivo CodY-dependent regulation is available for 66 of 323 selected regions (Dataset S3).
About 90 CodY-binding regions were associated with genes of nitrogen metabolism, consistent with the observation that the activity of CodY is greatest in cells grown in the presence of excess amino acids. In addition, about 20 CodY-binding regions appear to be involved in regulation of other transcription factors, potentially extending the effect of CodY-mediated regulation to multiple biochemical pathways and environmental responses (Dataset S1A).
ChIP-to-chip experiments revealed 66 extended regions of CodY binding in vivo (3) (31 of which correspond to genes and operons regulated by CodY in vivo). Sixty-two of these 66 regions could be found in the subset of 323 strong CodY-binding regions identified by IDAP-Seq. We found no binding regions corresponding to the yqgA and yqiYZ (artQR) loci; the binding regions for rok and yrhH fell just below our arbitrary cutoff. We were also unable to identify CodY-binding regions that were associated with three genes, hag, flgB, and bsrF, previously reported to be under direct CodY control (21, 22), indicating that these genes are not able to bind CodY in our strain.
In summary, the 323-region subset includes 97 of the 147 regions that are associated with either in vivo binding or regulation or both; it also includes 26 of 29 regions associated with genes for which direct CodY-dependent regulation was validated. Nonetheless, it is obvious that this subset is much larger than the number of CodY-regulated target genes or operons identified by in vivo transcription assays or the number of CodY-binding regions found in the ChIP-to-chip experiments. There are several possible explanations for this result. First, the IDAP-Seq approach is more sensitive than a ChIP-to-chip experiment. Second, CodY binding to some regions detected by IDAP-Seq may have little or no effect on regulation in vivo. In fact, we detected only twofold or less CodY-dependent in vivo regulation of the ald-, azlB-, codV-, glnR-, odhA-, oppA-, and pdxS-lacZ fusions (Table S1), even though all of the corresponding regulatory regions could bind CodY (Dataset S1A and see below). Third, binding of CodY to some regions in vivo and CodY-dependent regulation of some genes may be masked under certain conditions by the presence or absence of other regulators.
Reiterative Affinity Purification.
To improve the resolution power of our experiments in terms of relative CodY-binding strengths of different DNA regions, we used a genomic SELEX-like approach (19, 20, 23) by performing up to five successive rounds of IDAP at 1.6 nM or 200 nM CodY using the PCR-amplified output of the previous round as the input for the next round (Dataset S1 A, C, and D). Our reasoning was that DNA fragments carrying stronger binding regions would outcompete other fragments in forming CodY–DNA complexes. This should cause overrepresentation of stronger binding fragments in the output of each successive round of IDAP, resulting theoretically in the identification of the strongest binding fragment(s). Indeed, after four IDAP cycles using 1.6 nM CodY, the fraction of reads corresponding to the ybgE region exceeded 70%, apparently indicating that this is the strongest CodY-binding region in the B. subtilis genome (Dataset S1D). The ybgE gene encodes a branched-chain amino acid aminotransferase (24, 25).
Ranking of CodY-Binding Regions.
A unique advantage of the IDAP experimental set-up is the ability to determine relative strengths of CodY binding of individual chromosomal regions under conditions of varying CodY concentrations and genome-scale competition with all other CodY-binding regions. After one round of IDAP, the strongest regions achieved the maximal strength at 8 nM CodY, i.e., at a concentration at which the least strong regions could not bind CodY (Fig. 1). The maximal strength and the corresponding ranking of each region achieved under any of the conditions used in our IDAP experiments are listed in Dataset S1A. Interestingly, the ranking of some regions varied in experiments performed at different CodY/DNA ratios (Dataset S1B). At least three classes of regions were detected with respect to such variability. The rankings of some regions increased with the increase in the CodY/DNA ratio, suggesting that their binding sites are of relatively low affinity and that binding depends on a high degree of cooperativity. Cooperative binding of CodY to DNA has been detected for many genes (13, 26). The rankings of other regions decreased with the increase in the CodY/DNA ratio, suggesting that they have relatively high affinity and that binding has a lower level of cooperativity and can be competed effectively by other sequences when the CodY concentration increases. For the third group of regions, the rankings stayed more or less constant.
Fig. 1.
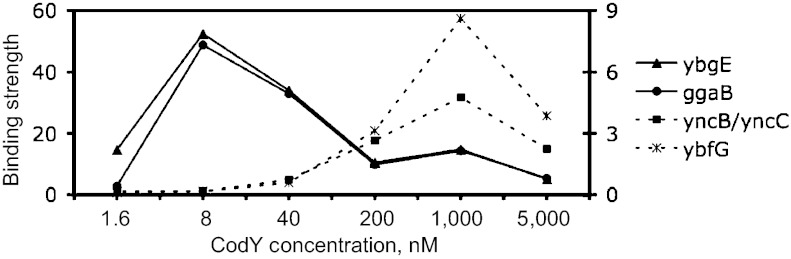
Dependence of region strength on CodY concentration. The binding strengths of the two strongest regions, ybgE and ggaB, and the two regions ranked 301 and 302, yncB/yncC and ybfG (Dataset S1B), are shown on the Left and Right y axis, respectively.
Importantly, the changes in relative strengths of CodY-binding regions observed in IDAP-Seq experiments with different CodY concentrations are likely to correlate with changes in relative expression levels of the target genes under conditions of varying CodY activities in vivo. For example, the ybgE gene, which is associated with the strongest CodY-binding region, is one of a few genes that is efficiently repressed even under conditions of low CodY activity (27).
Identification of CodY-Binding Sites at Single-Nucleotide Resolution.
The conventional method of defining protein-binding regions by IDAP-Seq, ChIP-Seq, and similar approaches is based on counting all nucleotides of all reads and finding regions for which the average number of reads per nucleotide is above the baseline. This approach can define binding regions and approximate locations of binding peaks, but obscures the exact positions of the binding sites, i.e., sequences that are directly involved in protein binding. A unique approach that created strand-specific coverage maps by counting only the 5′ nucleotide of each sequenced DNA fragment allowed us to manually identify in vitro binding sites at single-nucleotide resolution. (Note that the 50-nt sequence obtained for each fragment allows that fragment to be localized to the genome, thereby identifying the exact position of the 5′ nucleotide.)
As shown in Fig. 2 A–C, each simple CodY-binding site, reading left to right, is surrounded by a sequence with a high number of reads at each position on the top strand and a nonoverlapping sequence with a high number of reads on the bottom strand. A zone of few or no reads on either strand separates the two zones of high reads and corresponds to the sequence of the binding site, because fragments lacking even a single base pair that is essential for CodY binding would not be able to interact with CodY, and therefore the corresponding 5′ nucleotides are represented minimally or not at all in the coverage of either DNA strand. The gap in coverage on both DNA strands together with its boundary nucleotides on each side is referred to here as the core of the binding site (Fig. 2C). It is possible that several additional nucleotides on either side of the core are required to form a site fully competent for binding.
Fig. 2.

Diagrams illustrating the strand-specific counting of Illumina reads for fragments containing binding sites for a DNA-binding protein. Alignment of (+) strand reads (A) and (−) strand reads (B) with a genome sequence containing an idealized 16-nt binding site (black rectangle). All fragments are shown to be of a uniform 60-nt size. The 5′ nucleotides are depicted as circles, which are filled for fragments that include the entire binding site. (C) Strand-specific coverage map generated by counting only the 5′ nucleotide of each Illumina read. The coverage of the (+) and (−) strands is shown in gray and black, respectively. The final abundance of each fragment that copurifies with the binding protein was assumed to be 20; the abundance of fragments that do not contain the protein-binding site was assumed to be zero.
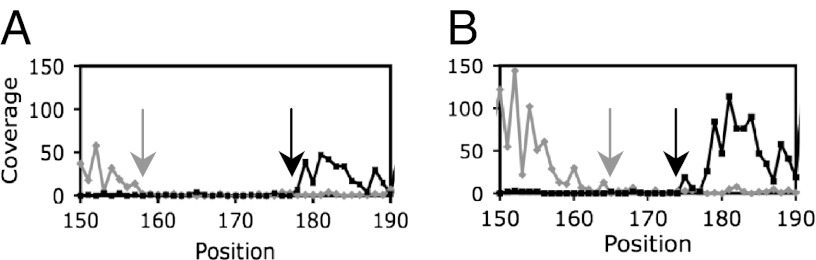
An example of the actual results of our analysis is shown in Fig. 3 A and B for the 380-nt associated with the frlB (formerly, yurP) gene binding region. Sharp drops in the coverage were observed both for the (+) and (−) strands, with a gap of 8 nt between the two drops. We conclude that the 8 nt at positions 173–180 are essential for CodY binding, but also anticipate that the nucleotides at positions 171–172 and 181–185 (with reduced coverage) are likely to contribute to CodY binding. These 8–15 nt plus one flanking nucleotide on either side of the gap constitute the core of the frlB CodY-binding site. Similar results can be seen for the rapA or rapE genes (Fig. S1 A–D).
Fig. 3.

Coverage maps of frlB (A and B) and bcaP (C–F) CodY-binding regions using strand-specific counting of 5′ nucleotides. The coverage of the (+) and (−) strands is shown in gray and black, respectively. (A, B, E, and F) 40 nM CodY was used for affinity purification of DNA fragments. (C and D) 8 nM CodY was used. Arrows indicate a gap in coverage (A), gap boundaries (B and F), or drops in coverage (C and D). Only coverage of the (+) strand can be seen in E. Nonuniform coverage is likely due to varying position-specific efficiency of DNA shearing during sonication and to nonuniform size of DNA fragments.
Table 2 lists core binding sites of the strongest CodY-binding regions in the B. subtilis genome. The length of the core sequences for all CodY-binding sites varied from 7 to 38 nt; 95% of the sequences were 11–29 nt in length (Dataset S1A). In all 17 cases, in which CodY-binding sites were mapped both by IDAP-Seq and DNase I footprinting or mutational analysis the positions of those sites overlapped (Dataset S3).
Table 2.
CodY-binding sites of the strongest binding regions identified by IDAP-Seq
| Putative target gene(s) | Site start | Site end | Site length (nt) | Site location with respect to target gene(s) |
| bcaP | ND | 1023179 | ND | Upstream |
| 1023296 | 1023311 | 16 | Upstream | |
| gcp/ydiF | ND | 644347 | ND | Downstream/downstream |
| 644425 | 644441 | 17 | Downstream/downstream | |
| ggaB | 3669784 | 3669800 | 17 | Internal |
| ispA | 1386336 | 1386351 | 16 | Internal |
| mntB/mntA | 3145191 | 3145209 | 19 | Upstream/internal |
| 3145428 | 3145443 | 16 | Internal | |
| purC | 701563 | 701582 | 20 | Upstream |
| rapA | 1316109 | 1316124 | 16 | Internal |
| trmFO/xerC | 1687094 | 1687112 | 19 | Internal/upstream |
| xkdB | 1322066 | 1322077 | 12 | Internal |
| ybeC | 231569 | 231587 | 19 | Internal |
| ybgE | ND | 258908 | ND | Upstream |
| 258968 | 258991 | 24 | Upstream | |
| yrdB | 2734366 | 2734380 | 15 | Upstream |
| yuiA | 3299878 | 3299893 | 16 | Upstream |
| yvdB | 3561523 | 3561540 | 18 | Internal |
| yvyD | 3631655 | 3631671 | 17 | Upstream |
See also Dataset S1A. Genes are presented alphabetically. A nearby gene is specified for some internal sites. Coordinates are specified according to the GenBank entry NC_000964.3. ND, site boundary and length could not be determined because of the presence of a nearby CodY-binding site.
Closely Spaced CodY-Binding Sites.
Manual inspection of CodY-binding regions from the 323-region dataset revealed that 30 of them contained two or three strong CodY-binding sites, separated by 5 to >200 nt. The ability of IDAP-Seq to fully resolve locations of closely spaced sites depends on the size of the DNA fragments used in the experiment. For example, the two sites of the nupG gene that are separated by >200 nt (13) were easily resolved (Fig. S1 E–G). The bcaP gene, however, has sites that are only ∼100 bp apart (27). When assayed at 40 nM CodY, only the downstream boundary (i.e., the drop in coverage on the bottom strand) could be determined for the upstream bcaP site (Fig. 3C and Fig. S2C) and only the upstream boundary (i.e., the drop in coverage on the top strand) could be determined for the downstream site (Fig. 3D and Fig. S2C). The region between the two boundaries detected for the closely spaced sites was characterized by overlapping coverage on both strands (Fig. S2). Interestingly, when assayed at 8 nM CodY, binding to only the downstream bcaP site was detected, forming a standard gap in coverage and allowing us to deduce the exact position of the site (Fig. 3 E and F). This is consistent with our observation that the downstream site has threefold higher affinity for CodY (KD = ∼3 nM) than the upstream site (28).
For two closely spaced sites of significantly different strengths, three of the four boundaries of the sites can be determined. Given the short length of core binding sites, even the availability of a single boundary did not compromise significantly the ability to locate the binding site. Moreover, in the case of the putB gene, two nearby CodY-binding sites identified by mutational analysis could not be resolved by DNase I footprinting experiments (13), but their existence was confirmed by IDAP-Seq and reflected in the 4- to 5-nt distance between the two boundaries that correspond to upstream and downstream core sites (Fig. S1 H and I).
CodY-Binding Motifs.
To analyze further the sequences of individual CodY-binding sites, we created another dataset consisting of 354 strong core sequences within the 323 CodY-binding regions and arbitrarily extended the sequence of each site by 20 nt at each end to allow for adjacent sequences to be included in the analysis.
An unbiased search for a common DNA motif on both strands of the dataset using the MEME motif-searching algorithm (29) yielded a 17-nt motif ATTTTCWGAAWWTTCWG (Fig. 4). The first 14 nt of the motif correspond to nucleotides 2–15 of the previously described canonical 15-nt CodY-binding consensus motif, AATTTTCWGAAAATT. The most conserved positions of the 14-nt sequence are in boldface. Interestingly, the last 9 nt (AAWWTTCWG) of the 17-nt motif correspond to the first 9 nt of a second copy of the canonical motif. This is reminiscent of a recently suggested model of a 24-nt CodY-binding site consisting of two 15-nt canonical motifs overlapping by 6 nt (26).
Fig. 4.
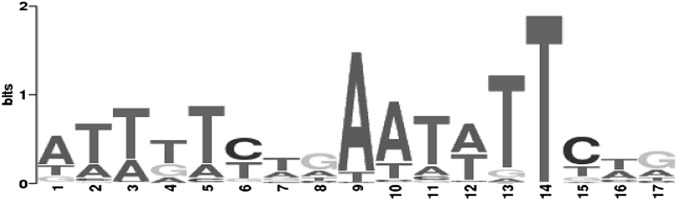
Motif logo for the 354 strongest CodY-binding sites. The logo was generated by the MEME function of the Galaxy suite.
The length of the core sequence for many sites was dependent on the concentration of CodY used. For example, the core sequence of the ylmA site was 22 nt when low concentrations of CodY were used, but only 12 nt when higher concentrations of CodY were used (Fig. 5). This result implies that the affinity of CodY for the minimal core sequence is too low to allow stable binding at low CodY concentrations unless the protein can interact also with additional nucleotides that extend the site or form another overlapping site(s). The observation that the core sequences of many CodY-binding sites are longer than 15 nt is consistent with the idea that sequences outside a single 15-nt canonical motif are involved in CodY binding.
Fig. 5.
Size dependence of the ylmA core binding site on the CodY concentration. (A) 8 nM CodY was used for affinity purification; (B) 40 nM CodY was used. The coverage of the (+) and (−) strands is shown in gray and black, respectively. Arrows indicate boundaries of the core binding site.
Although the B. subtilis chromosome does not contain even one sequence with perfect adherence to the canonical 15-nt CodY-binding consensus, the genome does contain 4, 53, and 361 sequences (418 total) that have one, two, or three mismatches to the consensus, respectively. However, the 354-site dataset only includes 1, 20, and 68 of such sites (89 sites total). The failure of the remaining 329 chromosomal 15-nt sequences with one, two, or three mismatches to bind CodY efficiently in vitro presumably means that certain mismatches are more deleterious than others or that the 15-nt canonical motif is not the only factor determining the affinity of CodY for DNA.
On the other hand, ∼150 actual binding sites overlap 15-nt motifs with four mismatches suggesting that a more degenerate version of the canonical motif can be an important component of a CodY-binding site (see Figs. S3 and S4 for further analysis of CodY-binding motifs).
Location of CodY-Binding Sites.
About 50% of the 354 CodY-binding sites identified by IDAP-Seq are located in putative regulatory regions upstream of the coding region of a gene (114 sites) or between two coding regions of divergent genes (64 sites) (Dataset S1). Sites from 53 of 66 regions that are associated with reported CodY-regulated genes (Dataset S3) belong to this group.
Eight sites were found in intergenic regions separating two convergent genes. Most surprising was the observation that 47% of CodY-binding sites were located within coding regions (168 internal sites). Other transcriptional regulators also have many binding sites within coding regions (30, 31). Given that our previous studies documented the ability of CodY to terminate transcription by binding within the 5′ untranslated region of a transcription unit (27), we decided to test whether binding deep within coding regions would also lead to repression of full-length transcript synthesis.
CodY-Dependent Regulation at Internal Sites.
The 891-bp ispA gene, encoding an intracellular serine protease (32), contains a core CodY-binding site, TCAGAATTTTCTAA, from positions 634–647 of the coding sequence (Fig. 6A and Dataset S1A) and a corresponding 15-nt canonical motif with three mismatches to the consensus from positions 629–643. The 1,137-bp rapA gene, encoding a Spo0F-P aspartate phosphatase (33), contains a core binding site, TTTCAGAATTGTTAGAAGACATCG, from positions 242–265 with a corresponding 15-nt motif with four mismatches from positions 239–253, and the 1,128-bp rapE gene, encoding a second Spo0F-P aspartate phosphatase (34), contains a core binding site, AACTTTCAGAATATTTAAA, from positions 224–242 with a corresponding 15-nt motif with two mismatches from positions 224–238 (Table S1).
Fig. 6.

Binding of CodY to the ispA gene. (A) Coverage map of the ispA CodY-binding region. 8 nM CodY was used for affinity purification. Arrows indicate a gap in coverage. (B) Gel mobility shift assay of CodY binding to a radioactively labeled ispA DNA fragment. (C) DNase I footprinting analysis of CodY binding to the ispA DNA fragment. The corresponding A + G sequencing ladder (40) is shown to the Left. The protected area is indicated by the vertical line and by the sequence; the core binding site identified by IDAP-Seq is in italicized boldface. CodY concentrations used (nM of monomer) are indicated below each lane.
We confirmed the identity and strength of the ispA site by gel-mobility shift and DNase I footprinting experiments. CodY bound with high affinity (apparent KD of ∼3 nM) to an ispA fragment (Fig. 6B) and protected a 30-nt site on the template DNA strand corresponding to positions 624–653 with respect to the ispA start codon and fully encompassing the core site detected by IDAP-Seq (Fig. 6C).
For each of the three genes, we constructed lacZ transcriptional fusions containing the entire intergenic region upstream of the coding sequence and a part of the coding region that included the CodY-binding site detected by IDAP-Seq (SI Materials and Methods). Under conditions of maximal CodY activity, in a glucose–ammonium minimal medium containing ILV and a mixture of 13 other amino acids, the ispA, rapA, and rapE fusions were repressed by CodY more than 100-, 5-, and 40-fold, respectively (Table 3).
Table 3.
Expression of lacZ fusions
| lacZ fusion | β-Galactosidase activity, MU (%) | |
| WT | codY | |
| ispA | 0.11 (0.9) | 12.3 (100) |
| ispAm1 | 7.99 (66) | 12.1 (100) |
| ispAp1 | 0.13 (0.9) | 14.4 (100) |
| rapA | 55.6 (19) | 296 (100) |
| rapAm1 | 159 (50) | 316 (100) |
| rapE | 0.05 (2.1) | 2.40 (100) |
| rapEm1 | 1.29 (52) | 2.50 (100) |
Cells were grown in glucose–ammonium medium with a mixture of ILV and 13 other amino acids. β-Galactosidase activity is expressed in Miller units (MU). CodY-dependent repression of rapA and rapE genes was previously detected in microarray experiments (3). β-Galactosidase activity of each fusion in a strain containing a codY null mutation was normalized to 100%.
To prove that CodY-binding sites detected in vitro and located within coding regions contribute to the observed CodY-dependent repression, we created additional fusions containing single mutations, labeled m1 in each case, in the conserved residue A10 of the canonical motif (shown above in boldface). Each of the mutations led to a nearly complete loss of CodY-dependent regulation (Table 3). Thus, the binding sites located within the coding regions of these three genes are indeed responsible for CodY-dependent repression.
IDAP-Seq revealed that another, weaker CodY binding site, ATATTTTGAAGATTACTAATTCT, is located in the intergenic region upstream of both the ispA gene and the divergently transcribed rsbRB gene (Table S1). This site overlaps a 15-nt CodY-binding canonical motif with three mismatches to the consensus. The p1 mutation, which affects the same residue A10 (in boldface) of the motif as mutations m1, did not have any effect on the expression of the ispA-lacZ fusion (Table 3). Thus, this site is unlikely to be involved in the CodY-dependent regulation of ispA.
Discussion
We report here two nonstandard approaches to understanding the relationship between regulatory protein binding sites and gene regulation. First, we showed that coupling of affinity purification of DNA–protein complexes to massively parallel sequencing permits genome-wide identification of virtually all binding regions. By varying the protein concentration during the purification step and by reiterative purification steps at a given protein concentration, one can distinguish among regions of different binding strength under conditions of genome-wide competition that mimic competition occurring in vivo. The resulting data can be used to define sequence motifs associated with strong and weak regions of binding, to identify the genes most likely to be regulated by the protein in question, and to predict the conditions under which a particular gene would be regulated. That is, the intracellular activity of a regulatory protein is determined by the concentration of molecules in the active conformation. Conditions that cause only a small fraction of the protein molecules to be active would allow regulation of only the genes with the strongest sites, whereas conditions that create a high concentration of the active conformation would allow weaker binding sites to be occupied.
Second, we provide a genome-wide method for identifying protein-binding sites in vitro at single-nucleotide resolution. Another single-nucleotide approach, ChIP-exo, has been described to analyze protein–DNA interactions in vivo (35). We predict that our approach can be used to identify precisely the DNA-binding sites of other proteins and can be especially useful for analysis of global regulators. Identification of binding sites in vitro is an important complement to identification of genes subject to regulation and their binding sites in vivo. Although detection of a binding site in vitro does not constitute evidence for regulation, the presence of a site identifies candidate targets for direct regulation and its absence makes direct regulation very unlikely. Moreover, any attempt to fully characterize binding sites in vivo can be complicated by the requirement for special growth conditions that may be needed for protein binding or regulation.
We have identified functional CodY-binding sites within the coding regions of three B. subtilis genes. All three sites appear to cause efficient repression of gene expression by a roadblock mechanism as described previously for CodY-binding sites located within 5′ untranslated regions (27). The presence of CodY-binding sites within the coding regions of many additional genes suggests that transcriptional roadblocking is a common mechanism of regulation by CodY. The physiological logic of regulatory protein-binding sites internal to coding sequences remains unclear. In addition to repressing the gene bearing the site, binding to some sites may affect transcription of genes by regulating as yet unidentified internal promoters or promoters of adjacent genes or by preventing read through from an upstream promoter into the downstream gene. The complexity of the B. subtilis transcriptome (36) is fully consistent with multiple possible functional roles for CodY-binding sites internal to coding sequences.
Materials and Methods
IDAP-Seq Procedure.
Construction of a fragmented chromosomal DNA library is described in SI Materials and Methods. One microgram of the amplified DNA fragments (∼30 nM) was incubated with varying concentrations of purified CodY-His5 (12) (0.32–5,000 nM) in 200 µL of binding buffer [20 mM Tris⋅Cl (pH 8.0) 50 mM KCl, 2 mM MgCl2, 5% (vol/vol) glycerol and 0.05% Nonidet P-40] in the presence of CodY effectors, ILV (10 mM each) and GTP (2 mM). After 20 min at room temperature, 20 µL of Ni2+-charged His⋅Bind resin (Novagen) was added and the CodY–DNA complexes were allowed to absorb to the resin with slight agitation for an additional 20 min at room temperature. The resin was collected by centrifugation at 50 × g for 30–60 s and washed four times with the binding buffer containing 10 mM ILV. The final pellet was resuspended in 100 µL of 20 mM Tris⋅Cl (pH 8.0) 1 mM CaCl2 with 1 µL of proteinase K (Sigma; P4850) and incubated at 37 °C for 2 h with occasional mixing. The resin was removed by centrifugation, and DNA was purified using the Qiagen PCR Purification kit. For each individual IDAP reaction, the purified fragments were amplified by PCR using one of the barcoded oligonucleotides from the olj527 to olj542 series as one primer and olj139 as a common primer. When reiterative rounds of IDAP were performed, 0.1 µg of the amplified DNA fragments from the preceding round (∼3 nM) and the same concentration of CodY were used.
Samples (0.6–5 nM in a total volume of 20 µL) of amplified DNA from each of the IDAP reactions as well as a sample of the original size-fractionated DNA library that was not incubated with CodY were subjected to massively parallel sequencing using the Illumina HiSeq2000 system under conditions of 16-fold multiplexing. A total of 145–200 million 50-nt reads were obtained from each sequencing well.
Analysis of IDAP-Seq Results.
The procedure to identify CodY-binding regions using the Galaxy suite (37) is described in SI Materials and Methods. Only 5′ nucleotides of each read were counted for coverage determination. CodY-binding sites were identified as described in the text by manual visual inspection of the original (no shifting and smoothing) strand-specific coverage of each individual CodY-binding region.
Bacterial Strains, Growth, and Assays.
All B. subtilis strains used in this study were derivatives of strain SMY (38) and are described in the text and in SI Materials and Methods. Cells were grown in TSS medium as described (28). β-Galactosidase specific activity was determined as described previously (39). Methods for common DNA manipulations, transformation, gel shift experiments, DNase I footprinting, and sequence analysis were as previously described (12, 28). All oligonucleotides used in this work are described in Table S2. Labeling of DNA fragments is described in SI Materials and Methods.
Supplementary Material
Acknowledgments
We thank David Lazinski for help with the design of DNA library construction, for multiple discussions, and for sharing the oligonucleotides; Kip Bodi for writing several scripts required for our analysis; and J. L. Smith and A. D. Grossman, who are using approaches similar to those described here to analyze the binding sites of B. subtilis DnaA protein, for helpful discussions. The research reported in this paper was supported by the National Institute of General Medical Sciences of the National Institutes of Health under Award R01 GM042219.
Footnotes
The authors declare no conflict of interest.
This article is a PNAS Direct Submission.
This article contains supporting information online at www.pnas.org/lookup/suppl/doi:10.1073/pnas.1300428110/-/DCSupplemental.
References
- 1.Levdikov VM, Blagova E, Joseph P, Sonenshein AL, Wilkinson AJ. The structure of CodY, a GTP- and isoleucine-responsive regulator of stationary phase and virulence in gram-positive bacteria. J Biol Chem. 2006;281(16):11366–11373. doi: 10.1074/jbc.M513015200. [DOI] [PubMed] [Google Scholar]
- 2.Fisher SH. Regulation of nitrogen metabolism in Bacillus subtilis: Vive la différence! Mol Microbiol. 1999;32(2):223–232. doi: 10.1046/j.1365-2958.1999.01333.x. [DOI] [PubMed] [Google Scholar]
- 3.Molle V, et al. Additional targets of the Bacillus subtilis global regulator CodY identified by chromatin immunoprecipitation and genome-wide transcript analysis. J Bacteriol. 2003;185(6):1911–1922. doi: 10.1128/JB.185.6.1911-1922.2003. [DOI] [PMC free article] [PubMed] [Google Scholar]
- 4.Sonenshein AL. CodY, a global regulator of stationary phase and virulence in Gram-positive bacteria. Curr Opin Microbiol. 2005;8(2):203–207. doi: 10.1016/j.mib.2005.01.001. [DOI] [PubMed] [Google Scholar]
- 5.Sonenshein AL. Control of key metabolic intersections in Bacillus subtilis. Nat Rev Microbiol. 2007;5(12):917–927. doi: 10.1038/nrmicro1772. [DOI] [PubMed] [Google Scholar]
- 6.Guédon E, Serror P, Ehrlich SD, Renault P, Delorme C. Pleiotropic transcriptional repressor CodY senses the intracellular pool of branched-chain amino acids in Lactococcus lactis. Mol Microbiol. 2001;40(5):1227–1239. doi: 10.1046/j.1365-2958.2001.02470.x. [DOI] [PubMed] [Google Scholar]
- 7.Shivers RP, Sonenshein AL. Activation of the Bacillus subtilis global regulator CodY by direct interaction with branched-chain amino acids. Mol Microbiol. 2004;53(2):599–611. doi: 10.1111/j.1365-2958.2004.04135.x. [DOI] [PubMed] [Google Scholar]
- 8.Ratnayake-Lecamwasam M, Serror P, Wong KW, Sonenshein AL. Bacillus subtilis CodY represses early-stationary-phase genes by sensing GTP levels. Genes Dev. 2001;15(9):1093–1103. doi: 10.1101/gad.874201. [DOI] [PMC free article] [PubMed] [Google Scholar]
- 9.Brinsmade SR, Sonenshein AL. Dissecting complex metabolic integration provides direct genetic evidence for CodY activation by guanine nucleotides. J Bacteriol. 2011;193(20):5637–5648. doi: 10.1128/JB.05510-11. [DOI] [PMC free article] [PubMed] [Google Scholar]
- 10.Guédon E, Sperandio B, Pons N, Ehrlich SD, Renault P. Overall control of nitrogen metabolism in Lactococcus lactis by CodY, and possible models for CodY regulation in Firmicutes. Microbiology. 2005;151(Pt 12):3895–3909. doi: 10.1099/mic.0.28186-0. [DOI] [PubMed] [Google Scholar]
- 11.den Hengst CD, et al. The Lactococcus lactis CodY regulon: Identification of a conserved cis-regulatory element. J Biol Chem. 2005;280(40):34332–34342. doi: 10.1074/jbc.M502349200. [DOI] [PubMed] [Google Scholar]
- 12.Belitsky BR, Sonenshein AL. Genetic and biochemical analysis of CodY-binding sites in Bacillus subtilis. J Bacteriol. 2008;190(4):1224–1236. doi: 10.1128/JB.01780-07. [DOI] [PMC free article] [PubMed] [Google Scholar]
- 13.Belitsky BR. Indirect repression by Bacillus subtilis CodY via displacement of the activator of the proline utilization operon. J Mol Biol. 2011;413(2):321–336. doi: 10.1016/j.jmb.2011.08.003. [DOI] [PMC free article] [PubMed] [Google Scholar]
- 14.Frenzel E, et al. CodY orchestrates the expression of virulence determinants in emetic Bacillus cereus by impacting key regulatory circuits. Mol Microbiol. 2012;85(1):67–88. doi: 10.1111/j.1365-2958.2012.08090.x. [DOI] [PubMed] [Google Scholar]
- 15.Lindbäck T, et al. CodY, a pleiotropic regulator, influences multicellular behaviour and efficient production of virulence factors in Bacillus cereus. Environ Microbiol. 2012;14(8):2233–2246. doi: 10.1111/j.1462-2920.2012.02766.x. [DOI] [PubMed] [Google Scholar]
- 16.Majerczyk CD, et al. Direct targets of CodY in Staphylococcus aureus. J Bacteriol. 2010;192(11):2861–2877. doi: 10.1128/JB.00220-10. [DOI] [PMC free article] [PubMed] [Google Scholar]
- 17.Dineen SS, McBride SM, Sonenshein AL. Integration of metabolism and virulence by Clostridium difficile CodY. J Bacteriol. 2010;192(20):5350–5362. doi: 10.1128/JB.00341-10. [DOI] [PMC free article] [PubMed] [Google Scholar]
- 18.Château A, et al. Identification of CodY-targets in Bacillus anthracis by genome-wide in vitro binding analysis. J Bacteriol. 2013;195(6):1204–1213. doi: 10.1128/JB.02041-12. [DOI] [PMC free article] [PubMed] [Google Scholar]
- 19.Singer BS, Shtatland T, Brown D, Gold L. Libraries for genomic SELEX. Nucleic Acids Res. 1997;25(4):781–786. doi: 10.1093/nar/25.4.781. [DOI] [PMC free article] [PubMed] [Google Scholar]
- 20.Shimada T, Fujita N, Maeda M, Ishihama A. Systematic search for the Cra-binding promoters using genomic SELEX system. Genes Cells. 2005;10(9):907–918. doi: 10.1111/j.1365-2443.2005.00888.x. [DOI] [PubMed] [Google Scholar]
- 21.Bergara F, et al. CodY is a nutritional repressor of flagellar gene expression in Bacillus subtilis. J Bacteriol. 2003;185(10):3118–3126. doi: 10.1128/JB.185.10.3118-3126.2003. [DOI] [PMC free article] [PubMed] [Google Scholar]
- 22.Preis H, Eckart RA, Gudipati RK, Heidrich N, Brantl S. CodY activates transcription of a small RNA in Bacillus subtilis. J Bacteriol. 2009;191(17):5446–5457. doi: 10.1128/JB.00602-09. [DOI] [PMC free article] [PubMed] [Google Scholar]
- 23.Tuerk C, Gold L. Systematic evolution of ligands by exponential enrichment: RNA ligands to bacteriophage T4 DNA polymerase. Science. 1990;249(4968):505–510. doi: 10.1126/science.2200121. [DOI] [PubMed] [Google Scholar]
- 24.Berger BJ, English S, Chan G, Knodel MH. Methionine regeneration and aminotransferases in Bacillus subtilis, Bacillus cereus, and Bacillus anthracis. J Bacteriol. 2003;185(8):2418–2431. doi: 10.1128/JB.185.8.2418-2431.2003. [DOI] [PMC free article] [PubMed] [Google Scholar]
- 25.Thomaides HB, et al. Essential bacterial functions encoded by gene pairs. J Bacteriol. 2007;189(2):591–602. doi: 10.1128/JB.01381-06. [DOI] [PMC free article] [PubMed] [Google Scholar]
- 26.Wray LV, Jr, Fisher SH. Bacillus subtilis CodY operators contain overlapping CodY binding sites. J Bacteriol. 2011;193(18):4841–4848. doi: 10.1128/JB.05258-11. [DOI] [PMC free article] [PubMed] [Google Scholar]
- 27.Belitsky BR, Sonenshein AL. Roadblock repression of transcription by Bacillus subtilis CodY. J Mol Biol. 2011;411(4):729–743. doi: 10.1016/j.jmb.2011.06.012. [DOI] [PMC free article] [PubMed] [Google Scholar]
- 28.Belitsky BR, Sonenshein AL. Contributions of multiple binding sites and effector-independent binding to CodY-mediated regulation in Bacillus subtilis. J Bacteriol. 2011;193(2):473–484. doi: 10.1128/JB.01151-10. [DOI] [PMC free article] [PubMed] [Google Scholar]
- 29.Bailey TL, et al. 2009. MEME SUITE: Tools for motif discovery and searching. Nucleic Acids Res 37(Web Server issue):W202–W208.
- 30.Shimada T, Ishihama A, Busby SJ, Grainger DC. The Escherichia coli RutR transcription factor binds at targets within genes as well as intergenic regions. Nucleic Acids Res. 2008;36(12):3950–3955. doi: 10.1093/nar/gkn339. [DOI] [PMC free article] [PubMed] [Google Scholar]
- 31.Tomljenovic-Berube AM, Mulder DT, Whiteside MD, Brinkman FS, Coombes BK. Identification of the regulatory logic controlling Salmonella pathoadaptation by the SsrA-SsrB two-component system. PLoS Genet. 2010;6(3):e1000875. doi: 10.1371/journal.pgen.1000875. [DOI] [PMC free article] [PubMed] [Google Scholar]
- 32.Koide Y, Nakamura A, Uozumi T, Beppu T. Cloning and sequencing of the major intracellular serine protease gene of Bacillus subtilis. J Bacteriol. 1986;167(1):110–116. doi: 10.1128/jb.167.1.110-116.1986. [DOI] [PMC free article] [PubMed] [Google Scholar]
- 33.Perego M, et al. Multiple protein-aspartate phosphatases provide a mechanism for the integration of diverse signals in the control of development in B. subtilis. Cell. 1994;79(6):1047–1055. doi: 10.1016/0092-8674(94)90035-3. [DOI] [PubMed] [Google Scholar]
- 34.Jiang M, Grau R, Perego M. Differential processing of propeptide inhibitors of Rap phosphatases in Bacillus subtilis. J Bacteriol. 2000;182(2):303–310. doi: 10.1128/jb.182.2.303-310.2000. [DOI] [PMC free article] [PubMed] [Google Scholar]
- 35.Rhee HS, Pugh BF. Comprehensive genome-wide protein-DNA interactions detected at single-nucleotide resolution. Cell. 2011;147(6):1408–1419. doi: 10.1016/j.cell.2011.11.013. [DOI] [PMC free article] [PubMed] [Google Scholar]
- 36.Nicolas P, et al. Condition-dependent transcriptome reveals high-level regulatory architecture in Bacillus subtilis. Science. 2012;335(6072):1103–1106. doi: 10.1126/science.1206848. [DOI] [PubMed] [Google Scholar]
- 37.Goecks J, Nekrutenko A, Taylor J, Team G. Galaxy Team Galaxy: A comprehensive approach for supporting accessible, reproducible, and transparent computational research in the life sciences. Genome Biol. 2010;11(8):R86. doi: 10.1186/gb-2010-11-8-r86. [DOI] [PMC free article] [PubMed] [Google Scholar]
- 38.Zeigler DR, et al. The origins of 168, W23, and other Bacillus subtilis legacy strains. J Bacteriol. 2008;190(21):6983–6995. doi: 10.1128/JB.00722-08. [DOI] [PMC free article] [PubMed] [Google Scholar]
- 39.Belitsky BR, Janssen PJ, Sonenshein AL. Sites required for GltC-dependent regulation of Bacillus subtilis glutamate synthase expression. J Bacteriol. 1995;177(19):5686–5695. doi: 10.1128/jb.177.19.5686-5695.1995. [DOI] [PMC free article] [PubMed] [Google Scholar]
- 40.Liu ST, Hong GF. Three-minute G + A specific reaction for DNA sequencing. Anal Biochem. 1998;255(1):158–159. doi: 10.1006/abio.1997.2457. [DOI] [PubMed] [Google Scholar]
Associated Data
This section collects any data citations, data availability statements, or supplementary materials included in this article.