

Abstract
Paramagnetic metal ions generate pseudocontact shifts (PCSs) in nuclear magnetic resonance spectra that are manifested as easily measurable changes in chemical shifts. Metals can be incorporated into proteins through metal binding tags, and PCS data constitute powerful long-range restraints on the positions of nuclear spins relative to the coordinate system of the magnetic susceptibility anisotropy tensor (Δχ-tensor) of the metal ion. We show that three-dimensional structures of proteins can reliably be determined using PCS data from a single metal binding site combined with backbone chemical shifts. The program PCS-ROSETTA automatically determines the Δχ-tensor and metal position from the PCS data during the structure calculations, without any prior knowledge of the protein structure. The program can determine structures accurately for proteins of up to 150 residues, offering a powerful new approach to protein structure determination that relies exclusively on readily measurable backbone chemical shifts and easily discriminates between correctly and incorrectly folded conformations.
Keywords: pseudocontact shift, protein structure determination, NMR spectroscopy, PCS-ROSETTA, lanthanides
Introduction
The three-dimensional (3D) structure of proteins is a prerequisite for understanding protein function, protein–ligand interactions and rational drug design. Protein structures can be readily determined by nuclear magnetic resonance (NMR) spectroscopy.1 The most difficult part of an NMR structure determination typically is the assignment of side-chain chemical shifts and nuclear Over-hauser enhancement spectroscopy (NOESY) peaks. This bottleneck can potentially be avoided if methods for computing high-accuracy structures from backbone-only NMR experiments can be developed.2
Pseudocontact shifts (PCSs) are a rich source of structural information that are manifested as large changes in chemical shifts in the NMR spectrum caused by a nonvanishing magnetic susceptibility anisotropy tensor (Δχ-tensor) of a paramagnetic metal ion. The PCS (in parts per million) of a nuclear spin i depends on the polar coordinates ri, Θi and Φi of the nuclear spin with respect to the Δχ-tensor frame of the metal ion and the axial and rhombic components of the Δχ-tensor:
| (1) |
The Δχ-tensor defines a coordinate system in the molecule that is centered on the metal ion and is fully described by eight parameters (Δχax, Δχrh, three Euler angles relating the orientation of the Δχ-tensor to the protein frame and the coordinates of the metal ion). Therefore, the Δχ-tensor can be determined using PCS data from at least eight nuclear spins, provided that the coordinates of the spins are known.
As PCSs can be measured for nuclear spins 40 Å away from the metal, they present long-range structure restraints exquisitely suited to characterize the global structural arrangement of a protein. Thus, PCSs have been used very successfully to refine protein structures,3–5 dock protein molecules of known 3D structures6–8 and determine the structure of small molecules bound to a protein of known 3D structure.9–11 The need for atom coordinates to determine the Δχ-tensor parameters, however, makes it more difficult to use PCSs in de novo determinations of protein 3D structures. All presently available protein structure determination software that uses PCS data to supplement conventional NMR restraints requires estimates of effective Δχax and Δχrh as input parameters.12–15 These are often difficult to estimate accurately, as they depend on the chemical environment of the metal ion and the mobility of the paramagnetic center with respect to the protein.
The ROSETTA structure prediction methodology16 is well suited for taking advantages of the rich source of information inherent in PCSs. ROSETTA de novo structure prediction has two stages—first, a low-resolution phase in which conformational space is searched broadly using a coarse-grained energy function and, second, a high-resolution phase in which models generated in the first phase are refined in a physically realistic all-atom force field. The bottleneck in structure prediction using ROSETTA is conformational sampling; close-to-native structures almost always have lower energies than nonnative structures. For small proteins (<100 residues), ROSETTA has produced models with atomic level accuracy in blind prediction challenges.17 For larger proteins, however, structures close enough to the native structure to fall into the deep native energy minimum are generated seldom or not at all. This sampling problem can be overcome if even very limited experimental data are available to guide the initial low-resolution search. For example, CS-ROSETTA uses NMR chemical shifts to guide fragment selection and constrain backbone torsion angles, greatly improving the final yield of correctly folded protein models.18 As ROSETTA in favorable cases is capable of generating protein structures very close to experimentally determined structures from sequence information alone,19 it is of great interest to combine ROSETTA with readily accessible experimental data to determine protein structures.
In this paper, we describe the incorporation of PCS data into ROSETTA. We show that this new PCS-ROSETTA method can generate accurate structures for proteins of up to 150 amino acids in length even from quite limited data sets.
Results
Test set
We tested the new PCS-ROSETTA method (see Materials and Methods) on a benchmark of nine proteins for which chemical shifts and PCSs have been published. ArgN repressor was independently determined twice with PCS data measured from paramagnetic metal ions at two different sites. The proteins were between 56 and 186 amino acid residues in size, had different folds and had between 82 and 1169 PCSs measured from one to eleven different metal ions located at a single metal binding site (Table 1 and Supporting Information Table 1). Fragments for each protein were selected with CS-ROSETTA using available chemical shift data and were used for all calculations. Structures of proteins with significant sequence similarity to the target proteins were explicitly excluded from the CS-ROSETTA database. The exclusion threshold we used was significantly stricter than that used in the original CS-ROSETTA study,18 and in the cases where distant homologs were removed, the final model quality in our CS-ROSETTA calculations was worse than previously reported.
Table 1.
Protein structures used to evaluate the performance of PCS-ROSETTA
| Targets | Protein Data Bank ID | Nresa | NMb | NPCSc | PCS-ROSETTA rund
|
CS-ROSETTA rune
|
RefCSf | RefPCSg | |||
|---|---|---|---|---|---|---|---|---|---|---|---|
| rmsdh | Convegencei | Qj | rmsdh | Convergencei | |||||||
| Protein G (A) | 3GfB1 | 56 | 3 | 158 | 0.61 | 0.92 | 0.06 | 0.80 | 0.88 | 33 | 34 |
| Calbindin (B) | 1KQV | 75 | 11 | 1169 | 1.46 | 2.04 | 0.16 | 4.96 | 4.37 | 35 | 4 |
| θ subunit (C) | 2AE9 | 76 | 2 | 91 | 1.65 | 4.35 | 0.07 | 8.90 | 8.75 | 36 | 37 |
| ArgNk (D) | 1AOY | 78 | 3 | 222 | 0.98 | 2.38 | 0.08 | 6.93 | 5.32 | 21 | 21 |
| ArgNl (E) | 1AOY | 78 | 2 | 82 | 1.03 | 2.25 | 0.09 | 8.01 | 6.64 | 21 | 38 |
| N-Calmodulin (F) | 1SW8 | 79 | 2 | 125 | 2.34 | 1.85 | 0.09 | 4.69 | 3.68 | 39 | 39 |
| Thioredoxin (G) | 1XOA | 108 | 1 | 90 | 2.58 | 2.64 | 0.23 | 4.98 | 6.06 | 40, 41 | 42 |
| Parvalbumin (H) | 1RJV | 110 | 1 | 106 | 11.26 | 10.42 | 0.20 | 11.80 | 11.20 | 43 | 43 |
| Calmodulin (I) | 2K61 | 146 | 4 | 408 | 2.80 | 2.12 | 0.14 | 6.35 | 5.55 | 44 | 44 |
| ε186m (J) | 1J54 | 186 | 3 | 738 | 20.57 | 17.54 | 0.36 | 15.46 | 17.23 | 45 | 46 |
Number of residues.
Number of metal ions for which PCS data were measured.
Total number of PCSs measured.
The structures used to calculate the rmsd values were identified using the combined PCS score and ROSETTA full-atom energy on the whole protein sequence.
The structures used to calculate the rmsd values were identified by the ROSETTA full-atom energy on the whole protein sequence.
Reference to source of chemical shifts in diamagnetic state of the protein.
Reference to source of PCS data of the protein.
Cα rmsd (with respect to the native structure) of the structure of lowest score, in angstroms. All Cα rmsd values were calculated using the core residues defined in Supplementary Table 1.
Average Cα rmsd calculated between the lowest-score structure and the next four lowest-scoring structure, in angstroms. The rmsd values were calculated on the whole protein sequence.
Quality factor calculated on the structure of lowest PCS-ROSETTA score.
PCS measured with covalently attached dipicolinic acid tag.
PCS measured with non-covalently bound [Ln(DPA)3]3−.
N-terminal 186 residues of the ε subunit of the E. coli polymerase III.
Capacity of the PCS score to identify native-like structures
The PCS score describes a model’s agreement with observed PCS data by calculating the expected PCS data given the structure. To calculate this, we used a 3D grid search for the metal coordinates coupled with singular value decomposition for the Δχ-tensor components to find the optimal match between calculated and observed data (see Materials and Methods). The capacity of the PCS score to identify native-like models was assessed on sets of 3000 CS-ROSETTA structures for each of the nine test proteins. These test structures were produced using a reduced fragment set and included native fragments to ensure that some of the models were similar to the target structure. The Cα rmsd of the decoy with the lowest PCS score was always small (below 2.3 Å) with respect to the target protein (Fig. 1). In addition, for all target proteins for which PCSs were available from two or more paramagnetic metal ions, low Cα rmsd values correlated with low PCS scores. This indicates that the PCS score can be used not only to identify near-native structures but also to bias conformational sampling toward the native structure during fragment assembly. Comparisons between the ROSETTA low-resolution energy function and PCS score are shown in Supporting Information Fig. 1.
Fig. 1.
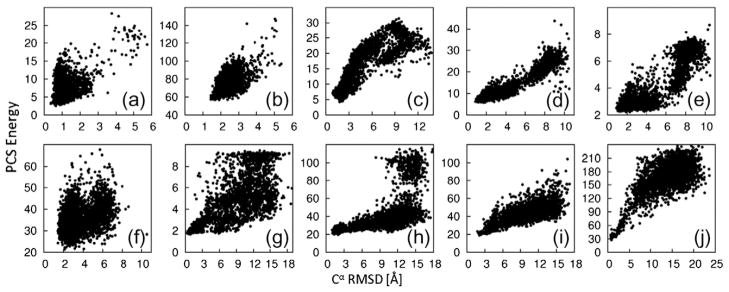
Fold identification by PCSs. We generated 3000 decoys using CS-ROSETTA. In order to ensure the presence of decoys with low rmsd values to the target structure, we reduced the starting set of peptide fragments and included fragments from the known target structures. PCS scores are plotted versus the Cα rmsd to the target structure. The targets (a–j) are as in Table 1. The PCS score correlates with the Cα rmsd.
PCSs from 11 different lanthanides were available for calbindin. In order to explore the value of using PCSs from multiple lanthanides, we rescored the structures using PCSs from both individual and multiple lanthanides. Spearman rank correlation of PCS score versus rmsd had coefficients ranging from 0.060 to 0.569 (average, 0.377) for single data sets. Pairwise combination of PCS sets resulted in increased coefficients ranging from −0.080 to 0.574 (average, 0.459). Using all PCS sets resulted in a rank correlation coefficient greater than 0.6, showing that PCSs from multiple metal ions greatly facilitate identification of native-like protein folds.
Comparison of PCS-ROSETTA with CS-ROSETTA
We generated 10,000 decoys each with CS-ROSETTA and PCS-ROSETTA. Both computations used the same fragment set, taking into account secondary structure information from chemical shift measurements. Figure 2 illustrates the ability of the PCS score to bias sampling toward the native structure. For seven out of the ten structure calculations, the PCSs dramatically increased the frequency with which decoys with low Cα rmsd to the reference structure were found. The effect was particularly pronounced for protein targets with larger PCS data sets. For example, more than a third of the decoys found for calmodulin had a Cα rmsd of less than 4 Å to the target structure, whereas fewer than 3% met this criterion in the absence of PCS data. Similar results were obtained for the θ subunit, protein G and both ArgN repressor calculations. The PCS data did not significantly improve the results for thioredoxin and parvalbumin for which only PCS data from a single paramagnetic metal ion were available. No native-like structures were found for ε186, which may be attributed to its larger size (186 residues). To evaluate the influence of the PCS score during the fragment assembly, we performed an additional calculation with the PCS score as the only energy term (Supporting Information Text 1).
Fig. 2.
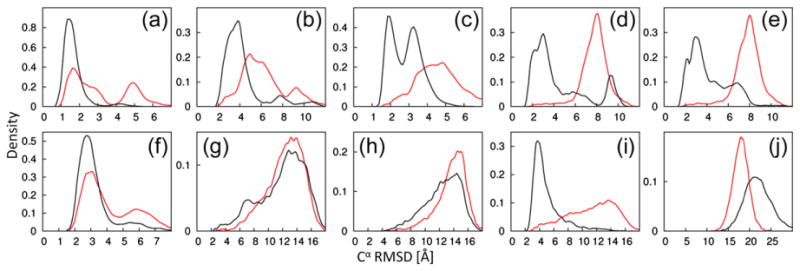
Improved conformational sampling by PCS-ROSETTA. We carried out 10,000 independent low-resolution trajectories with (black) or without (red) PCS information. The plots show the density of Cα rmsd values to the target structure after the fragment assembly step. The targets are labeled as in Table 1. Corresponding plots of structures calculated with full-atom relaxation for positioning the amino acid side chains are shown in Supporting Information Fig. 2. The library used for fragment selection explicitly excluded any protein with sequence similarity to the target protein. The figure shows that PCS scores efficiently guide fragment assembly toward the correct target structure.
The low-resolution models were subjected to full-atom relaxation refinement in the last step of the calculation, using the full-atom ROSETTA force field (without inclusion of the PCS score). The additional minimization step did not significantly change the overall shape of the distributions but tended to improve the Cα rmsd of native-like decoys (Supporting Information Fig. 2) and, most importantly, allows recognition of the best models based on their energies.
Rescoring full-atom relaxed structures with a weighted combination of the ROSETTA and PCS scores further improved the recognition of near-native structures as measured by the Cα rmsd of the lowest-energy structure (Table 1, PCS-ROSETTA run; Fig. 3), with PCS-ROSETTA identifying low Cα rmsd (<3 Å) structures in eight out of ten cases. With the exception of target C, for all successful targets, a population of the five lowest-energy structures converge to less than 3 Å, while the two failed targets do not improve beyond 10 Å (Table 1). Convergence is a signal that the protocol has found a topology that reliably satisfies the combined score, which, in the case of PCS-ROSETTA, clearly identifies the failed models as unreliable, allowing for their rejection.18 In the case of target C, large disordered termini prevent a clear identification of convergence, but convergence becomes apparent when only the core residues are considered (Supporting Information Table 2). Results with CS-ROSETTA and PCS-ROSETTA are compared in Supporting Information Fig. 3.
Fig. 3.
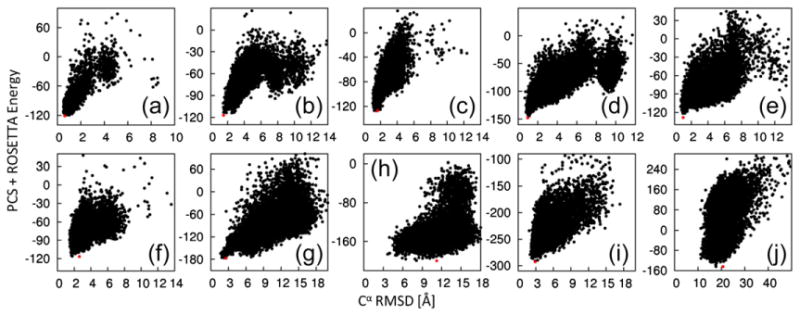
Energy landscapes generated by PCS-ROSETTA. Combined ROSETTA energy and PCS score [using the weighting factor w(c)] are plotted versus the Cα rmsd to the target structure for structures calculated using PCS-ROSETTA. The lowest-energy structures are indicated in red. The targets are labeled as in Table 1. The results show that PCS-ROSETTA is likely to generate and identify the correct fold.
Agreement of the structures with the experimental data can also be directly assessed by the quality factor , where is the experimental PCS value for the nuclear spin i. A quality factor above 25% indicates failure to find a correct structure, and a quality factor below 20% indicates that the computed structure is in good agreement with the experimental PCSs (Table 1), as in other definitions of quality factors.20 The low quality factor of the θ subunit (7%) establishes the success of the calculation despite the lack of clear convergence.
Successes and limits of PCS-ROSETTA calculations
The results of PCS-ROSETTA calculations are summarized in Table 1. The structures of small proteins (<80 residues, targets A to F) are easily solved by PCS-ROSETTA: the lowest PCS-ROSETTA energy is consistently below 2.4 Å in Cα rmsd relative to the native structure and has a quality factor below 16%. For these proteins, the generation of 10,000 models was ample (Fig. 2a–f). The same number of decoys calculated with CS-ROSETTA did not lead to satisfactory convergence for targets B to F (Table 1), though targets C and D partially recover if flexible termini are removed at the full-atom rescoring step (Supporting Information Text 2). The tag used to paramagnetically label ArgN (D) produced Δχ-tensor axes of significantly different orientation with different lanthanides,21 which may explain why the PCS-ROSETTA calculations performed particular well with these data.
PCS-ROSETTA succeeded in calculating the structure of a protein with 146 residues and PCSs from multiple lanthanides (target I). More than 62% of calculated structures had a Cα rmsd below 5 Å, while only 6.2% met that criterion for CS-ROSETTA calculation (Fig. 2i). This indicates that the PCS data score can effectively guide the sampling toward the correct fold also for larger proteins. While calculations on target J (186 residues) did not converge despite a large PCS data set, this can be attributed to a sampling problem associated with large proteins of complex topology,19 which may be overcome with a modified protocol. Importantly, the success of a calculation can be ascertained from calculating the quality factor Q. Combined with the convergence criterion,18 the quality factor is an effective way to assert the success of a calculation (Supporting Information Fig. 4). For each of the eight targets for which the PCS-ROSETTA calculations converged, the structure with the lowest energy is shown superimposed with the native structure in Fig. 4.
Fig. 4.
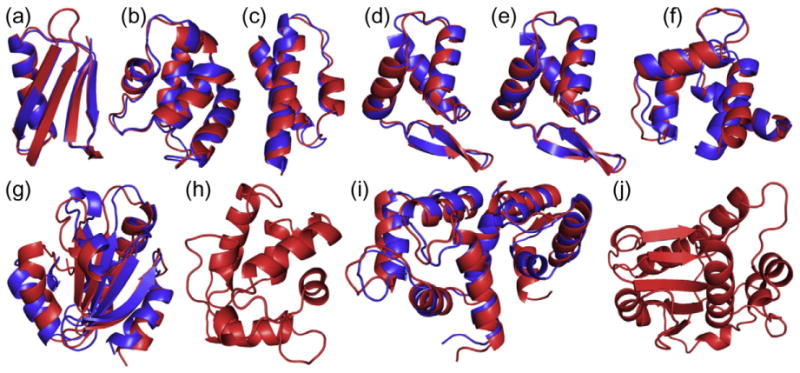
Superimpositions of ribbon representations of the backbones of the lowest-energy structures calculated with PCS-ROSETTA (blue) onto the corresponding target structures (red). The protein targets are (a) protein G, (b) calbindin, (c) the θ subunit of Escherichia coli DNA polymerase III, (d) the N-terminal domain of the E. coli arginine repressor (ArgN; with covalent lanthanide tag), (e) ArgN with non-covalent lanthanide tag, (f) the N-terminal domain of calmodulin, (g) thioredoxin, (h) parvalbumin, (i) calmodulin and (j) the globular domain of the ε subunit of E. coli DNA polymerase III. Flexible termini were omitted as described in Supporting Information Table 1. Only the target structure is shown for parvalbumin (h) and the ε subunit (j), as the calculations could not reproduce the correct fold for these proteins.
Discussion
The structural information content of the PCS effect has long been recognized, but initial attempts to determine the 3D structures of biomolecules by the use of PCSs were hampered by the difficulty to determine Δχ-tensor and structure simultaneously.22 Subsequently, the first 3D structure determinations of proteins relied on nuclear Over-hauser effect (NOE) data.1 Later attempts to solve a protein structure without the use of NOEs relied heavily on a blend of restraints from paramagnetic NMR effects, including residual dipolar coupling, cross-correlated relaxation and PCS restraints, and additional experimental secondary structure restraints.23 Full structure determination of proteins from PCS data alone continues to be regarded as difficult.24 Owing to its modeling capabilities, PCS-ROSETTA makes it possible, for the first time, to determine 3D structures using PCSs as the only restraints while simultaneously determining all Δχ-tensor parameters and integrating PCSs from different metal ions. In addition, a PCS quality factor that is highly indicative of the correctness of the final structure can be calculated. The effect of the PCSs on improving convergence of the calculations toward the correct target structures is particularly remarkable if one considers that PCS data mostly were available only for backbone amides.
The success of PCS-ROSETTA is based on the fact that, in contrast to scoring functions using chemical shift data, the PCS score is much more sensitive to global than local structure. Therefore, PCS data can guide the search in the low-resolution fragment assembly step, greatly increasing the yield of near-native structures compared to CS-ROSETTA. PCSs thus present an ideal complement to chemical shift information that is most important in the preceding fragment selection step. The improved convergence alleviates the need to compute large numbers of decoys. It would be possible to accelerate the computations further by using the PCS score to select decoys with low rmsd values to the target structure prior to the computationally expensive refinement of amino acid side-chain conformations.
Many protein specific factors including fold complexity, number and quality of PCS data and metal site play roles in the success of PCS-ROSETTA fragment assembly, and their relative importance is difficult to disentangle. In general, PCS data from two or more lanthanides are expected to assist identification of decoys with low rmsd to the target structure. While the structure of calmodulin, a protein with 146 residues, was successfully determined by PCS-ROSETTA, the structure of ε186 (186 residues) was not found by the program despite the availability of many PCSs overall (Table 1). The scarcity of PCS values for residues near the lanthanide binding site may have contributed to this effect. As the PCS-ROSETTA protocol did not sample structures below 10 Å rmsd (Fig. 3j) and as the energy landscape defined by the PCS scores became funnel-like only for structures with less than about 10 Å rmsd to the native structure (Fig. 1j), it is also conceivable that the conformational space explored by the basic ROSETTA sampling protocol needs to be much larger for larger proteins. To explore the performance of PCS-ROSETTA for large proteins and proteins that converge poorly with CS-ROSETTA, we performed test calculations using simulated PCS data. The results show consistently improved convergence and identification of correctly folded substructures by PCS-ROSETTA, even though convergence to structures close to the target structure remained difficult (Supporting Information). An alternative sampling protocol, such as broken chain sampling25 or iterative refinement,26 may be required for accurate PCS-assisted modeling of difficult proteins such as ε186.
The present calculations were performed with proteins containing single metal binding sites. Clearly, data from multiple metal ions using different metal binding sites will greatly enhance the information content of PCS data. In particular, lanthanide ions display very different paramagnetic properties, while their chemical similarity allows all lanthanides to bind at a given lanthanide binding site. Several metal binding tags have recently been developed to tag proteins site-specifically with a paramagnetic lanthanide; for a recent review, see Refs. 27 and 28. We note that PCSs were as useful for targets devoid of natural metal binding sites (targets A, C, D and E) as for metalloproteins (Fig. 2). Rigid attachment of lanthanides to the protein can be important as tag mobility may introduce errors in the computed structure due to the averaging of the PCS effect, but we note that excellent fits of PCSs to protein structures can also be obtained in the presence of substantial tag mobility.29
In conclusion, we propose a new approach to protein structure determination in which PCS data are collected from natural or engineered metal binding sites and then used to guide ROSETTA conformational search along with backbone chemical shift data. Although ROSETTA calculations are computationally demanding particularly for larger proteins, the PCS-ROSETTA method shows improved convergence and is applicable without the need of time-consuming side-chain resonance assignments and NOE measurements. The approach further allows reliable assessment of the accuracy and reliability of the lowest-energy models based on the convergence of the calculation and the PCS quality factor. In view of the increasing rate with which specific lanthanide tags are being developed and commercialized for proteins,30 with multiple independent lanthanide data sets and improved conformational search methods, the approach should be extendable to proteins greater than 150 amino acids when backbone PCS data sets from three or more lanthanides are available. PCS-ROSETTA is available free of charges as a module of the academic release of the ROSETTA program for protein modeling‡.
Materials and Methods
PCS-ROSETTA score
The PCS (in ppm) induced by a metal ion M on a nuclear spin can be calculated as31
| (2) |
where ri is the distance between the spin i and the paramagnetic center M; xi, yi and zi are the Cartesian coordinates of the vector between the metal ion and the spin i in an arbitrary frame f; and Δχxx, Δχyy, Δχzz, Δχxy, Δχxz and Δχyz are the Δχ-tensor components in the frame f (as Δχzz = −Δχxx − Δχyy, there are only five independent parameters). The Δχ-tensor components and the metal coordinates are initially unknown and must be redetermined each time the PCS score c is evaluated. c is calculated over all metal ions Mj as
| (3) |
where and are the calculated and experimental PCS values of spin i induced by the metal ion Mj, respectively. The determination of the Δχ-tensor components and the metal coordinates presents a nonlinear least-square fitting problem. In order to avoid local minima and speed up the calculation, we split the problem into its linear and nonlinear parts. Equation (2) shows that is linear with respect to the five Δχ-tensor components. With the use of a 3D grid search over the Cartesian coordinates xM, yM and zM of the paramagnetic center, singular value decomposition optimizes the five Δχ-tensor parameters efficiently and without ambiguity for lowest residual score c at each node of the grid. The grid node with the lowest c score is then used as the starting point for optimization of the three metal coordinates along with the five Δχ-tensor components to reach the minimal cost c.
The PCS score was added to the ROSETTA low-resolution energy function using a different weighting factor w(c) for each structure calculation. w(c) was determined by first generating 1000 decoys with ROSETTA and calculating w(c) as
| (4) |
where ahigh and alow are the average of the highest and lowest 10% of the values of the ROSETTA ab initio score, and chigh and clow are the average of the highest and lowest 10% of the values of the PCS score c upon rescoring each of the 1000 decoys with the PCS. The weights used for the 10 structure calculations performed in the present work are given in Supporting Information Table 1.
PCS-ROSETTA algorithm
PCS-ROSETTA uses the ROSETTA de novo structure prediction methodology to build low-resolution models, followed by all-atom refinement using the ROSETTA high-resolution Monte Carlo minimization protocol. The additions to the standard ROSETTA structure prediction methods are as follows: the use of chemical shifts to guide fragment selection as in CS-ROSETTA, the use of PCS data to guide the initial low-resolution search and the use of PCS data for final model selection. A flow diagram of the computational protocol of PCS-ROSETTA is shown in Supporting Information Fig. 5.
Input for PCS-ROSETTA
The backbone 1H, 13C and 15N diamagnetic chemical shifts of all protein targets, with exception of thioredoxin for which only 1H and 15N chemical shifts were available, were taken from the literature or from the Biological Magnetic Resonance Bank (Table 1 and Supporting Information Table 0). CS-ROSETTA was used for fragment selection. CS-ROSETTA reports the difference between experimental and expected chemical shifts. Chemical shifts with very large deviations from expectations (often attributable to errors in the deposited data) were removed from the input. CS-ROSETTA also suggests corrections in the chemical shift referencing. We only corrected 13C chemical shifts, except for thioredoxin where 15N chemical shift was corrected (Supporting Information Table 1). CS-ROSETTA aims to generate 200 nine-residue fragments and 200 three-residue fragments centered on each residue of the polypeptide chain for use in the ab initio fragment assembly protocol of ROSETTA. In cases where CS-ROSETTA failed to generate 200 fragments, we generated additional fragments using the conventional ROSETTA protocol in order to make 200 fragments available. For each of the target proteins, we removed any protein with recognizable sequence similarity (BLAST E-value below 0.05) from the CS-ROSETTA protein database. E-values were computed against the CS-ROSETTA sequence database, which is approximately 500 times smaller than the nonredundant database used by Shen et al.18 Since E-values scale with database size, this results in a much stricter homology threshold and is equivalent to an E-value of approximately 25 if the nonredundant database of Shen et al. had been used. In order to accelerate the grid search for the metal position, PCS-ROSETTA allows a precise description of the space to be searched, including the center of the grid search (cg), the step size between two nodes (sg), an outer cutoff radius (co) to limit the search to a minimal distance from cg and an inner cutoff radius (ci) to avoid a search too close to cg. A moderately large step size (sg) was chosen to speed up computations during low-resolution sampling (Supporting Information Table 1) and reduced to 25% of its value during the final high-resolution scoring step to ensure maximum accuracy. For each target, the grid parameters cg, co and ci were chosen in accordance to prior knowledge about the approximate metal binding site. For example, for a covalent tag attached to the protein, we used the known geometric information of the tag to set cg, co and ci, whereas for proteins with a natural metal binding site, a highly conserved negatively charged residue was picked as a reference point for cg. In the absence of prior biochemical information, the nuclear spin with the largest absolute PCS value was chosen as the center of the grid. Supporting Information Table 1 summarizes the grid parameters used for the different protein targets. In order to assess the impact of the initial grid parameters on the structures calculated, we performed a set of PCS-ROSETTA calculations for each target, where cg was centered at the nuclear spin of the largest PCS observed and where the cutoff radius co was set to 15 Å. No change in the quality of the results was observed, but in most cases, the calculations took longer.
PCS-ROSETTA protocol for protein structure determination
Chemical shifts of the proteins were prepared in Talos format32 and used by CS-ROSETTA for fragment selection. Chemical shift corrections, fragment selection and determination of the weights w(c) were performed as described above. We computed 10,000 protein structures with PCS-ROSETTA and subjected them to the full-atom relaxation protocol of ROSETTA to model the side-chain conformations. The final structures were rescored using the ROSETTA full-atom energy function combined with the PCS scores c, using the weighting factors w(c) [Eq. (4)] with ahigh and alow calculated against the ROSETTA full-atom energy and with a total weight multiplied by 2 to give a larger contribution to the PCS score than in the fragment assembly. The best scoring structures can be assessed by the PCS quality factor Q = rms(PCScalc -PCSexp)/rms(PCSexp). Computation of 10,000 PCS-ROSETTA structures took on average 137 CPU days per target (approximately three times longer than CS-ROSETTA calculations) and was run on a local cluster. Supporting Information Fig. 6 shows a posteriori that 1000 structures per targets would have been enough for convergence of the protocol.
Computation of structures to evaluate the effects of PCS scoring
We generated 3000 decoys with a wide range of rmsd values to the target structure by including the native fragment and limiting the number of alternatives fragments in the fragment generation step of the ROSETTA calculations. We calculated 1000 decoys each using two, five and ten fragments per residue, respectively. The presence of the native fragments in a small pool of fragments ensured the generation of structures very similar to the target structure.
Supplementary Material
Acknowledgments
C.S. thanks the University of Queensland for a Graduate School Research Travel Grant to undertake this collaborative research project. T.H. thanks the Australian Research Council for a Future Fellowship. Financial support from the Australian Research Council for project grants to G.O. and T.H. is gratefully acknowledged. D.B. thanks the Howard Hughes Medical Institutes.
Abbreviations used
- PCS
pseudocontact shift
- 3D
three-dimensional
- NOE
nuclear Overhauser enhancement
Footnotes
The design is available at http://www.rosettacommons.org/
Supplementary data to this article can be found online at doi:10.1016/j.jmb.2011.12.056
References
- 1.Wüthrich K. NMR of Proteins and Nucleic Acids. Wiley; New York, NY: 1986. [Google Scholar]
- 2.Raman S, Lange OF, Rossi P, Tyka M, Wang X, Aramini J, et al. NMR structure determination for larger proteins using backbone-only data. Science. 2010;327:1014–1018. doi: 10.1126/science.1183649. [DOI] [PMC free article] [PubMed] [Google Scholar]
- 3.Arnesano F, Banci L, Piccioli M. NMR structures of paramagnetic metalloproteins. Q Rev Biophys. 2005;38:167–219. doi: 10.1017/S0033583506004161. [DOI] [PubMed] [Google Scholar]
- 4.Bertini I, Donaire A, Jiménez B, Luchinat C, Parigi G, Piccioli M, Poggi L. Paramagnetism-based versus classical constraints: an analysis of the solution structure of Ca Ln calbindin D9k. J Biomol NMR. 2001;21:85–98. doi: 10.1023/a:1012422402545. [DOI] [PubMed] [Google Scholar]
- 5.Gaponenko V, Sarma SP, Altieri AS, Horita DA, Li J, Byrd RA. Improving the accuracy of NMR structures of large proteins using pseudocontact shifts as long-range restraints. J Biomol NMR. 2004;28:205–212. doi: 10.1023/B:JNMR.0000013706.09264.36. [DOI] [PubMed] [Google Scholar]
- 6.Pintacuda G, Park AY, Keniry MA, Dixon NE, Otting G. Lanthanide labeling offers fast NMR approach to 3D structure determinations of protein–protein complexes. J Am Chem Soc. 2006;128:3696–3702. doi: 10.1021/ja057008z. [DOI] [PubMed] [Google Scholar]
- 7.Ubbink M, Ejdebäck M, Karlsson BG, Bendall DS. The structure of the complex of plastocyanin and cytochrome f, determined by paramagnetic NMR and restrained rigid-body molecular dynamics. Structure. 1998;6:323–335. doi: 10.1016/s0969-2126(98)00035-5. [DOI] [PubMed] [Google Scholar]
- 8.Keizers PHJ, Mersinli B, Reinle W, Donauer J, Hiruma Y, Hannemann F, et al. A solution model of the complex formed by adrenodoxin and adrenodoxin reductase determined by paramagnetic NMR spectroscopy. Biochemistry. 2010;49:6846–6855. doi: 10.1021/bi100598f. [DOI] [PubMed] [Google Scholar]
- 9.John M, Pintacuda G, Park AY, Dixon NE, Otting G. Structure determination of protein–ligand complexes by transferred paramagnetic shifts. J Am Chem Soc. 2006;128:12910–12916. doi: 10.1021/ja063584z. [DOI] [PubMed] [Google Scholar]
- 10.Pintacuda G, John M, Su XC, Otting G. NMR structure determination of protein–ligand complexes by lanthanide labeling. Acc Chem Res. 2007;40:206–212. doi: 10.1021/ar050087z. [DOI] [PubMed] [Google Scholar]
- 11.Zhuang T, Lee HS, Imperiali B, Prestegard JH. Structure determination of a galectin-3-carbohydrate complex using paramagnetism-based NMR constraints. Protein Sci. 2008;17:1220–1231. doi: 10.1110/ps.034561.108. [DOI] [PMC free article] [PubMed] [Google Scholar]
- 12.Banci L, Bertini I, Cavallaro G, Giachetti A, Luchinat C, Parigi G. Paramagnetism-based restraints for Xplor-NIH. J Biomol NMR. 2004;28:249–261. doi: 10.1023/B:JNMR.0000013703.30623.f7. [DOI] [PubMed] [Google Scholar]
- 13.Banci L, Bertini I, Cremonini MA, Savellini GG, Luchinat C, Wüthrich K, Güntert P. PSEUDYANA for NMR structure calculation of paramagnetic metalloproteins using torsion angle molecular dynamics. J Biomol NMR. 1998;12:553–557. doi: 10.1023/A:1008388614638. [DOI] [PubMed] [Google Scholar]
- 14.Banci L, Bertini I, Savellini GG, Romagnoli A, Turano P, Cremonini MA, et al. Pseudo-contact shifts as constraints for energy minimization and molecular dynamics calculations on solution structures of paramagnetic metalloproteins. Proteins: Struct, Funct, Genet. 1997;29:68–76. doi: 10.1002/(sici)1097-0134(199709)29:1<68::aid-prot5>3.0.co;2-b. [DOI] [PubMed] [Google Scholar]
- 15.Hus JC, Marion D, Blackledge M. De novo determination of protein structure by NMR using orientational and long-range order restraints. J Mol Biol. 2000;298:927–936. doi: 10.1006/jmbi.2000.3714. [DOI] [PubMed] [Google Scholar]
- 16.Simons KT, Kooperberg C, Huang E, Baker D. Assembly of protein tertiary structures from fragments with similar local sequences using simulated annealing and Bayesian scoring functions. J Mol Biol. 1997;268:209–225. doi: 10.1006/jmbi.1997.0959. [DOI] [PubMed] [Google Scholar]
- 17.Raman S, Vernon R, Thompson J, Tyka M, Sadreyev R, Pei J, et al. Structure prediction for CASP8 with all-atom refinement using Rosetta. Proteins: Struct, Funct, Bioinformatics. 2009;77:89–99. doi: 10.1002/prot.22540. [DOI] [PMC free article] [PubMed] [Google Scholar]
- 18.Shen Y, Lange O, Delaglio F, Rossi P, Aramini JM, Liu GH, et al. Consistent blind protein structure generation from NMR chemical shift data. Proc Natl Acad Sci USA. 2008;105:4685–4690. doi: 10.1073/pnas.0800256105. [DOI] [PMC free article] [PubMed] [Google Scholar]
- 19.Bradley P, Misura KMS, Baker D. Toward high-resolution de novo structure prediction for small proteins. Science. 2005;309:1868–1871. doi: 10.1126/science.1113801. [DOI] [PubMed] [Google Scholar]
- 20.Cornilescu G, Marquardt JL, Ottiger M, Bax A. Validation of protein structure from anisotropic carbonyl chemical shifts in a dilute liquid crystalline phase. J Am Chem Soc. 1998;120:6836–6837. [Google Scholar]
- 21.Su XC, Man B, Beeren S, Liang H, Simonsen S, Schmitz C, et al. A dipicolinic acid tag for rigid lanthanide tagging of proteins and paramagnetic NMR spectroscopy. J Am Chem Soc. 2008;130:10486–10487. doi: 10.1021/ja803741f. [DOI] [PubMed] [Google Scholar]
- 22.Barry CD, North ACT, Glasel JA, Williams RJP, Xavier AV. Quantitative determination of mononucleotide conformations in solution using lanthanide ion shift and broadening NMR probes. Nature. 1971;232:236–245. doi: 10.1038/232236a0. [DOI] [PubMed] [Google Scholar]
- 23.Brunger AT, Adams PD, Clore GM, DeLano WL, Gros P, Grosse-Kunstleve RW, et al. Crystallography & NMR system: a new software suite for macromolecular structure determination. Acta Crystallogr, Sect D: Biol Crystallogr. 1998;54:905–921. doi: 10.1107/s0907444998003254. [DOI] [PubMed] [Google Scholar]
- 24.Bertini I, Longinetti M, Luchinat C, Parigi G, Sgheri L. Efficiency of paramagnetism-based constraints to determine the spatial arrangement of α-helical secondary structure elements. J Biomol NMR. 2002;22:123–136. doi: 10.1023/a:1014214015858. [DOI] [PubMed] [Google Scholar]
- 25.Bradley P, Baker D. Improved beta-protein structure prediction by multilevel optimization of nonlocal strand pairings and local backbone conformation. Proteins. 2006;65:922–929. doi: 10.1002/prot.21133. [DOI] [PubMed] [Google Scholar]
- 26.Qian B, Raman S, Das R, Bradley P, McCoy AJ, Read RJ, Baker D. High-resolution structure prediction and the crystallographic phase problem. Nature. 2007;450:259–264. doi: 10.1038/nature06249. [DOI] [PMC free article] [PubMed] [Google Scholar]
- 27.Su XC, Otting G. Paramagnetic labelling of proteins and oligonucleotides for NMR. J Biomol NMR. 2010;46:101–112. doi: 10.1007/s10858-009-9331-1. [DOI] [PubMed] [Google Scholar]
- 28.Keizers PH, Ubbink M. Paramagnetic tagging for protein structure and dynamics analysis. Prog Nucl Magn Reson Spectrosc. 2011;58:88–96. doi: 10.1016/j.pnmrs.2010.08.001. [DOI] [PubMed] [Google Scholar]
- 29.Graham B, Loh CT, Swarbrick JD, Ung P, Shin J, Yagi H, et al. A DOTA-amide lanthanide tag for reliable generation of pseudocontact shifts in protein NMR spectra. Bioconjug Chem. 2011;22:2118–2125. doi: 10.1021/bc200353c. [DOI] [PubMed] [Google Scholar]
- 30.Jia X, Maleckis A, Huber T, Otting G. 4,4′-Dithiobisdipicolinic acid: a small and convenient lanthanide binding tag for protein NMR spectroscopy. Chem Eur J. 2011;17:6830–6836. doi: 10.1002/chem.201003573. [DOI] [PubMed] [Google Scholar]
- 31.Bertini I, Luchinat C, Parigi G. Magnetic susceptibility in paramagnetic NMR. Prog Nucl Magn Reson Spectrosc. 2002;40:249–273. [Google Scholar]
- 32.Cornilescu G, Delaglio F, Bax A. Protein backbone angle restraints from searching a database for chemical shift and sequence homology. J Biomol NMR. 1999;13:289–302. doi: 10.1023/a:1008392405740. [DOI] [PubMed] [Google Scholar]
- 33.Wilton DJ, Tunnicliffe RB, Kamatari YO, Akasaka K, Williamson MP. Pressure-induced changes in the solution structure of the GB1 domain of protein G. Proteins. 2008;71:1432–1440. doi: 10.1002/prot.21832. [DOI] [PubMed] [Google Scholar]
- 34.Saio T, Ogura K, Yokochi M, Kobashigawa Y, Inagaki F. Two-point anchoring of a lanthanide-binding peptide to a target protein enhances the paramagnetic anisotropic effect. J Biomol NMR. 2009;44:157–166. doi: 10.1007/s10858-009-9325-z. [DOI] [PubMed] [Google Scholar]
- 35.Balayssac S, Jiménez B, Piccioli M. Assignment strategy for fast relaxing signals: complete aminoacid identification in thulium substituted calbindin D9K. J Biomol NMR. 2006;34:63–73. doi: 10.1007/s10858-005-5359-z. [DOI] [PubMed] [Google Scholar]
- 36.Mueller GA, Kirby TW, DeRose EF, Li D, Schaaper RM, London RE. Nuclear magnetic resonance solution structure of the Escherichia coli DNA polymerase III θ subunit. J Bacteriol. 2005;187:7081–7089. doi: 10.1128/JB.187.20.7081-7089.2005. [DOI] [PMC free article] [PubMed] [Google Scholar]
- 37.Schmitz C, Stanton-Cook MJ, Su XC, Otting G, Huber T. Numbat: an interactive software tool for fitting Δχ-tensors to molecular coordinates using pseudocontact shifts. J Biomol NMR. 2008;41:179–189. doi: 10.1007/s10858-008-9249-z. [DOI] [PubMed] [Google Scholar]
- 38.Su XC, Liang H, Loscha KV, Otting G. [Ln(DPA)3]3− is a convenient paramagnetic shift reagent for protein NMR studies. J Am Chem Soc. 2009;131:10352–10353. doi: 10.1021/ja9034957. [DOI] [PubMed] [Google Scholar]
- 39.Bertini I, Del Bianco C, Gelis I, Katsaros N, Luchinat C, Parigi G, et al. Experimentally exploring the conformational space sampled by domain reorientation in calmodulin. Proc Natl Acad Sci USA. 2004;101:6841–6846. doi: 10.1073/pnas.0308641101. [DOI] [PMC free article] [PubMed] [Google Scholar]
- 40.Chandrasekhar K, Krause G, Holmgren A, Dyson HJ. Assignment of the 15N NMR spectra of reduced and oxidized Escherichia coli thioredoxin. FEBS Lett. 1991;284:178–183. doi: 10.1016/0014-5793(91)80679-w. [DOI] [PubMed] [Google Scholar]
- 41.Lemaster DM, Richards FM. NMR sequential assignment of Escherichia coli thioredoxin utilizing random fractional deuteriation. Biochemistry. 1988;27:142–150. doi: 10.1021/bi00401a022. [DOI] [PubMed] [Google Scholar]
- 42.Jensen MR, Led JJ. Metal–protein interactions: structure information from Ni2+-induced pseudocontact shifts in a native nonmetalloprotein. Biochemistry. 2006;45:8782–8787. doi: 10.1021/bi0604431. [DOI] [PubMed] [Google Scholar]
- 43.Baig I, Bertini I, Del Bianco C, Gupta YK, Lee YM, Luchinat C, Quattrone A. Paramagnetism-based refinement strategy for the solution structure of human α-parvalbumin. Biochemistry. 2004;43:5562–5573. doi: 10.1021/bi035879k. [DOI] [PubMed] [Google Scholar]
- 44.Bertini I, Kursula P, Luchinat C, Parigi G, Vahokoski J, Wilmanns M, Yuan J. Accurate solution structures of proteins from X-ray data and a minimal set of NMR data: calmodulin–peptide complexes as examples. J Am Chem Soc. 2009;131:5134–5144. doi: 10.1021/ja8080764. [DOI] [PubMed] [Google Scholar]
- 45.DeRose EF, Li DW, Darden T, Harvey S, Perrino FW, Schaaper RM, London RE. Model for the catalytic domain of the proofreading epsilon subunit of Escherichia coli DNA polymerase III based on NMR structural data. Biochemistry. 2002;41:94–110. doi: 10.1021/bi0114170. [DOI] [PubMed] [Google Scholar]
- 46.Schmitz C, John M, Park AY, Dixon NE, Otting G, Pintacuda G, Huber T. Efficient χ-tensor determination and NH assignment of paramagnetic proteins. J Biomol NMR. 2006;35:79–87. doi: 10.1007/s10858-006-9002-4. [DOI] [PubMed] [Google Scholar]
Associated Data
This section collects any data citations, data availability statements, or supplementary materials included in this article.