

An optical trap is used to stop chromosome movement in spermatocytes from an insect and a flatworm and to stop pole movement in PtK cells. The forces required are much smaller than previously believed.
Abstract
We used a trapping laser to stop chromosome movements in Mesostoma and crane-fly spermatocytes and inward movements of spindle poles after laser cuts across Potorous tridactylus (rat kangaroo) kidney (PtK2) cell half-spindles. Mesostoma spermatocyte kinetochores execute oscillatory movements to and away from the spindle pole for 1–2 h, so we could trap kinetochores multiple times in the same spermatocyte. The trap was focused to a single point using a 63× oil immersion objective. Trap powers of 15–23 mW caused kinetochore oscillations to stop or decrease. Kinetochore oscillations resumed when the trap was released. In crane-fly spermatocytes trap powers of 56–85 mW stopped or slowed poleward chromosome movement. In PtK2 cells 8-mW trap power stopped the spindle pole from moving toward the equator. Forces in the traps were calculated using the equation F = Q′P/c, where P is the laser power and c is the speed of light. Use of appropriate Q′ coefficients gave the forces for stopping pole movements as 0.3–2.3 pN and for stopping chromosome movements in Mesostoma spermatocytes and crane-fly spermatocytes as 2–3 and 6–10 pN, respectively. These forces are close to theoretical calculations of forces causing chromosome movements but 100 times lower than the 700 pN measured previously in grasshopper spermatocytes.
INTRODUCTION
This article deals with measurements of mitotic forces using optical traps. As put succinctly by Mitchison and Salmon (2001), “To understand spindle mechanics it has long been clear that we need to measure the forces acting in the spindle.” Knowing the forces involved places important limits on the many models of how chromosomes move and of how spindle poles are kept apart (Mitchison et al., 1986, 2005; Forer and Wilson, 1994; Pickett-Heaps et al., 1996; Pickett-Heaps and Forer, 2009; Cameron et al., 2006; Johansen and Johansen, 2007; Johansen et al., 2011; Dumont and Mitchison, 2009; Goshima and Scholey, 2010).
The only direct attempt to measure the force to move anaphase chromosomes in living cells was in grasshopper spermatocytes (Nicklas, 1983). Nicklas (1983) used state-of-the-art techniques to make this measurement, and his experiments were instrumental in calling attention to the importance of determining mitotic forces. He hooked anaphase chromosomes with calibrated micromanipulation needles and calculated the force needed to slow or stop chromosome movement from the amount of bend in the needles. He concluded that whereas a force of 10−5 dynes (1 pN) “had little or no effect on chromosome velocity,” to stop anaphase movement 100% of the time, he needed to apply 700 pN to the chromosome. These measured values are almost three orders of magnitude higher than theoretical values calculated using Stokes’ law (Gruzdev, 1972), the Einstein–Stokes equation (Nicklas, 1965; Taylor, 1965; Alexander and Rieder, 1991), and, more recently, Young's modulus (Marshall et al., 2001), as seen in Table 1. The calculations using Young's modulus require knowledge of the size and elasticity of the chromosome (Houchmandzadeh et al., 1997); all others require knowledge of the velocity of chromosome movement, the size of the chromosome, and the viscosity of the spindle (Nicklas, 1965). The forces to move anaphase chromosomes were calculated as 0.1–0.7 pN, whereas the force calculated to move prometaphase chromosomes was considerably higher (10 pN). Prometaphase chromosomes move in those cells by sliding along microtubules, not with microtubules extending between kinetochores and the pole (Rieder and Alexander, 1990), and they move 10 times faster than anaphase chromosomes. Thus, as discussed by Marshall et al. (2001), if the force calculated by Alexander and Rieder (1991) is extrapolated to anaphase, it would be closer to 1 pN. Overall, then, the forces calculated as acting on the kinetochore during anaphase range from 0.1 to 1 pN. The greatest uncertainty in the calculations using viscosity is in determining the viscosity in the spindle per se instead of measuring Brownian motion of particles close to but outside the spindle (Taylor, 1965; Schaap and Forer, 1979; Alexander and Rieder, 1991). The calculation of 0.7 pN using Young's modulus does not use viscosity, however, but instead chromosomal elasticity, which gives added confidence that the theoretical value for force needed to move an anaphase chromosome is in the range 0.1–1.0 pN.
TABLE 1:
Summary of the calculated and measured forces required to move chromosomes during mitosis in various organisms.
| Reference | Organism | Force (pN) | Force (dyne) | Type of calculation | Viscosity used in calculation (cP) | Elasticity used in calculation (Pa) | Mitotic stage |
|---|---|---|---|---|---|---|---|
| Nicklas (1965) | Grasshopper | 0.1 | 1 × 10⁻⁸ | Einstein–Stokes equation | 100a | Anaphase | |
| Taylor (1965) | Newt | 0.12 | 1.2 × 10⁻⁸ | Einstein–Stokes equation | 300b | Anaphase | |
| Gruzdev (1972) | Haemanthus | 0.06 | 6 × 10⁻⁹ | Stokes’ equation | 50a | Anaphase | |
| Alexander and Rieder (1991) | Newt | 10 | 1 × 10⁻⁶ | Einstein–Stokes equation | 282b | Prometaphase | |
| Marshall et al. (2001) | Drosophila | 0.7 | 7 × 10⁻⁸ | Young's modulus | 38 | Anaphase | |
| Nicklas (1983) | Grasshopper | 700 | 7 × 10⁻⁵ | Measured value | Anaphase |
aViscosity values were assumed based on measurements of cytoplasmic viscosities.
bViscosity was measured in the spindle using the Brownian motion of particles.
Because of the discrepancy between measurement and theory and the importance of verifying conclusions using different methods, we used optical trapping (optical tweezers) to measure mitotic forces in several phylogenetically diverse spindles: spermatocytes from the flatworm Mesostoma, spermatocytes from the crane fly Nephrotoma suturalis, and mitotic Potorous tridactylus (rat kangaroo) kidney (PtK) cells.
Optical tweezers produce force on small objects because of the refraction of light entering and leaving the object (Ashkin et al., 1986). They have been used to estimate the drag force acting on chromosome fragments in newt cells (Liang et al., 1994), the swimming force of sperm cells (Nascimento et al., 2007), and the force of molecular motors driving mitochondria (Ashkin et al., 1990), among other intracellular forces (Ashkin, 1997). The optical trap, a laser at wavelength 1064 nm, produces minimal optical damage to living cells (Ashkin et al., 1987). The very slight absorption of this wavelength by water may result in 1ºC rise in temperature per 100 mW in the focused spot (Liu et al., 1994, 1995). The “trapped” object is held in the trap and moves when the trap moves. If there is an intracellular force on the object, the object will not be held in the trap unless the laser trap exerts more force than the intracellular force. In our experiments, the trap was focused onto either moving chromosomes or moving poles. The laser power (therefore, the corresponding force) was increased until the velocity of the chromosome or the pole decreased to zero. The stopping force was calculated from the laser power in the plane of focus of the microscope objective. This method gives values for the stopping force considerably closer to the theoretical values of 0.1–1 pN than to Nicklas’ (1983) value of 700 pN.
RESULTS
Mesostoma ehrenbergii spermatocytes
Mesostoma spermatocytes have five pairs of chromosomes, three bivalents with bipolar orientation, and four unpaired univalents at the spindle poles (Oakley and Jones, 1982; Fuge, 1987; Croft and Jones, 1989), as shown in Figure 1A. Mesostoma spermatocytes do not have a defined metaphase. Instead, bivalent kinetochores oscillate to and from the spindle poles (Fuge, 1987, 1989) for at least 1 or 2 h from early prometaphase until anaphase (Figure 1, B and C). This occurs regularly over a distance of ∼4 μm (range, 1–6 μm) and with a velocity that averages 6 μm/min (range, 1.63–11.6 μm/min). Microtubules extend between the poles and the kinetochores as the kinetochores oscillate (Figure 1, D–F; Fuge and Falke, 1991), and thus these movements are more like anaphase movements than prometaphase movements where chromosomes slide along microtubules. Each kinetochore changes direction at ∼90-s intervals (Table 2). The univalent chromosomes remain at the poles throughout prometaphase and move between poles irregularly (Oakley, 1983, 1985) with velocities of up to 20 μm/min.
Figure 1:

(A) Fixed and sectioned Mesostoma spermatocyte taken from Husted and Ruebush (1940), showing three bivalents and four univalents. The arrow labeled K points to the kinetochore of a bivalent, and the arrow labeled C points to a chiasma. (B) Montage of phase contrast microscope images of a Mesostoma spermatocyte, illustrating a bivalent as it moves to and away from the spindle poles during prometaphase/metaphase. The arrows indicate the position of the kinetochores. Mesostoma spermatocytes have a precocious cleavage furrow, which begins ingression when bivalents achieve bipolar orientation in prometaphase and then stalls, giving the spermatocytes a dumbbell-shaped appearance (Forer and Pickett-Heaps, 2010). Bar, 10 μm. (C) Distance of the kinetochores of partner half-bivalents from the edge of the cell (pole) in micrometers vs. time in minutes in an M. ehrenbergii spermatocyte. In this cell the average away-from-pole velocity is 6.9 μm/min and the average to-the-pole velocity is 7.5 μm/min. (D–F). Electron microscopy images of a Mesostoma spermatocyte. (D) A low-magnification overview image of a Mesostoma spermatocyte, illustrating two half-bivalents and two univalents at the upper pole. (E) Higher-magnification image of D illustrating the two kinetochores (K) of two half-bivalents and the centriole (C), which is embedded in the pericentriolar material. (F) Higher-magnification image of the kinetochore (K) of the right half-bivalent from E, illustrating microtubules terminating at the kinetochore. Bar, 1 μm.
TABLE 2:
Summary of the velocity, amplitude, and period of kinetochore movement to the pole and away from the pole of control cells in Mesostoma spermatocytes.
| Kinetochore movement | Number of KTs measured | Range of velocities (μm/min) | Average velocity (μm/min) | Amplitude (μm) | Period (s) |
|---|---|---|---|---|---|
| Away from the pole | 74 | 1.63–9.83 | 5.19 ± 1.78 | 4.0 ± 1.15 | 89 ± 22.1 |
| To the pole | 73 | 1.92–11.6 | 6.41 ± 2.25 | ||
| Combined | 147 | 1.63–11.6 |
Average values ± SD. Difference between to-the-pole and away-from-the-pole kinetochore movement, p = 0.0004 (t = 3.63).
Trapping kinetochores in Mesostoma spermatocytes
Single kinetochores in prometaphase Mesostoma spermatocytes were trapped as the kinetochore either moved to or away from the pole. The trap was at the edge of the kinetochore (Figure 2A), which was identified by position, based on electron microscopy studies (Figure 1, D–F; Fuge and Falke, 1991). Laser powers were adjusted in the point of focus from 1 to >68 mW to determine the lowest power that would stop chromosome movement and allow chromosome movement to resume when the trap was turned off. Seventy-eight kinetochores were trapped. The minimum laser power to consistently either stop kinetochore movements or decrease oscillation amplitudes, after which kinetochores resumed movement when the laser was turned off, was 15–23 mW (Figure 3 and Table 3). The movement that resumed was not always normal: the amplitudes of the oscillations often were irregular and often were decreased by 1–3 μm. The absence of oscillations as regular as before trapping does not indicate damage to the kinetochore, because similar effects occur after treatments that affect solely spindle fibers: irregular oscillations with reduced amplitudes generally occur after recovery from ultraviolet microbeam irradiation of kinetochore fibers, as well as during initial recovery from Taxol treatment. Normal anaphase nonetheless occurs after either of these treatments (unpublished data).
Figure 2:

(A) Schematic of a bivalent from an M. ehrenbergii spermatocyte. The red and blue circles represent the positions of the kinetochores. The red square represents the position at which the optical tweezers were applied to the blue kinetochore. (B) Distance of the kinetochores of partner half-bivalents from the edge of the cell (pole) in micrometers vs. time in minutes in a Mesostoma spermatocyte. A power of 21.2 mW was applied to each kinetochore, first by trap 1 and then by trap 2. When trap 1 was applied, the amplitude of kinetochore (blue circles) movement away from the pole decreased and then stopped. When trap 1 was released, kinetochore movement resumed with irregular oscillations. When trap 2 was applied, kinetochore movement (red circles) decreased and then stopped. When trap 2 was released, kinetochore movement did not resume, but we may not have followed the kinetochore long enough to determine whether kinetochore movement would have resumed.
Figure 3:

Power range in the trap (in milliwatts) used to stop kinetochore movement, decrease the amplitude of kinetochore movement, or have no effect on kinetochore movement.
TABLE 3:
Summary of the effect of varying powers in the trap on kinetochore movement when applied to the kinetochore in Mesostoma spermatocytes.
| Trapping kinetochores in M. ehrenbergii spermatocytes | ||||||||
|---|---|---|---|---|---|---|---|---|
| Power at the focus (26% of power at back focal plane) (mW) | Stops movement and recovers | Stops movement and no recovery | Decreases amplitude | No effect | Total | Stopped kinetochore movement | Decreased amplitude | Stopped movement or decreased amplitude |
| <15 | 9 (29%) | 2 (6%) | 9 (29%) | 11 (35%) | 31 | 35% | 29% | 64% |
| 15– 23 | 7 (29%) | 12 (50%) | 5 (21%) | 0 | 24 | 79% | 21% | 100% |
| 25–35 | 0 | 15 (70%) | 5 (25%) | 1 (5%) | 21 | 70% | 25% | 95% |
| >68 | 0 | 2 (100%) | 0 | 0 | 2 | 100% | 0% | 100% |
| Total | 16 (21%) | 31 (40%) | 19 (24%) | 12 (15%) | 78 | |||
In our experiments, when placed in the trap a kinetochore either immediately stopped moving (19 of 26) or stopped moving after oscillating with decreased amplitude (Figure 2B). When the trap stopped movement of one kinetochore, the sister (partner) kinetochore was not affected in 17 of 21 spermatocytes in which the sister kinetochore was visible (Figure 2B). Thus the effects are localized to the trapped region.
Chromosomes were trapped when moving to the pole and when moving away from the pole (Table 4). However, more data are needed to determine whether different forces are required. Cells generally were not followed long enough to see whether they entered anaphase, but anaphase was completed in four spermatocytes in which chromosomes were trapped using 5–23 mW. In two of four cells, bivalents entered anaphase as kinetochore movement was stopped by the trap (e.g., Figure 4). In the other spermatocytes (two of four), bivalents entered anaphase 5–15 min after being released from the trap. Thus the trap does not seem to harm either the trapped chromosomes or the cells.
TABLE 4:
The effect of varying powers in the trap on kinetochore movement in Mesostoma spermatocytes.
| A. Kinetochore moving to the pole | |||||
|---|---|---|---|---|---|
| Power at the focus (26% of power at back focal plane) (mW) | Stops movement and recovers | Stops movement and no recovery | Decreases amplitude | No effect | Total |
| <15 | 6 (32%) | 1 (5%) | 6 (32%) | 6 (32%) | 19 |
| 15–23 | 3 (20%) | 8 (53%) | 4 (27%) | 0 | 15 |
| 25–35 | 0 | 9 (64%) | 3 (21%) | 2 (14%) | 14 |
| >68 | 0 | 2 (100%) | 0 | 0 | 2 |
| Total | 9 (18%) | 20 (40%) | 13 (26%) | 8 (16%) | 50 |
| B. Kinetochore moving away from pole | |||||
| Power at the focus (26% of power at back focal plane) (mW) | Stops movement and recovers | Stops movement and no recovery | Decreases amplitude | No effect | Total |
| <15 | 2 (16%) | 1 (8%) | 4 (33%) | 5 (42%) | 12 |
| 15–23 | 4 (44%) | 4 (44%) | 1 (11%) | 0 | 9 |
| 25–35 | 0 | 6 (86%) | 0 | 1 (14%) | 7 |
| >68 | 0 | 0 | 0 | 0 | 0 |
| Total | 6 (21%) | 11 (39%) | 5 (19%) | 6 (21%) | 28 |
Figure 4:
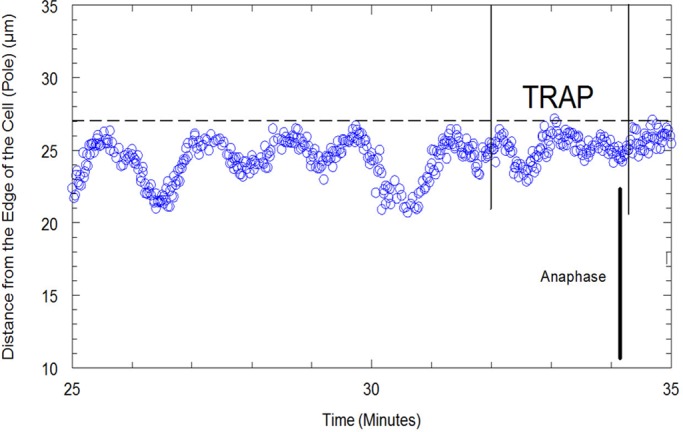
Distance of a kinetochore from the edge of the cell (pole) in micrometers vs. time in minutes in a Mesostoma spermatocyte. A power of 15.3 mW was applied by the trap to the kinetochore. The time the trap was turned on is represented by the first solid line, and the time the trap was turned off is represented by the second solid line. When the trap was applied, the amplitude of kinetochore movement (blue circles) away from the pole decreased and then stopped. The bivalent entered into anaphase before the trap was released from the kinetochore. The spindle pole is represented by the dashed line.
A single univalent kinetochore was trapped as it moved from one spindle pole to the other. A trap power of 15 mW applied to the kinetochore caused the velocity to decrease from 2.4 to 0.33 μm/min and then stop (Figure 5). When the trap was removed, the univalent moved toward the pole with its original velocity (Figure 5). Therefore, 15 mW also stops movements of reorienting univalents, although we do not know whether univalents move because they slide along microtubules or because of fibers attached to their kinetochores.
Figure 5:
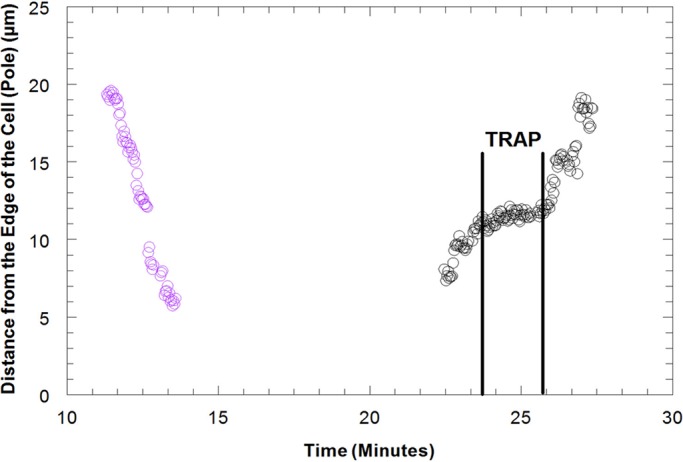
Distance of the kinetochore of a univalent from the edge of the cell (pole) in micrometers vs. time in minutes as the univalent moves from the upper spindle pole to the lower spindle pole and then from the lower spindle pole back to the upper spindle pole in a Mesostoma spermatocyte. The univalent (purple circles) moved from the upper pole to the lower pole with a velocity of ∼7.0 μm/min. A power of 15 mW in the trap, illustrated by the two vertical lines, was applied as the univalent reoriented and segregated from the lower pole back to the upper pole. The trap caused the univalent to decrease in velocity to 0.33 μm/min and then stop. When the trap was released, the univalent moved to the upper pole with its original velocity.
Trapping kinetochores in crane-fly spermatocytes
We extended our results to insects by measuring the laser power required to stop chromosome movement in crane-fly spermatocytes. For cells in anaphase I the traps were applied to the kinetochores, whose positions were known from previous polarizing and fluorescence microscope images (Forer, 1965; Wilson and Forer, 1989). For cells in prometaphase, bivalents were cut in two pieces with the cutting laser scissors (Harsono et al., 2013); the resulting two pieces moved to opposite poles at the same speed as anaphase chromosomes. They were led by their kinetochores, and the movement was likely due to the same forces that propel anaphase chromosomes. The trap was placed at one kinetochore, and the chromosome piece moving to the other pole was used as a control. In our sample of 25 cells, consisting of 36 trapping experiments, chromosome movements were stopped consistently with trap powers of 56–85 mW (Figure 6 and Table 5). This is two to four times higher than the power needed to consistently stop kinetochore movements in Mesostoma spermatocytes.
Figure 6:
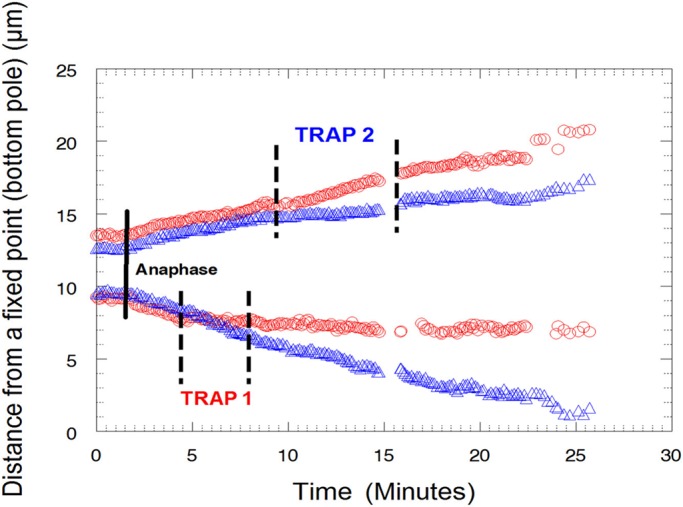
Distance of the kinetochores of two partner half-bivalents in anaphase from a fixed point (bottom pole) in micrometers vs. time in minutes in a crane-fly spermatocyte. A power of 49.4 mW was applied to the lower half-bivalent kinetochore (red circles) and then 62.4 mW to the upper half-bivalent kinetochore (blue triangles). When trap 1 was applied, chromosome movement (red circles) stopped and the partner half-bivalent was not affected. When trap 1 was released, chromosome movement resumed with a slower velocity. When trap 2 was applied, chromosome movement (blue triangles) stopped and its partner was not affected. When trap 2 was released, chromosome movement resumed with a slower velocity.
TABLE 5:
Summary of the effect of varying powers in the trap on chromosome movement when applied to the kinetochore of anaphase chromosomes or cut prometaphase bivalents in crane-fly spermatocytes.
| Cut prometaphase bivalent or anaphase chromosome movement | ||||||||
|---|---|---|---|---|---|---|---|---|
| Power at the objective (26% of power at back focal plane) (mW) | Stops movement and recovers | Stops movement and no Recovery | Decrease in velocity | No effect | Total | Percentage of stopped KT movement (%) | Percentage of decreased velocity (%) | Stopped movement or decreased velocity (%) |
| 25–55 | 8 (50%) | 0 | 3 (19%) | 5 (31%) | 16 | 50 | 19 | 69 |
| 56–85 | 9 (69%) | 1 (8%) | 2 (15%) | 1 (8%) | 13 | 77 | 15 | 92 |
| 86–140 | 3 (43%) | 1 (14%) | 2 (29%) | 1 (14%) | 7 | 57 | 29 | 86 |
| Total | 20 (56%) | 2 (6%) | 7 (19%) | 7 (19%) | 36 | |||
Trapping spindle poles in PtK2 cells
Because the Mesostoma and crane-fly experiments were in meiotic invertebrate cells, we extended our studies to a mitotic vertebrate system. Laser microbeam cutting of metaphase spindles in tubulin-labeled PtK2 cells results in movement of spindle poles toward the spindle equator (Baker, 2010; Sheykhani et al., 2013). We measured the laser power required to slow or stop movement of the spindle poles. Because spindle poles are held apart when poleward forces act on chromosomes, there must be equal and opposite forces on poles and kinetochores. Therefore the forces holding spindle poles apart are expected to be similar to the forces pulling the chromosomes poleward (e.g., McIntosh and Pfarr, 1991). In 13 of 16 control cells the pole on the cut side moved toward the equator within 10–30 s after irradiation; in 3 of 16 control cells movement began within 60–90 s (Figure 7A). The unirradiated pole moved toward the equator after this, resulting in a shorter but symmetric spindle (Figure 7B; Sheykhani et al., 2013). A 7.8-mW trap was placed at one pole of metaphase PtK2 cells (Figure 7C) either before or after a laser microbeam cut was made across the entire half-spindle associated with that pole. The cells were followed 2–3 min after irradiation. Trapping the irradiated pole stopped the inward movement of the pole after irradiation in 4 of 6 cells (Figure 7D and Table 6). There was no change in fluorescence at the pole when the trap was applied, indicating that the trapping laser did not damage the spindles poles. In addition, normal microtubule immunofluorescence was seen when a 44.5-mW trap was applied to the kinetochore (Figure 8).
Figure 7:

(A) Time range required (in seconds) for the irradiated pole to start to move toward the equator after laser microbeam irradiation during metaphase in PtK2 cells. (B) Distance of the irradiated and unirradiated poles from the equator in micrometers vs. time in minutes. The vertical line represents the time of the irradiation. The pole on the irradiated side moved toward the equator first soon after the irradiation. (C) PtK2 irradiated cell illustrating the position of the trap (red square) at the spindle pole and the line cut across the spindle. Bar, 10 μm. (D) Distance of the irradiated and unirradiated poles from the equator in micrometers vs. time in minutes. The vertical lines represent the time of the irradiation when the trap was turned on and when the trap was turned off. A trapping power of 7.8 mW was applied to the spindle pole of the irradiated metaphase half-spindle. When the trap was applied, the irradiated pole and the unirradiated pole did not move toward the equator.
TABLE 6:
Summary of the laser microbeam irradiation on the irradiated half-spindle in control PtK2 cells and in trapped PtK2 cells with a power of 7.8 mW.
| Control cells | Trapped cells | |
|---|---|---|
| Number of cells with movement of irradiated pole | 16 | 2 |
| Number of cells with no movement of either pole | 0 | 4 |
| Total | 16 | 6 |
Figure 8:
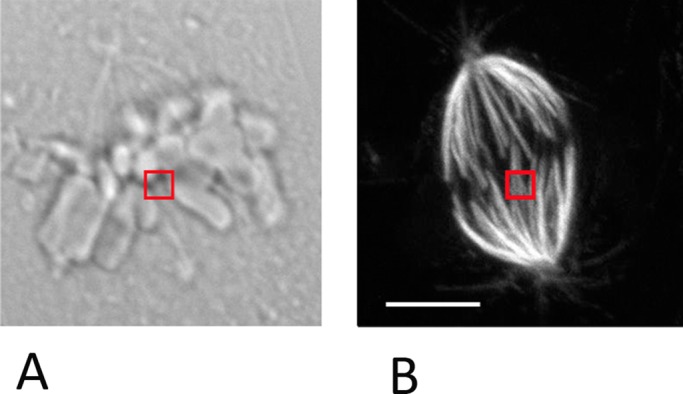
(A) Differential interference contrast image of a PtK cell, illustrating the position of the trap at the interface between the kinetochore and the kinetochore microtubules. The trap is represented by the red square. The trap was applied for 4 min with a power of 44.5 mW. (B) The PtK cell from Figure 4E stained with tubulin antibody. No damage to the microtubules is visible in the region in which the trap was applied (red square). Bar, 10 μm.
DISCUSSION
We report optical trap laser powers that stop kinetochore oscillations in Mesostoma spermatocytes, stop poleward chromosome movements in anaphase and prometaphase crane-fly spermatocytes, and stop the pole from moving after laser cuts across metaphase spindles in PtK2 vertebrate cells.
To convert milliwatts of laser power to trapping force, the basic formula is F = nQP/c, where F is the force, n is the refractive index of the object being trapped divided by the refractive index of the surroundings (Ashkin, 1992; Konig et al., 1996), P is the power in the trap, and c is the speed of light. Q is a conversion factor that, for objects that absorb some of the trap, has a range of 0–1, where 1 is equivalent to total absorption (Ashkin, 1992; Svoboda and Block, 1994a; Konig et al., 1996; Neuman and Block, 2004). Q is the fraction of momentum transferred to a trapped object, and its value determines whether an object will be trapped (Wright et al., 1994). Of the elements of this equation, P is determined experimentally. There are reasonable estimates of n for spindles and chromosomes (Barer, 1957; Forer et al., 1980). Q values are a bit more problematic but can be determined experimentally or calculated, but only for regularly shaped objects such as spheres (Svoboda and Block, 1994a; Gahagan and Swartzlander, 1998; Neuman and Block, 2004).
Our conversion of trap power to force relies on data of Liang et al. (1994), who trapped chromosomes in newt spindles and presented both the power used in the trap and the resultant forces that acted on the chromosomes. Chromosome shapes and relative refractive indices of spindles and chromosomes are similar in newt cells to those in most mitotic cells. To convert power to force, we used the basic formula F = nQP/c and the power and force values from Liang et al. (1994) to calculate an equivalent Qn (Q′) of 0.0341, and from this Q′ value we converted our power values to piconewtons of the trap. The results (see Table 8 later in the paper) indicate that chromosome oscillations in Mesostoma spermatocytes are stopped (or “slowed”) with trapping forces of 2–3 pN and poleward movements of crane-fly spermatocyte chromosomes are stopped or slowed with poleward forces of 6–10 pN. From other experiments in which forces and power were given, we calculated Q′ values for other objects (Table 7) and used these to estimate the forces applied to PtK spindle poles to stop their movement toward the equator. Because centrioles are about the same size as mitochondria and both appear as phase dark dots in the cell cytoplasm, we used Q′ = 0.012, the value for trapping mitochondria (Table 7). This assumes that the trap at the spindle pole acts on the centriolar apparatus (centrosome). It is possible that instead the trap might act on astral microtubules. We therefore also calculated force based on the Q′ value of 0.09 for trapping microtubules (Table 7). Using these values, we calculated the forces pulling PtK spindle poles to the equator to be 0.31–2.3 pN (Table 8). These values are close to the forces that stop the invertebrate meiotic chromosomes.
TABLE 8:
Forces calculated using F = Q′P/c, with appropriate Q′ values derived from the literature (see the text).
| Power (mW) | Force (pN) | ||||
|---|---|---|---|---|---|
| Q′ = 0.0341 | Q′ = 0.012 | Q′ = 0.09 | No Q′ | ||
| Mesostoma spermatocyte | 15–23 | 1.7–2.6 | |||
| Crane-fly spermatocyte | 56–85 | 6.3–9.6 | |||
| PtK2 pole movement | 7.8 | 0.31 | 2.34 | ||
| PtK2 anaphase chromatid movementa (Liang et al. 1991) | 36 | 4 | |||
| Theoretical force values | N/A | 0.06–10 | |||
| Previously measured value | N/A | 700 | |||
The theoretical and previously measured force values are included for comparison. N/A, not applicable.
aA trap of 60 mW to chromatid arms at the start of anaphase reversibly stopped anaphase chromatid movement. The authors used 60 mW measured at the objective, and because of the 60% transmission of the lens, the power was 36 mW at the specimen.
TABLE 7:
Comparison of Q′ values calculated from articles that gave values for laser power and its equivalent force.
| Reference | Object being trapped | Q′ (calculated) | Stated power | Force estimated by an independent method (pN) | Wavelength used (nm) |
|---|---|---|---|---|---|
| Coated beads | |||||
| Sato et al. (1991) | 3-μm beads (latex) | 0.18 | 5 mW | 3 | 1330 |
| Wright et al. (1993) | 1-μm beads (silica) | 0.017 | 0.1 mW | 0.0056 | 1064 |
| 10-μm beads (polystyrene) | 0.16 | 0.56 mW | 0.3 | ||
| Svoboda and Block (1994b) | Kinesin-coated beads | 0.03 | 62.5 mW | 5–6 | 1064 |
| Yin et al. (1995) | RNA polymerase–coated beads | 0.05 | 82 mW | 13.6 | Not given |
| Simmons et al. (1996) | 3-μm beads | 0.12 | 100 mW | 40 | 1064 |
| Biological specimens | |||||
| Ashkin et al. (1990) | Mitochondria | 0.012 | 63 mW | 2.6 | Not given |
| Liang et al. (1994) | Chromosome fragments | 0.034 | 264 mW | 30 | 1064 |
| Kurachi et al. (1995) | Microtubules | 0.09 | 1 mW | 0.3 | 647.1 |
| 25 mW | 7.5 | ||||
| Konig et al. (1996) | Sperm heads | 0.16 | 150 mW | 82 | 800 |
| Kellermayer et al. (1998) | Unfolding titin | 0.08 | 1.5 W | 400 | 1064 |
Q’ values were calculated using the equation Q′ = cF/P.
It is significant that our values for the stopping force for chromosome movements are two orders of magnitude smaller than the 700 pN reported for grasshopper spermatocytes (Nicklas, 1983) but are close to the 0.1- to 1-pN theoretical forces calculated for stopping anaphase chromosomes (Table 1). The forces determined in our experiments are comparable to those of motor molecules and of motile sperm that were measured using optical tweezers: 1.7 pN for myosin (Molloy et al., 1995); 2.6 pN for a single motor molecule driving mitochondria (Ashkin et al., 1990); 5–6 pN for kinesin molecules (Svoboda and Block, 1994b); 9.2 pN for the unbinding of actin and myosin (Nishizaka et al., 1995); and 44 pN for the motion of healthy sperm (Konig et al., 1996). Because of the large difference between our values and those reported previously, we need to consider whether our numbers could be erroneously low. One consideration is to evaluate the force estimate of Liang et al. (1994) from which we derived Q′.
Liang et al. (1994) measured velocities of chromosome fragments moved through the cytoplasm by an optical trap; they estimated the force that they applied to the chromosomes from the maximum velocity, the viscosity of the cytoplasm, and the shapes of the chromosomes. The minimum value applied to the chromosomes by the trap was 30 pN. Large errors are not likely to have arisen from the velocities and shapes since they were measured directly from video images. The viscosity value of 280 cP was based on measurements of Alexander and Rieder (1991). This viscosity is <10% different from the 300 cP measured by Taylor (1965) for spindles of the same cell type. Other estimates of spindle viscosity in other cell types are lower than this (e.g., Schaap and Forer, 1979; Table 1). Thus any error in the viscosity would be on the high side, and reducing their viscosity value would decrease our force estimates and not increase them. With regard to the power in the trap, Liang et al. (1994) recorded the power of the trap as 440 mW “at the microscope objective.” Because in an earlier article (Liang et al., 1993) the trap power was measured “at the objective focal plane,” we reduced 440 mW to 264 mW for our conversion of power to force to take into account the 60% transmission of the objective (Liu et al., 1995, 1996). The power measurement should not introduce much error into our determination. The final consideration is whether the refractive index ratio in the calculation might be erroneous. The largest the ratio can be for aqueous biological material is 1.17, the ratio of a solid (n = 1.56) to that of water (n = 1.33), or a ratio of 1.15 for spindle refractive indices of 1.36 (Forer et al., 1980). Errors in this refractive index ratio (n) thus could not give rise to differences of more than 10–15% in the final force calculation. Overall, although we would not argue that our estimates of force are necessarily accurate to within <50%, especially considering the biological variability (Tables 3 and 5), we do not think that errors from converting trapping power to force on chromosomes can account for the two-orders-of-magnitude difference between our values and those of Nicklas (1983).
A possible explanation for the differences between our values and those of Nicklas (1983) is that the laser trap did not stop movement because of its force but rather because it either damaged the kinetochore directly or damaged kinetochore microtubules (Liu et al., 1995; Neuman and Block, 2004). Several lines of evidence argue against this. The trapping laser wavelength (1064 nm) has minimal effect on biological specimens because cells and their organelles are generally transparent to this wavelength (Liang et al., 1996; Neuman and Block, 2004). Damage from the trap is extremely unlikely because after being released from the trap the stopped Mesostoma spermatocyte kinetochores resume movements and the cells enter anaphase. In addition, previous studies demonstrated that cells survive and can be cloned into viable populations after exposure to this wavelength (Liu et al., 1996). Using the same wavelength, an average temperature increase of 1.0°C/100 mW was measured when trapping motile sperm heads, but this increase in temperature did not alter the cellular DNA of the sperm (Liu et al., 1996). If anything, in our experiments, a temperature increase of a few degrees should speed up chromosome movement, not retard it. In addition, for equivalent trapping powers (4–160 mW), Escherichia coli were able to reproduce while in the trap, yeast were able to bud into clumps while in the trap, and there was no change in the flexibility of red blood cells or damage to organelles of protozoa after trapping (Ashkin et al., 1987; Ashkin, 1992; Aufderheide et al., 1992). Furthermore, microtubules were unaffected when kinesin-coated beads were trapped with optical tweezers in vitro (Kuo and Sheetz, 1993). Microtubules were unaffected when they were bent with optical tweezers to measure flexural rigidity, and after release from the trap the microtubules returned to their original positions (Kurachi et al., 1995; Felgner et al., 1996). Further, in our experiments, PtK cell microtubules were not damaged by powers used to trap Mesostoma and crane-fly spermatocyte kinetochores (21 and 44.5 mW; Figure 8). Furthermore, in Mesostoma spermatocytes, chromosome movement resumed immediately after the trap was turned off (at powers <23 mW). In addition, movements of other chromosomes or partner half-bivalents were not affected in either Mesostoma or crane-fly spermatocytes. Bivalents in Mesostoma spermatocytes entered into anaphase even in the presence of the trap (Figure 4), and anaphase crane-fly spermatocyte chromosomes resumed movement when released from the trap (Figure 6). This large body of data supports the conclusion that chromosome movements were stopped because of the trapping force acting on the chromosome, not because of deleterious effects of the trap. Therefore optical damage to the cells is unlikely to have caused the discrepancy between our force measurements and those reported by Nicklas (1983).
It does not seem likely that the discrepancy between our measured force values and those of Nicklas (1983) is due to species differences between grasshopper spermatocytes and the cells that we used, because the mitotic forces we measured were similar in Mesostoma spermatocytes, crane-fly spermatocytes, and PtK2 cells. This includes a diverse phylogenetic range of organisms and cell types. In fact, the similarity in forces in this broad range of spindles suggests that the amount of force needed to move chromosomes on either the meiotic or mitotic spindle might be evolutionarily conserved.
We do not know why there is such a large discrepancy between our experiments and those of Nicklas (1983), but our results are more in line with the theoretical calculations of others (Table 1). It is conceivable that in Nicklas (1983) stretching of the membrane might have given rise to erroneously high values. When hooking a chromosome with a needle, the needle never enters the cell but instead stretches the membrane and hooks the chromosome, like working inside a balloon from the outside. Nicklas (1983) described experiments designed to rule out contributions to his measurements from forces needed to stretch membranes. Notwithstanding those experiments, it still is conceivable that an artificially high measured force arises from stretching the cell membrane since stretching cell membranes by 0.5–1 μm requires forces of 100–900 pN as measured using atomic force microscopy (Matzke et al., 2001; Silberberg et al., 2009; Schillers et al., 2010). Whether or not this speculation is valid, our results point to the need for further investigation into the magnitude of mitotic/meiotic forces since our results indicate that they may be considerably lower than the higher value that has been generally accepted.
MATERIALS AND METHODS
Live-cell preparations
Living Mesostoma spermatocytes were obtained from a laboratory stock of Mesostoma ehrenbergii that originally was reared from diapausing (overwintering) eggs. Adult animals were kept in 500-ml plastic jars filled with dechlorinated water at 25°C in incubators with a 16 h light:8 h dark cycle and daily fed live brine shrimp. We obtained spermatocytes from animals that were 3–4 wk old and had ∼1–3 overwintering eggs. Testes were removed by inserting through the body wall of the animal a glass needle pulled from 10-μl pipettes (Fisher Scientific, Pittsburgh, PA) and then sucking testes up via Tygon tubing (Fisher Scientific) that was attached to the needle. Testes were expelled from the needle into a drop of Mesostoma Ringer's solution (61 mM NaCl, 2.3 mM KCl, 0.5 mM CaCl2, and 2.3 mM phosphate buffer, pH 6.9) that contained fibrinogen (Calbiochem, La Jolla, CA) on a glass coverslip, as previously described (Forer and Pickett-Heaps, 2005). When the cells were evenly dispersed in the fibrinogen, a drop of thrombin (Sigma-Aldrich, St. Louis, MO) was added to create a fibrin clot. The coverslip was then placed in a perfusion chamber (Forer and Pickett-Heaps, 2005) and perfused with Mesostoma Ringer's solution.
Living crane-fly spermatocytes were obtained from a laboratory stock of crane flies (Nephrotoma suturalis Loew). Briefly, we dissected the testes of IV-instar larvae under Halocarbon 95S oil, rinsed the testes in insect Ringer's solution (0.13 M NaCl, 5 mM KCl, 1 mM CaCl2, 0.02 M phosphate buffer, pH 6.9), and placed them in a fibrin clot as described. The coverslip was then placed in a perfusion chamber and perfused with insect Ringer's solution.
Cell culture
P. tridactylus kidney epithelial cells (#CCL 56; American Type Culture Collection, Manassas, VA) expressing enhanced cyan fluorescing protein (ECFP) tagged to the α-subunit of tubulin as previously described (Botvinick et al., 2004; Sheykhani et al., 2013) were grown in Life Technologies (Carlsbad, CA) advanced DMEM F-12 supplemented with l-glutamine and 3% fetal bovine serum. Briefly, the cells were incubated at 37°C with 5% CO2. A fibrinogen-thrombin clot was used as previously described to adhere the cells to the coverslip before irradiation (Forer and Pickett-Heaps, 2005; Snyder et al., 2010, Sheykhani et al., 2013). Irradiations were performed at room temperature (18–20°C).
Trapping and cutting
The optical setup used in this study was described previously (Shi et al., 2012; Harsono et al., 2013). Briefly, the system was based on an inverted microscope Axio Observer (Zeiss, Jena, Germany) with a 1064-nm continuous wave Nd:YVO4 laser (Millennia IR; Newport Co., Irvine, CA) for trapping and a 200-fs pulsed laser (Mai Tai; Newport Co.) tuned at 730 nm for cutting. Both laser beams are expanded to fill the back aperture of the objective (Zeiss Plan-Apochromat 63/1.40 Oil Ph3). The transmission of this objective was determined to be 26% at 1064 nm and 74% at 730 nm using a multiobjective measuring procedure previously described (Gomez-Godinez et al., 2010). Half-wave plates are motorized to adjust the power of each laser. The beams are steered by fast-scanning mirrors (FSM300; Newport Co.) such that the focus of both the laser trap and the laser scissors can be readily located and moved within the sample plane. The cutting and trapping beams are combined by a long-pass dichroic beam splitter and then coupled into the microscope by a custom laser entry port. Images were recorded live by an ORCA R2 camera (Hamamatsu, Hamamatsu Japan) at variable intervals ranging from 2 to 10 s.
The power in the trap plane of focus was varied from <15 to >68 mW at the cell when the trap was applied to the kinetochore of prometaphase/metaphase half-bivalents in Mesostoma spermatocytes. The power at the focal plane was 25–140 mW when the trap was applied to the kinetochore of anaphase chromosomes or of pieces of cut prometaphase bivalents in crane-fly spermatocytes and 7.8 mW when the trap was applied to spindle poles in PtK2 cells. Trapping time varied from 30 s to >5 min.
Data analysis
The tagged image file format (TIFF) and portable network graphic (PNG) images that were taken every 2–10 s using the LabVIEW (National Instruments, Austin, TX) program throughout the duration of the experiment were cropped, stamped with date and time, and converted to bitmap image files (BMP) using IrfanView (www.irfanview.com/). The BMP images were converted into time-lapsed video sequences using VirtualDub (www.virtualdub.org/). Single frames from the time-lapsed videos were exported into WinImage, an in-house software program (Wong and Forer, 2003), and the positions to be measured were recorded. The user marked the positions to be measured, and the computer program converted the on-screen pixel spacing into micrometers. The micrometer measurements at the different time points were imported into SlideWrite (www.slidewrite.com/) to plot distance versus time. The slope of the line of best fit was used to calculate velocities.
Fluorescence staining, confocal microscopy, and electron microscopy
After trapping the edge of the kinetochore with laser powers of 21 and 44.5 mW for 4 min, we lysed PtK cells at room temperature in a cytoskeleton-stabilizing lysis buffer (100 mM piperazine N,N-bis(2-ethanesulfonic acid), 10 mM ethylene glycol tetraacetic acid; 5 mM MgSO4; 5% dimethyl sulfoxide; 1% Nonidet P-40; pH 6.9) while the trap was still on. Lysed cells were fixed for 5 min in 0.25% glutaraldehyde in phosphate-buffered saline (PBS), rinsed in PBS (two times for 5 min each), kept in sodium borohydride (1 mg/ml; two times for 8–10 min) to neutralize free aldehyde groups, and then rinsed again with PBS (two times for 5 min each). Trapped cells were stained with YL1/2 rat monoclonal antibody specific for tyrosinated α-tubulin (Kilmartin et al., 1982) diluted (1:200), followed by Alexa 594 goat anti-rat immunoglobulin (Invitrogen, Burlington, Canada) diluted 1:100. All staining steps were in MatTek glass-bottom dishes (MatTek, Ashland, MA). Cells were rinsed with PBS containing 0.1% Triton X-100 before addition of tubulin antibody. The incubation time for each antibody was 1 h. Preparations were kept in the dark during the incubation periods to prevent light inactivation of the fluorochromes. All dilution of antibodies was done in PBS. After staining and before mounting, the glass coverslip was removed from the dish using coverslip removal fluid (MatTek). Coverslips were mounted in Mowiol (Calbiochem, Billerica, MA) solution (Osborn and Weber, 1982) containing paraphenylene diamine as an antifading agent (Fabian and Forer, 2005) and stored at 4ºC in the dark.
Cells were studied using an Olympus FluoView 300 confocal microscope (Olympus, Tokyo, Japan), with HeNe laser at 543 nm, using an Olympus Plan Apo 60× oil immersion objective (numerical aperture, 1.4). Images, collected with FluoView software, were further processed using ImageJ (National Institutes of Health, Bethesda, MD) and Photoshop (Adobe, San Jose, CA). Image adjustments for publication were only of brightness and contrast.
Control cells in perfusion chambers were fixed for electron microscopy as described by Forer and Pickett-Heaps (2010). Briefly, cells were fixed in 2% glutaraldehyde, postfixed in 4% osmium tetroxide, dehydrated, and embedded in epoxy resin; the hardened epoxy resin was removed from the coverslips, and individual cells were marked and sectioned.
Acknowledgments
We are grateful to Linda Shi (University of California, San Diego, La Jolla, CA) for her help and guidance with the Robolase microscope and Jagesh Shah (Harvard University, Cambridge, MA) for constructing and providing the ECFP PtK2 cells. This work was supported by grants from the Canadian Natural Sciences and Engineering Council to A.F., York University Fieldwork and Research Cost Funds to J.F., and the Beckman Laser Institute Foundation and a grant from the Air Force Office of Scientific Research FA9550-10-1-0538 to M.B.
Abbreviation used:
- n
refractive index
Footnotes
This article was published online ahead of print in MBoC in Press (http://www.molbiolcell.org/cgi/doi/10.1091/mbc.E12-12-0901) on March 13, 2013.
REFERENCES
- Alexander SP, Rieder CL. Chromosome motion during attachment to the vertebrate spindle: initial saltatory-like behavior of chromosomes and quantitative analysis of force production by nascent kinetochore fibres. J Cell Biol. 1991;113:805–815. doi: 10.1083/jcb.113.4.805. [DOI] [PMC free article] [PubMed] [Google Scholar]
- Ashkin A. Forces of a single-beam gradient laser trap on a dielectic sphere in the ray optics regime. Biophys J. 1992;61:569–582. doi: 10.1016/S0006-3495(92)81860-X. [DOI] [PMC free article] [PubMed] [Google Scholar]
- Ashkin A. Optical trapping and manipulation of neutral particles using lasers. Proc Natl Acad Sci USA. 1997;94:4853–4860. doi: 10.1073/pnas.94.10.4853. [DOI] [PMC free article] [PubMed] [Google Scholar]
- Ashkin A, Dziedzic JM, Bjorkholm JE, Chu S. Observation of a single-beam gradient force optical trap for dielectric particles. Opt Lett. 1986;11:288–290. doi: 10.1364/ol.11.000288. [DOI] [PubMed] [Google Scholar]
- Ashkin A, Dziedzic JM, Yamane T. Optical trapping and manipulation of single cells using infrared laser beams. Nature. 1987;330:769–771. doi: 10.1038/330769a0. [DOI] [PubMed] [Google Scholar]
- Ashkin A, Schutze K, Dziedzic JM, Euteneuer U, Schliwa M. Force generation of organelle transport measured in vivo by an infrared laser trap. Nature. 1990;348:346–348. doi: 10.1038/348346a0. [DOI] [PubMed] [Google Scholar]
- Aufderheide KJ, Du Q, Fry ES. Directed positioning of nuclei in living Paramecium tetraurelia: use of the laser optical force trap for developmental biology. Dev Genet. 1992;13:235–240. [Google Scholar]
- Baker N. La Jolla, CA: University of California, San Diego; 2010. Optical studies on cell division (mitosis) PhD Thesis. [Google Scholar]
- Barer R. Refractometry and interferometry of living cells. J Opt Soc Am. 1957;47:545–556. doi: 10.1364/josa.47.000545. [DOI] [PubMed] [Google Scholar]
- Botvinick EL, Venugopalan V, Shah JV, Liaw LH, Berns MW. Controlled ablation of microtubules using a picosecond laser. Biophys J. 2004;87:4203–4212. doi: 10.1529/biophysj.104.049528. [DOI] [PMC free article] [PubMed] [Google Scholar]
- Cameron LA, Yang G, Cimini D, Canman JC, Kisurina-Evgenieva O, Khodjakov A, Danuser G, Salmon ED. Kinesin 5-independent poleward flux of kinetochore microtubules in PtK1 cells. J Cell Biol. 2006;173:173–179. doi: 10.1083/jcb.200601075. [DOI] [PMC free article] [PubMed] [Google Scholar]
- Croft JA, Jones GH. Meiosis in Mesostoma ehrenbergii ehrenbergii IV. Recombination nodules in spermatocytes and a test of the correspondence of late recombination nodules and chiasmata. Genetics. 1989;121:255–262. doi: 10.1093/genetics/121.2.255. [DOI] [PMC free article] [PubMed] [Google Scholar]
- Dumont S, Mitchison TJ. Force and length in the mitotic spindle. Curr Biol. 2009;19:R749–R761. doi: 10.1016/j.cub.2009.07.028. [DOI] [PMC free article] [PubMed] [Google Scholar]
- Fabian L, Forer A. Redundant mechanisms for anaphase chromosome movements: crane-fly spermatocyte spindles normally use actin filaments but also can function without them. Protoplasma. 2005;225:169–184. doi: 10.1007/s00709-005-0094-6. [DOI] [PubMed] [Google Scholar]
- Felgner H, Frank R, Schliwa M. Flexural rigidity of microtubules measured with the use of optical tweezers. J Cell Sci. 1996;109:509–516. doi: 10.1242/jcs.109.2.509. [DOI] [PubMed] [Google Scholar]
- Forer A. Local reduction of spindle fibre birefringence in living Nephrotoma suturalis (Loew) spermatoctyes induced by ultraviolet microbeam irradiation. J Cell Biol. 1965;25:95–117. doi: 10.1083/jcb.25.1.95. [DOI] [PMC free article] [PubMed] [Google Scholar]
- Forer A, Larson DE, Zimmerman AM. Experimental determinations of tubulin in the in vivo mitotic apparatus of sea urchin zygotes. Can J Biochem Cell Biol. 1980;58:1277–1285. doi: 10.1139/o80-171. [DOI] [PubMed] [Google Scholar]
- Forer A, Pickett-Heaps J. Fibrin clots keep non-adhering living cells in place on glass for perfusion or fixation. Cell Biol Int. 2005;29:721–730. doi: 10.1016/j.cellbi.2005.04.010. [DOI] [PubMed] [Google Scholar]
- Forer A, Pickett-Heaps J. Precocious (pre-anaphase) cleavage furrows in Mesostoma spermatocytes. Eur J Cell Biol. 2010;89:607–618. doi: 10.1016/j.ejcb.2010.03.001. [DOI] [PubMed] [Google Scholar]
- Forer A, Wilson PJ. A model for chromosome movement during mitosis. Protoplasma. 1994;179:95–105. [Google Scholar]
- Fuge H. Oscillatory movement of bipolar-oriented bivalent kinetochores and spindle forces in male meiosis of Mesostoma ehrenbergii. Eur J Cell Biol. 1987;44:294–298. [Google Scholar]
- Fuge H. Rapid kinetochore movements in Mesostoma ehrenbergii spermatocytes: action of antagonistic chromosome fibre. Cell Motil Cytoskeleton. 1989;13:212–220. [Google Scholar]
- Fuge H, Falke D. Morphological aspects of chromosome spindle fibres in Mesostoma: “microtubular fir-tree” structures and microtubule association with kinetochores and chromatin. Protoplasma. 1991;160:39–48. [Google Scholar]
- Gahagan KT, Swartzlander GA. Trapping of low-index microparticles in an optical vortex. J Opt Soc Am B. 1998;15:524–534. [Google Scholar]
- Gomez-Godinez V, Wu T, Sherman AJ, Lee CS, Liaw LH, Zhongsheng Y, Yokomori K, Berns MW. Analysis of DNA double-strand break response and chromatin structure in mitosis using laser microirradiation. Nucleic Acids Res. 2010;38:e202. doi: 10.1093/nar/gkq836. [DOI] [PMC free article] [PubMed] [Google Scholar]
- Goshima G, Scholey JM. Control of mitotic spindle length. Annu Rev Cell Dev Biol. 2010;26:21–57. doi: 10.1146/annurev-cellbio-100109-104006. [DOI] [PubMed] [Google Scholar]
- Gruzdev AD. Critical review of some hypotheses concerning anaphase chromosome movements. Tsitologiya. 1972;14:141–149. [PubMed] [Google Scholar]
- Harsono MS, Zhu Q, Shi LZ, Duquette M, Berns MW. Development of a dual joystick-controlled laser trapping and cutting system for optical micromanipulation of chromosomes inside living cells. J Biophotonics. 2013;6:197–204. doi: 10.1002/jbio.201200019. [DOI] [PubMed] [Google Scholar]
- Houchmandzadeh B, Marko JF, Chatenay D, Libchaber A. Elasticity and structure of eukaryote chromosomes studied by micromanipulation and micropipette aspiration. J Cell Biol. 1997;139:1–12. doi: 10.1083/jcb.139.1.1. [DOI] [PMC free article] [PubMed] [Google Scholar]
- Husted L, Ruebush TK. A comparative cytological and morphological study of Mesotoma ehrenbergii and Mesotoma ehrenbergii wardii. J Morphol. 1940;67:387–410. [Google Scholar]
- Johansen KM, Forer A, Yao C, Girton J, Johansen J. Do nuclear envelope and intranuclear proteins reorganize during mitosis to form an elastic, hydrogel-like spindle matrix. Chromosome Res. 2011;19:345–365. doi: 10.1007/s10577-011-9187-6. [DOI] [PubMed] [Google Scholar]
- Johansen KM, Johansen J. Cell and molecular biology of the spindle matrix. Int Rev Cytol. 2007;263:155–206. doi: 10.1016/S0074-7696(07)63004-6. [DOI] [PubMed] [Google Scholar]
- Kellermayer MSZ, Smith SB, Bustamante C, Granzier HL. Complete unfolding of the titin molecule under external force. J Struct Biol. 1998;122:197–205. doi: 10.1006/jsbi.1998.3988. [DOI] [PubMed] [Google Scholar]
- Kilmartin JV, Wright B, Milstein C. Rat monoclonal antitubulin antibodies derived by using a new nonsecreting rat cell line. J Cell Biol. 1982;93:576–582. doi: 10.1083/jcb.93.3.576. [DOI] [PMC free article] [PubMed] [Google Scholar]
- Konig K, Svaasand L, Liu Y, Sonek G, Patrizio P, Tadir Y, Berns MW, Tromberg BJ. Determination of motility forces of human spermatozoa using 800nm optical trap. Mol Cell Biol. 1996;42:501–509. [PubMed] [Google Scholar]
- Kuo SC, Sheetz MP. Force of single kinesin molecules measured with optical tweezers. Science. 1993;260:232–234. doi: 10.1126/science.8469975. [DOI] [PubMed] [Google Scholar]
- Kurachi M, Hoshi M, Tashiro H. Buckling of a single microtubule by optical trapping forces: direct measurement of microtubule rigidity. Cell Motil Cytoskeleton. 1995;30:221–228. doi: 10.1002/cm.970300306. [DOI] [PubMed] [Google Scholar]
- Liang H, Vu KT, Krishnan P, Trang TC, Shin D, Kimel S, Berns MW. Wavelength dependence of cell cloning efficiency after optical trapping. Biophys J. 1996;70:1529–1533. doi: 10.1016/S0006-3495(96)79716-3. [DOI] [PMC free article] [PubMed] [Google Scholar]
- Liang H, Wright WH, Cheng S, He W, Berns MW. Micromanipulation of chromosomes in PTK2 cells using laser microsurgery (optical scalpel) in combination with laser-induced optical force (optical tweezers) Exp Cell Res. 1993;204:110–120. doi: 10.1006/excr.1993.1015. [DOI] [PubMed] [Google Scholar]
- Liang H, Wright WH, He W, Berns MW. Micromanipulation of mitotic chromosomes in PTK2 cells using laser-induced optical forces (“optical tweezers”) Exp Cell Res. 1991;197:21–35. doi: 10.1016/0014-4827(91)90475-a. [DOI] [PubMed] [Google Scholar]
- Liang H, Wright WH, Rieder CL, Salmon ED, Profeta G, Andrews J, Liu Y, Sonek G, Berns MW. Directed movement of chromosome arms and fragments in mitotic newt lung cells using optical scissors and optical tweezers. Exp Cell Res. 1994;213:308–312. doi: 10.1006/excr.1994.1203. [DOI] [PubMed] [Google Scholar]
- Liu Y, Cheng DK, Sonek GJ, Berns MW, Chapman CF, Tromberg BJ. Evidence for localized heating induced by infrared optical tweezers. Biophys J. 1995;68:2137–2144. doi: 10.1016/S0006-3495(95)80396-6. [DOI] [PMC free article] [PubMed] [Google Scholar]
- Liu Y, Cheng K, Sonek GJ, Berns MW, Tromberg BJ. Microfluorometric technique for the determination of localized heating in organic particles. Appl Phys Lett. 1994;65:919–921. [Google Scholar]
- Liu Y, Sonek J, Berns MW, Tromberg BJ. Physiological monitoring of optically trapped cells: assessing the effects of confinement by 1064-nm laser tweezers using microfluorometry. Biophys J. 1996;71:2158–2167. doi: 10.1016/S0006-3495(96)79417-1. [DOI] [PMC free article] [PubMed] [Google Scholar]
- Marshall WF, Marko JF, Agard DA, Sedat JW. Chromosome elasticity and mitotic polar ejection force measured in living Drosophila embryos by four-dimensional microscopy-based motion analysis. Curr Biol. 2001;11:569–578. doi: 10.1016/s0960-9822(01)00180-4. [DOI] [PubMed] [Google Scholar]
- Matzke R, Jacobson K, Radmacher M. Direct, high-resolution measurements of furrow stiffening during division of adherent cells. Nat Cell Biol. 2001;3:607–610. doi: 10.1038/35078583. [DOI] [PubMed] [Google Scholar]
- McIntosh JR, Pfarr CM. Mitotic motors. J Cell Biol. 1991;115:577–585. doi: 10.1083/jcb.115.3.577. [DOI] [PMC free article] [PubMed] [Google Scholar]
- Mitchison T, Evans L, Schulze E, Kirschner M. Sites of microtubule assembly and disassembly in the mitotic spindle. Cell. 1986;45:515–527. doi: 10.1016/0092-8674(86)90283-7. [DOI] [PubMed] [Google Scholar]
- Mitchison TJ, Maddox P, Gaetz J, Groen A, Shirasu M, Desai A, Salmon ED, Kapoor TM. Roles of polymerization dynamics, opposed motors, and a tensile element in governing the length of Xenopus extract meiotic spindles. Mol Biol Cell. 2005;16:3064–3076. doi: 10.1091/mbc.E05-02-0174. [DOI] [PMC free article] [PubMed] [Google Scholar]
- Mitchison TJ, Salmon ED. Mitosis: a history of division. Nat Cell Biol. 2001;3:E17–E21. doi: 10.1038/35050656. [DOI] [PubMed] [Google Scholar]
- Molloy JE, Burns JE, Kendrick-Jones J, Tregear RT, White DCS. Movement and force produced by a single myosin head. Nature. 1995;378:209–212. doi: 10.1038/378209a0. [DOI] [PubMed] [Google Scholar]
- Nascimento JM, Shi LZ, Meyers S, Gagneux P, Loskutoff NM, Botvinick EL, Berns MW. The use of optical tweezers to study sperm competition and motility in primates. J R Soc Interface. 2007;5:297–302. doi: 10.1098/rsif.2007.1118. [DOI] [PMC free article] [PubMed] [Google Scholar]
- Neuman KC, Block SM. Optical trapping. Rev Sci Instrum. 2004;75:2787–2809. doi: 10.1063/1.1785844. [DOI] [PMC free article] [PubMed] [Google Scholar]
- Nicklas RB. Chromosome velocity during mitosis as a function of chromosome size and position. J Cell Biol. 1965;25:119–135. doi: 10.1083/jcb.25.1.119. [DOI] [PMC free article] [PubMed] [Google Scholar]
- Nicklas RB. Measurements of the force produced by the mitotic spindle in anaphase. J Cell Biol. 1983;97:542–548. doi: 10.1083/jcb.97.2.542. [DOI] [PMC free article] [PubMed] [Google Scholar]
- Nishizaka T, Miyata H, Yoshikawa H, Ishiwata S, Kinosit K. Unbinding force of a single motor molecule of muscle measured using optical tweezers. Nature. 1995;377:251–254. doi: 10.1038/377251a0. [DOI] [PubMed] [Google Scholar]
- Oakley H. Male meiosis in Mesostoma ehrenbergii ehrenbergii. In: Brandham PE, Bennett MD, editors. Kew Chromosome Conference II. London: George Allen and Unwin; 1983. pp. 195–199. [Google Scholar]
- Oakley H. Meiosis in Mesostoma ehrenbergii ehrenbergii (Turbellaria, Rhabdocoela) III. Univalent chromosome segregation during the first meiotic division in spermatocytes. Chromosoma. 1985;91:95–100. doi: 10.1007/BF00294051. [DOI] [PubMed] [Google Scholar]
- Oakley HA, Jones GH. Meiosis in Mesostoma ehrenbergii ehrenbergii (Turbellaria, Rhabdocoela) I. Chromosome pairing, synaptonemal complexes and chiasma localisation in spermatogenesis. Chromosoma. 1982;85:311–322. [Google Scholar]
- Osborn M, Weber K. Immunofluorescence and immunocytochemical procedures with affinity purified antibodies: tubulin-containing structures. Methods Cell Biol. 1982;24:97–132. doi: 10.1016/s0091-679x(08)60650-0. [DOI] [PubMed] [Google Scholar]
- Pickett-Heaps J, Forer A. Mitosis: spindle evolution and the matrix model. Protoplasma. 2009;235:91–99. doi: 10.1007/s00709-009-0030-2. [DOI] [PubMed] [Google Scholar]
- Pickett-Heaps JD, Forer A, Spurck T. Rethinking anaphase: where “Pac-Man” fails and why a role for the spindle matrix is likely. Protoplasma. 1996;192:1–10. [Google Scholar]
- Rieder CL, Alexander SP. Kinetochores are transported poleward along a single astral microtubule during chromosome attachment to the spindle in newt lung cells. J Cell Biol. 1990;110:81–95. doi: 10.1083/jcb.110.1.81. [DOI] [PMC free article] [PubMed] [Google Scholar]
- Sato S, Ohyumi M, Shibata H, Inaba H, Ogawa Y. Optical trapping of small particles using a 1.3-μm compact InGaAsP diode laser. Opt Lett. 1991;16:282–284. doi: 10.1364/ol.16.000282. [DOI] [PubMed] [Google Scholar]
- Schaap CJ, Forer A. Temperature effects on anaphase chromosome movement in the spermatoctyes of two species crane flies (Nephrotoma suturalis Loew and Nephrotoma ferruginea Fabricius) J Cell Sci. 1979;39:29–52. doi: 10.1242/jcs.39.1.29. [DOI] [PubMed] [Google Scholar]
- Schillers H, Walte, Urbanova K, Oberleithner H. Real-time monitoring of cell elasticity reveals oscillating myosin activity. Biophys J. 2010;99:3639–3646. doi: 10.1016/j.bpj.2010.09.048. [DOI] [PMC free article] [PubMed] [Google Scholar]
- Sheykhani R, Baker N, Gomez-Godinez V, Liaw LH, Shah J, Berns MW, Forer A. The role of actin and myosin in PtK2 spindle length changes induced by laser microbeam irradiations across the spindle. Cytoskeleton (Hoboken) 2013 doi: 10.1002/cm.21104. DOI: 10.1002/cm.21104. [DOI] [PubMed] [Google Scholar]
- Shi LZ. Integrated optical systems for laser nanosurgery and optical trapping to study cell structure and function. In: Mendez-Vilas A., editor. Current Microscopy Contributions to Advances in Science and Technology. Badajoz, Spain: Formatex; 2012. pp. 685–695. [Google Scholar]
- Silberberg YR, Yakubov GE, Horton MA, Pelling AE. Cell nanomechanics and focal adhesions are regulated by retinol and conjugated linoleic acid in a dose-dependent manner. Nanotechnology. 2009;20:285103. doi: 10.1088/0957-4484/20/28/285103. [DOI] [PubMed] [Google Scholar]
- Simmons RM, Finer JT, Chu S, Spudich JA. Quantitative measurements of force and displacement using an optical trap. Biophys J. 1996;70:1813–1822. doi: 10.1016/S0006-3495(96)79746-1. [DOI] [PMC free article] [PubMed] [Google Scholar]
- Snyder JA, Ha Y, Olsofka C, Wahdan R. Both actin and myosin inhibitors affect spindle architecture in PtK1 cells: does an actomyosin system contribute to mitotic spindle forces by regulating attachment and movements of chromosomes in mammalian cells. Protoplasma. 2010;240:57–68. doi: 10.1007/s00709-009-0089-9. [DOI] [PubMed] [Google Scholar]
- Svoboda K, Block SM. Biological applications of optical forces. Annu Rev Biophys Biomol Struct. 1994a;23:247–285. doi: 10.1146/annurev.bb.23.060194.001335. [DOI] [PubMed] [Google Scholar]
- Svoboda K, Block SM. Force and velocity measured for single kinesin molecules. Cell. 1994b;77:773–784. doi: 10.1016/0092-8674(94)90060-4. [DOI] [PubMed] [Google Scholar]
- Taylor EW. Brownian and saltatory movements of cytoplasmic granules and the movement of anaphase chromosomes. In: Copley AL, editor. Proceedings of the Fourth International Congress on Rheology. New York: Interscience; 1965. pp. 175–191. Part 4. [Google Scholar]
- Wilson PJ, Forer A. Acetylated a-tubulin in spermatogenic cells of the crane fly Nephrotorna suturalis: kinetochore microtubules are selectively acetylated. Cell Motil Cytoskeleton. 1989;14:237–250. [Google Scholar]
- Wong R, Forer A. Signalling between chromosomes in crane fly spermatocytes studied using ultraviolet microbeam irradiation. Chromosome Res. 2003;11:771–786. doi: 10.1023/b:chro.0000005753.97458.20. [DOI] [PubMed] [Google Scholar]
- Wright WH, Sonek GJ, Berns MW. Radiation trapping forces on microspheres with optical tweezers. Appl Phys Lett. 1993;63:715–717. [Google Scholar]
- Wright WH, Sonek GJ, Berns MW. Parametric study of the force on microspheres held by optical tweezers. Appl Opt. 1994;33:1735–1748. doi: 10.1364/AO.33.001735. [DOI] [PubMed] [Google Scholar]
- Yin H, Wang MD, Svoboda K, Landick R, Bloc SM, Gelles J. Transcription against an applied force. Science. 1995;270:1653–1657. doi: 10.1126/science.270.5242.1653. [DOI] [PubMed] [Google Scholar]