Abstract
Intracellular Ca2+ transients are considered a primary signal by which astrocytes interact with neurons and blood vessels. With existing commonly used methods, Ca2+ has been studied only within astrocyte somata and thick branches, leaving the distal fine branchlets and endfeet that are most proximate to neuronal synapses and blood vessels largely unexplored. Here, using cytosolic and membrane-tethered forms of genetically encoded Ca2+ indicators (GECIs; cyto-GCaMP3 and Lck-GCaMP3), we report well-characterized approaches that overcome these limitations. We used in vivo microinjections of adeno-associated viruses to express GECIs in astrocytes and studied Ca2+ signals in acute hippocampal slices in vitro from adult mice (aged ∼P80) two weeks after infection. Our data reveal a sparkling panorama of unexpectedly numerous, frequent, equivalently scaled, and highly localized Ca2+ microdomains within entire astrocyte territories in situ within acute hippocampal slices, consistent with the distribution of perisynaptic branchlets described using electron microscopy. Signals from endfeet were revealed with particular clarity. The tools and experimental approaches we describe in detail allow for the systematic study of Ca2+ signals within entire astrocytes, including within fine perisynaptic branchlets and vessel-associated endfeet, permitting rigorous evaluation of how astrocytes contribute to brain function.
INTRODUCTION
It is now well established that astrocytes serve vital physiological roles in the functioning of the nervous system, including buffering of K+ around neurons, regulation of blood flow, clearance of neurotransmitters from synapses, as well as providing trophic factors and nutrients (Kofuji and Newman, 2004; Barres, 2008; Attwell et al., 2010). In addition to these vital contributions to the functioning of the brain as a tissue, evidence suggests that astrocytes may respond to, and regulate, neuronal function and blood flow (Araque et al., 2001; Haydon, 2001; Attwell et al., 2010; Halassa and Haydon, 2010).
Over the last two decades, attention has focused on the recording of Ca2+ signals within astrocytes as a basis to explore their roles within neuronal circuits. The strong focus on Ca2+ is based on the fact that Ca2+ is a ubiquitous second messenger (Clapham, 2007). However, despite progress, the extent to which astrocyte Ca2+ signals are triggered by neurons and/or if they are instructive for neurons remains poorly understood and debated (Agulhon et al., 2008; Nedergaard and Verkhratsky, 2012). Hitherto, this topic has been addressed mainly by studying astrocytes in situ within acute brain slices using bulk loading of membrane-permeable organic Ca2+ indicator dyes or with patch-mediated dialysis of Ca2+ indicator dyes (Russell, 2011). However, neither of these methods reports on entire astrocytes (Reeves et al., 2011), and their use has resulted in somewhat inconclusive data on the importance of somatic astrocyte Ca2+ signals (Agulhon et al., 2008; Halassa and Haydon, 2010; Hamilton and Attwell, 2010). Additionally, patch-mediated loading of dyes is known to dialyze and disrupt astrocyte functions (Nett et al., 2002) and can only be performed on cells one-by-one, whereas bulk loading results in uneven loading and is troublesome in adult tissue (Kang and Nedergaard, 2000; Tong et al., 2012). Indeed, it has been known for almost two decades that patch pipette–mediated loading of Ca2+ indicator dyes can alter cell physiology (Rand et al., 1994), and the high concentrations of Ca2+ indicator dyes often used to see Ca2+ signals in astrocyte processes (see Tong et al., 2012) are not ideal because they are known to change Ca2+ signals by acting as predominant mobile Ca2+ buffers (Helmchen and Tank, 2000; Neher, 2000). Studies with cultured dispersed cells or slices are also increasingly thought to be somewhat limited because of the growing realization that such procedures change astrocyte functions in important ways (Foo et al., 2011). Thus, noninvasive approaches to measure Ca2+ signals from entire astrocytes in situ from adult tissue slices are desperately needed to carefully explore astrocyte physiology. In principle, many of the aforementioned problems may be addressed with the use of genetically encoded Ca2+ indicators (GECIs), which could be expressed in multiple cells without the need for dialyzing astrocytes with high concentrations of organic dyes via patch pipettes, as recently discussed (Tong et al., 2012).
A pioneering study used a fluorescence resonance energy transfer–based calcium sensor expressed in astrocytes in vivo (Atkin et al., 2009; Russell, 2011), and recently progress has been made using single-wavelength GECIs to study Ca2+ signals in astrocytes (Shigetomi et al., 2010a,b, 2012; Arizono et al., 2012; Tong et al., 2012). However, the aforementioned studies that used GCaMP-based GECIs used neuron–astrocyte co-cultures or slice cultures from young rodents, and thus the utility of GCaMP-based GECIs has not hitherto been assessed within acute brain slices in situ from fully developed mature animals. This is an important issue with key and particular relevance to the study of astrocytes, because systematic work shows that astrocytes in culture may be different from those in situ (Foo et al., 2011), and because astrocytes from adults are also functionally different to those from young animals, especially with respect to Ca2+ signaling (Sun et al., 2013). Herein, we extend these past studies and report as well as thoroughly characterize novel tools to study astrocyte Ca2+ signals in acute brain slices from adult mice.
We also report the finding that astrocyte-specific expression of GCaMP-based GECIs targeted to the cytosol or plasma membrane can be used to image Ca2+ in entire astrocytes in situ within brain slices. GECIs overcome limitations of existing methods, and their use reveals unexpectedly high numbers of localized Ca2+ microdomains in entire astrocyte territories. Overall, we provide methodological guidelines as well as important and well-characterized novel tools/resources (and control constructs) for exploring astrocyte roles within microcircuits and for neurovascular coupling.
MATERIALS AND METHODS
Molecular biology and adeno-associated virus (AAV)2/5 generation
Plasmids encoding cytosolic GCaMP3 (cyto-GCaMP3) and membrane-targeted Lck-GCaMP3 were described previously (Tian et al., 2009; Shigetomi et al., 2012) (Addgene plasmids 22692 and 26974, respectively). To generate an AAV2/5 capable of expressing cyto-GCaMP3 and Lck-GCaMP3 in astrocytes, we modified plasmid “pZac2.1final” (Penn Vector Core). We removed the CMV promoter flanked by BglII and HindIII sites and replaced it with the minimal (∼700-bp) gfaABC1D astrocyte-specific promoter, which was amplified by PCR from Addgene plasmid 19974. We then cloned cyto-GCaMP3 and Lck-GCaMP3 into this modified pZac2.1 vector between EcoRI and XbaI sites to generate plasmids we called “pZac2.1 gfaABC1D GCaMP3” and “pZac2.1 gfaABC1D Lck-GCaMP3,” respectively. Similarly, we also made “pZac2.1 gfaABC1D Lck-GFP” (Shigetomi et al., 2010b) and “pZac2.1 gfaABC1D tdTomato.” The fully sequenced “pZac2.1” plasmids were sent to the Penn Vector Core, which used them to generate AAV2/5 for each construct at a concentration of ∼2.5 × 10¹³ genome copies/ml (gc/ml). All our virus constructs have been deposited at Addgene in the Khakh laboratory repository for free distribution (http://www.addgene.org/Baljit_Khakh).
Surgery and in vivo microinjections of AAV2/5
Postnatal day 49–63 (P49–P63) male and female C57BL/6 mice were used in all experiments in accordance with institutional guidelines. All surgical procedures were conducted under general anesthesia using continuous isoflurane (induction at 5%, maintenance at 1–2.5% vol/vol). Depth of anesthesia was monitored continuously and adjusted when necessary. After induction of anesthesia, the mice were fitted into a stereotaxic frame, with their heads secured by blunt ear bars and their noses placed into an anesthesia and ventilation system (David Kopf Instruments). Mice were administered 0.05 ml buprenorphine (0.1 mg/ml; Buprenex) subcutaneously before surgery. The surgical incision site was then cleaned three times with 10% povidone iodine and 70% ethanol. Skin incisions were made, followed by craniotomies of 2–3 mm in diameter above the left parietal cortex using a small steel burr (Fine Science Tools) powered by a high speed drill (K.1070; Foredom). Saline (0.9%) was applied onto the skull to reduce heating caused by drilling. Unilateral viral injections were performed by using stereotaxic apparatus (David Kopf Instruments) to guide the placement of beveled glass pipettes (World Precision Instruments) into the left hippocampus (2 mm posterior to bregma, 1.5 mm lateral to midline, and 1.6 mm from the pial surface). Either 2 µl AAV2/5 gfaABC1D Lck-GCaMP3 (1.2 × 10¹³ gc/ml), 1.5 µl AAV2/5 gfaABC1D GCaMP3 (1.5 × 10¹³ gc/ml), 1.5 µl AAV2/5 gfaABC1D Lck-GFP (2.41 × 10¹³ gc/ml), or 1.0 µl AAV2/5 gfaABC1D tdTomato (2.5 × 10¹³ gc/ml) was injected using a syringe pump (Pump11 PicoPlus Elite; Harvard Apparatus). Glass pipettes were left in place for at least 10 min. Surgical wounds were closed with single external 5–0 nylon sutures. After surgery, animals were allowed to recover overnight in cages placed partially on a low voltage heating pad. Buprenorphine was administered two times per day for up to 2 d after surgery. In addition, trimethoprim sulfamethoxazole (40 and 200 mg, respectively, per 500 ml water) was dispensed in the drinking water for 1 wk. Mice were killed 12–20 d after surgery for imaging (typically 13–15 d). We chose this period because generally it takes ∼2 wk to achieve GECI expression in cells by AAV infection and because it has been suggested that long-term expression (>3 wk after AAV injection) can cause toxicity in neurons (Akerboom et al., 2012).
Preparation of brain slices and Ca2+ imaging
Coronal slices of hippocampus (300 µm) were cut in solution comprising (mM): 87 NaCl, 25 NaHCO3, 2.5 KCl, 1.25 NaH2PO4, 25 d-glucose, 75 sucrose, 7 MgCl2, and 0.5 CaCl2 saturated with 95% O2 and 5% CO2. Slices were incubated at ∼34°C for 30 min and subsequently stored at room temperature in artificial cerebrospinal fluid (aCSF) comprising (mM): 126 NaCl, 2.5 KCl, 1.3 MgCl2, 10 d-glucose, 2.4 CaCl2, 1.24 NaH2PO4, and 26 NaHCO3 saturated with 95% O2 and 5% CO2. All other slice procedures were exactly as described previously (Shigetomi et al., 2008). All our imaging was performed using commercially available off-the-shelf and standard confocal microscopes. In brief, cells were mostly imaged using a confocal microscope (Fluoview 300; Olympus) with a 40× water-immersion objective lens with a numerical aperture of 0.8, and a few cells were imaged with a confocal microscope (Fluoview 1000; Olympus) using the same lens. We used the 488-nm line of an Argon laser, with the intensity adjusted to 0.5–5% of the maximum output, which was 16.9 mW in the case of the Fluoview 300 and 10 mW in the case of the Fluoview 1000. The emitted light pathway consisted of an emission high pass filter (>510 nm) before the photomultiplier tube. These settings were chosen based on the known properties of Fluo-4 and GCaMP3 fluorophores (Table 1) (Haugland and Johnson, 1999; Tian et al., 2009). Astrocytes were selected from the CA1 stratum radiatum region and were typically 20–40 µm from the slice surface. For Fluo-4 measurements, we incubated slices with 5 µM Fluo-4AM (Invitrogen) and 0.05% Pluronic F–127 20% solution in DMSO (Invitrogen) in aCSF for 60 min, and then transferred them to dye-free aCSF for at least 30 min before experimentation to allow for cleavage of the AM ester group. For the experiments shown in Fig. 5, we dropped 4 µl Fluo-4AM (2 mM) onto the hippocampal slices. The final concentration of Fluo4-AM is 8 µM with 0.02% Pluronic F–127. For these experiments, the light emission pathway consisted of a dichroic mirror (SDM560) and an emission filter (505–525 nm) to image Fluo-4. tdTomato was excited by the 543-nm laser line of the HeNeG laser at 20% of the maximum output (1 mW). The emitted light pathway consisted of a dichroic mirror (SDM560) and an emission filter (560–600 nm).
Table 1.
Basic properties of Fluo-4 and GCaMP3
| Fluo-4 | GCaMP3 (Looger laboratory) | GCaMP3 (Campbell laboratory) | |
| Peak excitation wavelength (nm) | 494 | 497 | 496 |
| Peak emission wavelength (nm) | 516 | 514 | 513 |
| Ca2+ affinity (nM) | ∼350 | ∼660 | ∼542 |
| εmax Ca2+ bound (cm−1 M−1) | 88,000 | 37,000 | 50,000 |
| Φ Ca2+ bound | 0.14 | 0.65 | 0.44 |
| Fmax/Fmin | ∼100 | ∼12 | ∼12 |
| Reference | Haugland and Johnson, 1999 | Tian et al., 2009; Akerboom et al., 2012 | Zhao et al., 2011 |
Two available values for key parameters from the Looger and Campbell laboratories are listed for GCaMP3. The Fmax/Fmin ratio is the ratio of emission fluorescence intensities in the presence (Fmax) and absence of saturating Ca2+ (Fmin). Thus, both indicators increase in emission intensity when Ca2+ is bound. The peak excitation and emission wavelengths are for the Ca2+-bound indicators. Further information is available in the indicated references. Ca2+ affinity indicates the dissociation constant (Kd). The εmax Ca2+ bound (cm−1 M−1) for Fluo-4 is quoted from the Invitrogen Molecular Probes website (http://tools.invitrogen.com/content/sfs/manuals/mp01240.pdf). The values were measured with the indicators in solution at a pH of ∼7.2. εmax, peak extinction coefficient; Φ, quantum yield.
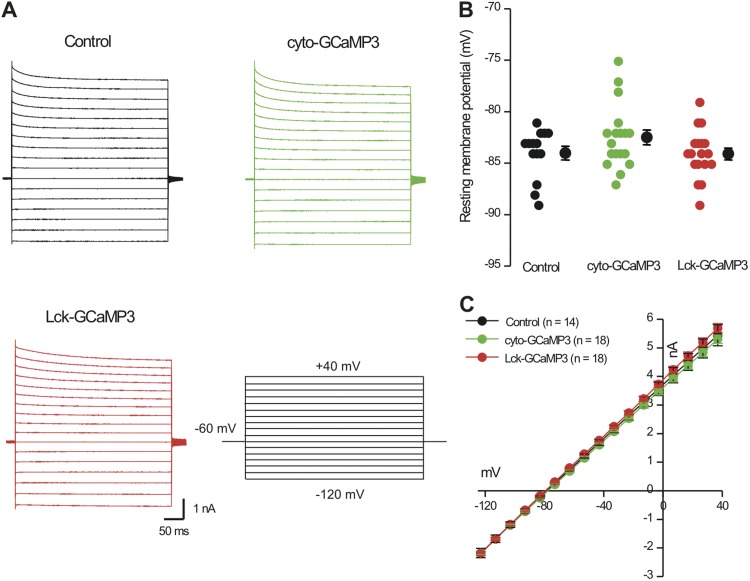
Figure 5.
Expression of Lck-GCaMP3 and cyto-GCaMP3 did not affect basic astrocyte electrophysiological properties. Electrophysiological traces (A) and average data for resting membrane potentials (B) and current–voltage relations (C) gathered from astrocytes under the conditions indicated.
Immunohistochemistry (IHC)
After the confocal imaging experiments, brain slices were postfixed in 4% paraformaldehyde overnight at 4°C. The slices were then washed three times with PBS, permeablized with 0.5% Triton X-100 (45 min at 4°C), and treated with 10% normal goat serum (2 h at 4°C). Slices were then incubated with primary antibodies for 48 h at 4°C. Primary antibodies used were rabbit anti-GFP (1:1,000; Invitrogen), chicken anti-GFP (1:1,000; Invitrogen), chicken anti–glial fibrillary acidic protein (GFAP; 1:500; Abcam), rabbit anti-NG2 (1:1,000; EMD Millipore), rabbit anti–aquaporin 4 (AQP4; 1:200; EMD Millipore), and rabbit anti-Iba1 (1:1,000; Wako Chemicals USA). The anti-GFP antibodies were used to label GCaMP3. After being washed with PBS three times, slices were incubated with Alexa Fluor 488 or Alexa Fluor 546–conjugated secondary antibodies (1:800; Invitrogen) for 3 h at 21–25°C. Slices were washed three times with PBS before being mounted on glass coverslips. Images were taken on a confocal microscope (Fluoview 300; Olympus) with a 40× oil-immersion lens with a numerical aperture of 1.3. Alexa Fluor 488 and Alexa Fluor 546 were excited by the 488-nm line of an Argon laser and the 543-nm line of a HeNeG laser, respectively. We used 10% of the maximum output of an Argon laser (16.9 mW) and 50% of the maximum output of a HeNeG laser (5 mW). The emitted light pathway consisted of a dichroic mirror (SDM560) and an emission filter (505–525 nm for Alexa Fluor 488 and 560–600 nm for Alexa Fluor 546).
High resolution electron and light microscopy analysis of branchlets
For light microscopy, 100-µm-thick slices of adult rat brain fixed by transcardial perfusion of 4% PFA in 0.1 M PBS were used to iontophoretically fill astrocytes in CA1 stratum radiatum with 5% Lucifer yellow-CH. After additional postfixation in PFA, slices were embedded in Gelvatol, and confocal volumes were collected with a confocal microscope (Fluoview 1000; Olympus) using a 1.42-NA 60× oil objective. Blind deconvolution was performed using AutoQuant (Media Cybernetics). Volumes were rendered binary using the Bernsen automatic local thresholding method in Fiji (Schindelin et al., 2012), and fractal analysis was performed using the local subscan method of the FracLac plugin (Karperien, 2012). For electron microscopy analysis, an adult mouse brain was Golgi-impregnated and embedded in Durcupan resin, and a neocortical astrocyte was mounted on an aluminum specimen rivet. The astrocyte was imaged with a Gatan 3View installed on an FEI Quanta SEM and imaged at 30-Pa chamber pressure and 2.0-kV accelerating voltage. The final XY pixel size was 22 nm, and images were collected with 70-nm Z steps. Data analysis was performed with Imaris (Bitplane).
Basic properties of GCaMP3 in relation to Fluo-4
The basic properties of the Fluo-4 and GCaMP3 Ca2+ indicators used in this study are briefly described as follows. The GCaMP3 GECI has a peak excitation wavelength of 497 nm and a peak emission wavelength of 514 nm in the presence of saturating Ca2+ concentrations. Ca2+ has an affinity of ∼542–660 nM, and Ca2+ binding results in an ∼12-fold change in peak emission intensity with little shift in the peak wavelengths. Similarly, Fluo-4 has a peak excitation wavelength of 494 nm and a peak emission wavelength of 516 nm in the presence of saturating Ca2+ concentrations. Ca2+ has an affinity of ∼350 nM, and Ca2+ binding results in an ∼100-fold change in peak emission intensity with little shift in the peak wavelengths. The values reported here are from past studies that characterized these Ca2+ indicators in solution (see Haugland and Johnson, 1999, and Tian et al., 2009; Zhao et al., 2011; Akerboom et al., 2012) because of course these parameters cannot be measured in brain slices using confocal microscopy. Because neither GCaMP3 nor Fluo-4 shows spectral shifts upon Ca2+ binding, but instead displays changes in emission intensity, both are intensity-based, single-wavelength Ca2+ indicators (Table 1).
Data analysis
Slow drifts in astrocyte position (∼2–5 µm) were corrected with the TurboReg Plugin in National Institutes of Health (NIH) ImageJ (Thévenaz et al., 1998). Astrocyte territory sizes for all experiments were quantified by measuring the area of a region of interest (ROI) that surrounded the largest fluorescence projection profile of bushy astrocytes gathered from a series of confocal images. We performed Ca2+ imaging experiments in a single optical plane. Ca2+ transients were measured by plotting the intensity of ROI over time, after the intensity of a background ROI had been subtracted. ROI were selected based on the appearance of Ca2+ signals in the time series images, which were processed by the 3-D Hybrid Median Filter Plugin in ImageJ. A signal was declared as a Ca2+ transient if it exceeded the baseline by greater than twice the baseline noise (standard deviation). Data were analyzed using pCLAMP10 (Molecular Devices), Origin 8 (Origin Laboratory Corporation), ImageJ (NIH), and GraphPad InStat 3.06 (GraphPad Software, Inc.). Data are shown as mean ± SEM from n determinations from at least nine different experiments. Statistical tests were run in Graphpad InStat using paired or unpaired Student’s t tests as appropriate, with statistical significance being declared at P < 0.05.
Chemicals
All reagents were from VWR, Invitrogen, Sigma-Aldrich, or Ascent Scientific.
Online supplemental material
Video 1 is a movie of an astrocyte loaded with Fluo-4AM and imaged for 5 min. Video 2 shows an astrocyte expressing Lck-GCaMP3 and imaged for 5 min. Video 3 is an astrocyte expressing cyto-GCaMP3 and imaged for 5 min. Video 4 is a movie of a Golgi-impregnated astrocyte imaged by serial block-face SEM. Videos 1–4 are available at http://www.jgp.org/cgi/content/full/jgp.201210949/DC1.
RESULTS
Robust expression of GECIs in astrocytes using AAV2/5 and the gfaABC1D promoter
We used the GCaMP3 GECI (Tian et al., 2009) because detailed characterization work in cell culture shows it has higher basal fluorescence than GCaMP5 and because both GECIs detect the same number of astrocyte Ca2+ microdomains (Akerboom et al., 2012). GCaMP5 is better for tracking fast millisecond time scale action potential signals in neurons, but these have not been observed in astrocytes (Tian et al., 2009). As recently discussed, we also considered the higher fluorescence of GCaMP3 desirable for imaging the highly ramified astrocytes in thick brain slices, which scatter light (Tong et al., 2012). For membrane targeting in situ after in vivo expression, we used the N-terminal domain of Lck, a Src tyrosine kinase, that efficiently recruits proteins to the membrane (Shigetomi et al., 2010b, 2012) (Fig. 1, A and B). For selective expression within astrocytes, we used AAVs of the 2/5 serotype (Ortinski et al., 2010) (AAV2/5) and the putative astrocyte-specific minimal GFAP gfaABC1D promoter (Xie et al., 2010).
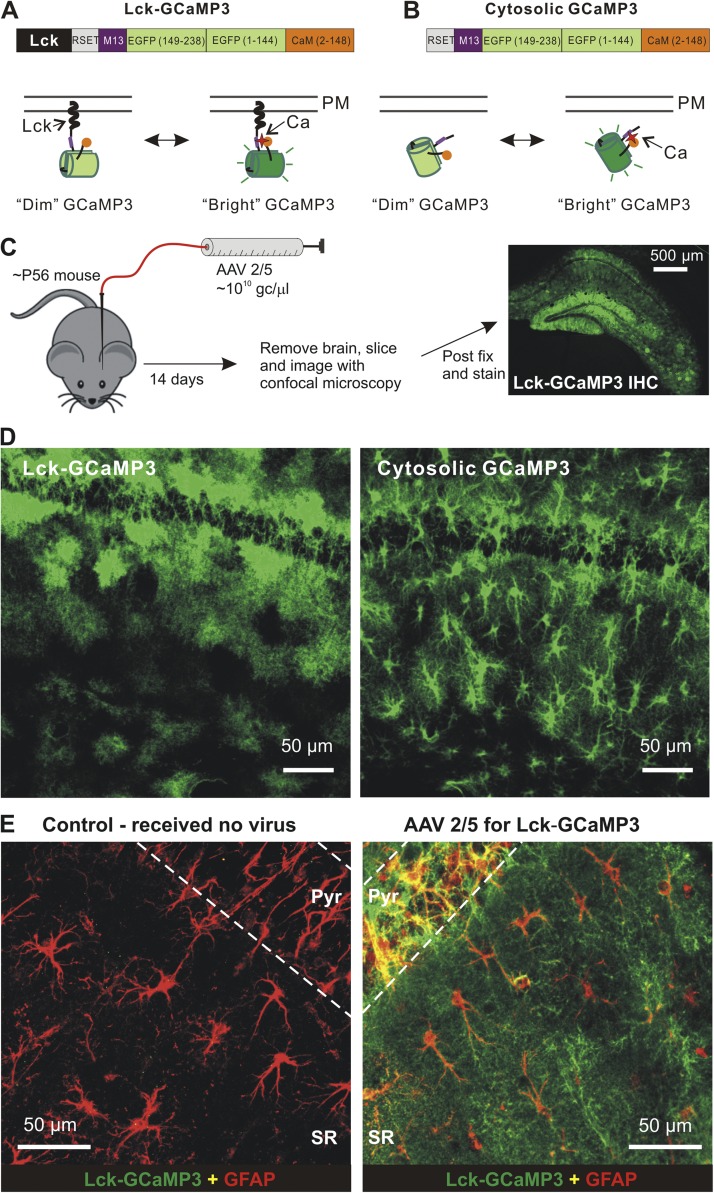
Figure 1.
Expression of cyto-GCaMP3 and Lck-GCaMP3 throughout astrocytes. (A and B) Cartoons of differences between cytosolic and membrane-targeted GECIs. (C) Schematic illustrates the protocol for AAV2/5 microinjections into the hippocampus. The right-hand image shows the expression of Lck-GCaMP3 throughout the hippocampus. (D) Expression within the stratum radiatum region for Lck-GCaMP3 and cyto-GCaMP3 (these panels are also shown in Fig. 2 in the bottom row of images in relation to neuron staining). (E) Representative images showing GFAP and GCaMP3 staining for the stratum radiatum region from control mice that received no AAVs and those that received AAV2/5 Lck-GCaMP3. The image is a zoomed-out view.
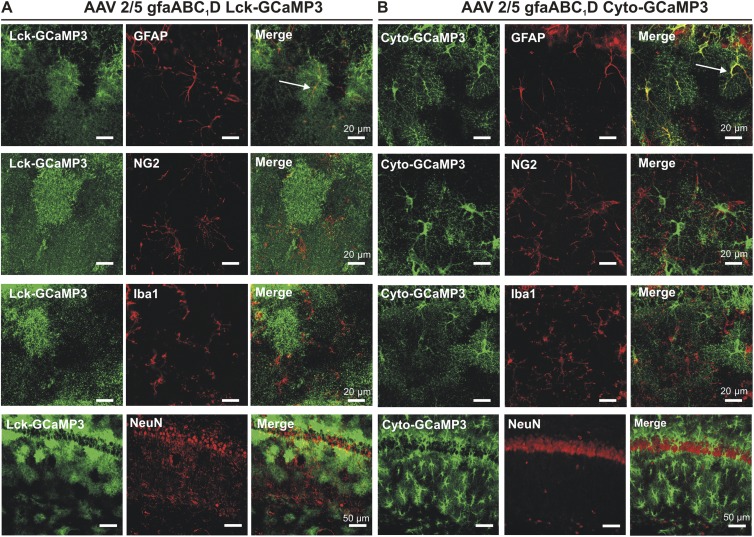
Microinjection of AAV2/5 in vivo resulted in reliable, robust, and mosaic expression of cytosolic GCaMP3 (cyto-GCaMP3) and membrane-tethered Lck-GCaMP3 within astrocytes throughout the hippocampus of adult mice (Fig. 1, C–E). Based on immunohistochemical analysis, GECI expression was not detected within neurons, NG2 cells, or microglia, demonstrating that the combination of AAV2/5 and the gfaABC1D promoter selectively targets astrocytes (Fig. 2). Lck-GCaMP3 revealed the highly bushy nature of astrocytes, whereas cyto-GCaMP3 additionally revealed branches and internal volumes such as endfeet (Fig. 1 D). We attribute these differences to the fact that cyto-GCaMP3 and Lck-GCaMP3 are volumetric and surface area GECIs, respectively. Both GECIs clearly demarcated astrocyte territories (Figs. 1 and 2).
Figure 2.
Lck-GCaMP3 (A) and cyto-GCaMP3 (B) colocalization with markers for astrocytes (GFAP), NG2 cells (NG2), microglia (Iba1), and neurons (NeuN). Colocalization was only found with GFAP.
GECIs are expressed in entire astrocyte territories
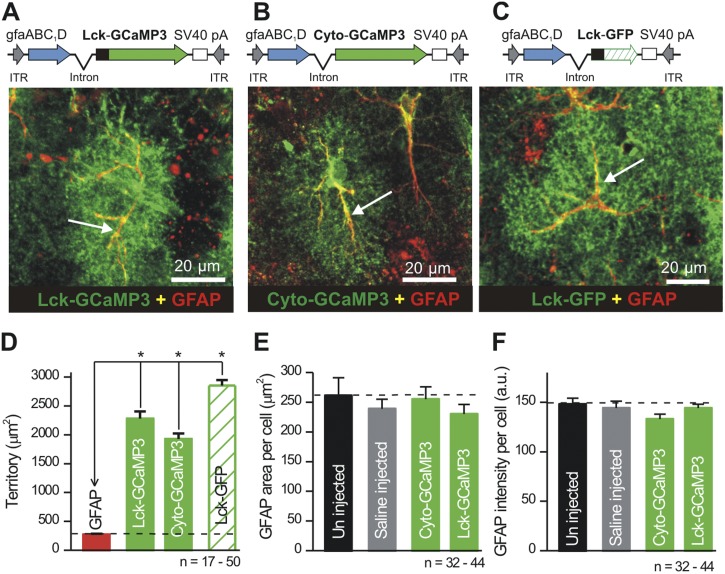
We quantified GECI expression in astrocytes with IHC and found that astrocyte territories delineated by GECIs were much larger than those of GFAP (Fig. 3, A–D) and those detected using bulk loading of Ca2+ indicator dyes (Reeves et al., 2011). For comparison, we measured territory sizes using Lck-GFP as a control, which lacks a Ca2+ sensor domain. We found similar values using this control (Fig. 3 D; n = 17–50 cells from three to five mice), substantiating the conclusion that cyto-GCaMP3, Lck-GCaMP3, and Lck-GFP reveal entire astrocytes. The dimensions of the maximum projection territories revealed with cyto-GCaMP3 and Lck-GCaMP3 were consistent with past detailed electron microscopy analysis (Bushong et al., 2002), with sizes at ∼2,000 µm2. The apparent territories of Lck-GCaMP3–expressing cells were significantly larger by ∼10% than those of cyto-GCaMP3–expressing astrocytes (P < 0.05 with an unpaired Student’s t test), and the apparent territories of Lck-GFP–expressing cells were significantly larger by ∼20% than those of Lck-GCaMP3 or cyto-GCaMP3–expressing astrocytes (P < 0.05 with unpaired Student’s t tests; Fig. 3 D). Overall, Lck-GCaMP3, cyto-GCaMP3, and Lck-GFP territories were significantly (∼10-fold) larger than those observed with GFAP (Fig. 3 D; P < 0.05 with pairwise unpaired Student’s t tests). We interpret this result to indicate that the reporters have differing abilities to delineate astrocytes territories.
Figure 3.
Expression of cyto-GCaMP3 and Lck-GCaMP3 in astrocytes does not cause gliosis. (A–C) The top panels show the design of AAV2/5 constructs, and the bottom images show the results of IHC for Lck-GCaMP3, cyto-GCaMP3, and Lck-GFP with GFAP. (D) Summary bar graph showing areas of GFAP-labeled processes in relation to the areas of astrocytes expressing Lck-GCaMP3, cyto-GCaMP3, and Lck-GFP. (E and F) Summary graphs of GFAP-labeled areas and GFAP intensity for the experimental conditions indicated. *, P < 0.05 when compared with an unpaired Student’s t test.
We next compared GFAP expression level intensities and the areas of GFAP-positive processes for astrocytes expressing cyto-GCaMP3 and Lck-GCaMP3, in relation to control mice that received no microinjections and also in relation to mice that received saline microinjections (Fig. 3, E and F; n = 32–44 cells from three to four mice). We found no significant differences across these experiments, providing no evidence for measurable astrocyte reactivity (Ortinski et al., 2010) caused with either the microinjection procedure or the AAV2/5, which drives GECI expression (Fig. 3).
GECIs overcome the limitations of organic calcium indicator dyes and reveal unexpectedly high numbers of calcium signals within astrocytes
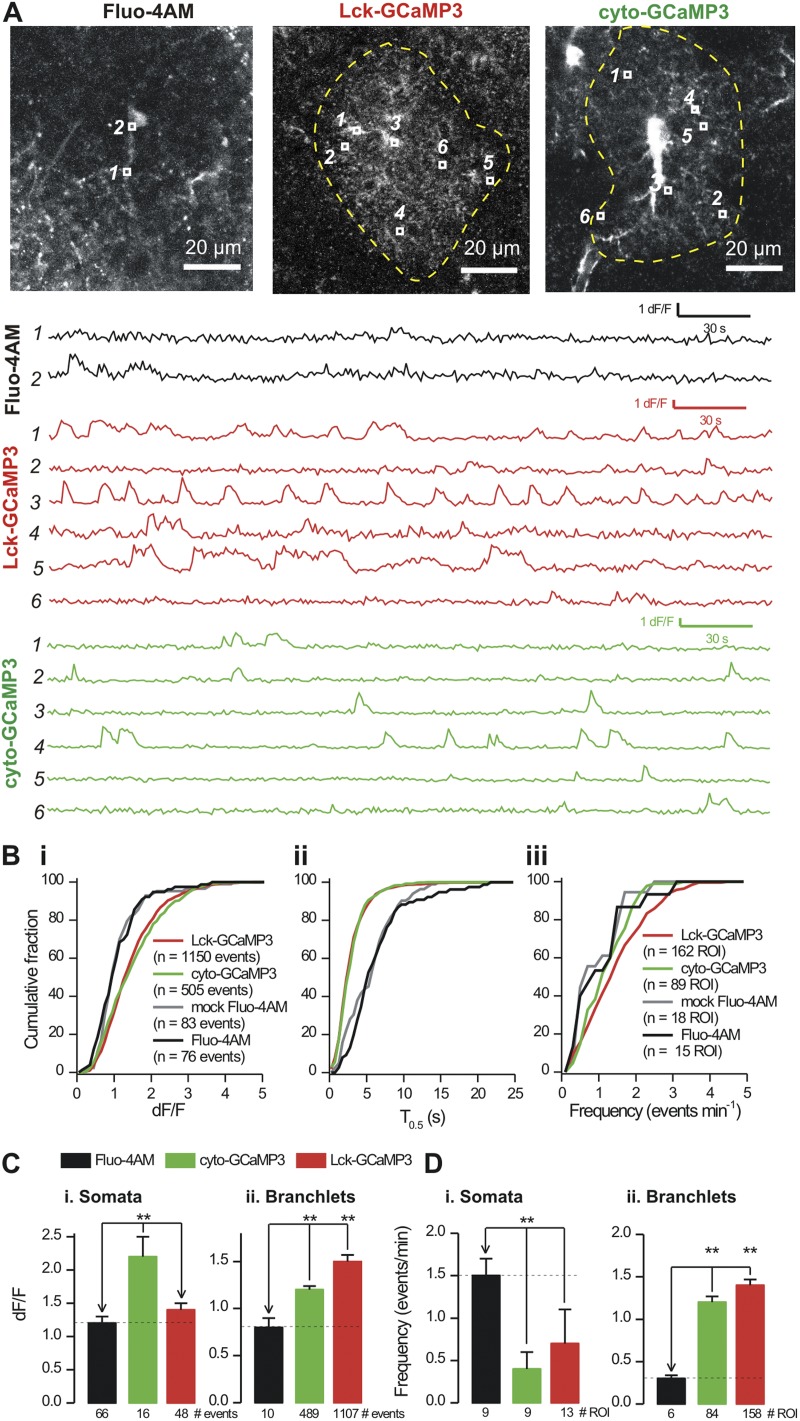
We identified astrocytes expressing cyto-GCaMP3 and Lck-GCaMP3 and examined spontaneous Ca2+ signals within them compared with those from control and saline-injected mice that had been bulk loaded with Fluo-4AM (Fig. 4 A). Inspection of the movies revealed high numbers of Ca2+ microdomains within entire astrocytes expressing cyto-GCaMP3 and Lck-GCaMP3, whereas astrocytes loaded with Fluo-4AM displayed small and infrequent signals only in the soma and thickest branches (Videos 1–3). These findings are clear from the intensity plots for ROI (Fig. 4 A) as well as from the videos. To quantify this result, we analyzed all Ca2+ signals in astrocytes to quantify their basic properties (Fig. 4 B, i–iii). This analysis revealed that signals measured with cyto-GCaMP3 and Lck-GCaMP3 were ∼25% larger, ∼47% shorter, and more frequent than those measured with Fluo-4AM (Fig. 4 B). Average data showed that cyto-GCaMP3 and Lck-GCaMP3 revealed ∼60–90 Ca2+ signals per astrocyte (over 5 min), whereas Fluo-4AM revealed ∼8 signals per astrocyte (Fig. 4 B). Collectively, these data reveal an unexpectedly high number of Ca2+ transient microdomain events within the territory occupied by the branchlets of an individual astrocyte.
Figure 4.
Ca2+ signals measured with Fluo-4, cyto-GCaMP3, and Lck-GCaMP3. (A) Representative images of an astrocyte loaded with Fluo-4AM and expressing Lck-GCaMP3 and cyto-GCaMP3. ROI are shown in each image, and their intensities are plotted below. (B) Cumulative probability plots for Ca2+ event peak response (i), T0.5 (ii), and frequency (iii) for the indicated experimental groups. The distributions in each experimental condition were different between Lck-GCaMP3 and cyto-GCaMP3 on the one hand, and Fluo-4AM from control and mock (saline-injected) mice on the other (Kolmogorov–Smirnov test). (C and D) Summary graphs for Ca2+ signal properties for astrocyte somata and branchlets under the experimental conditions indicated. Data were gathered from n > 9 for each experimental condition. **, P < 0.01 when compared with an unpaired Student’s t test.
GECIs do not detectably alter astrocyte physiology
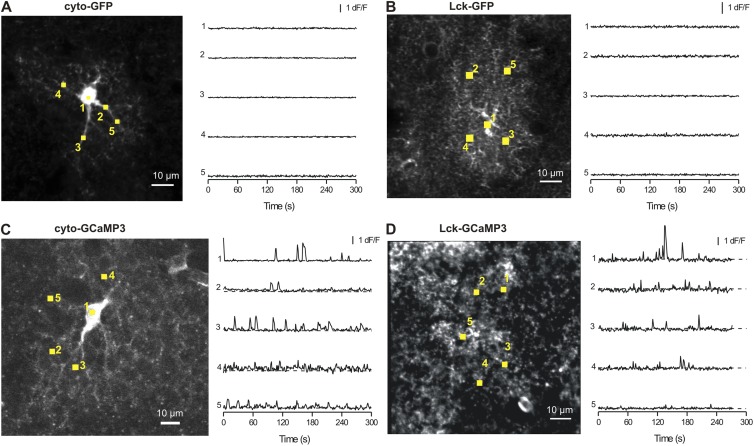
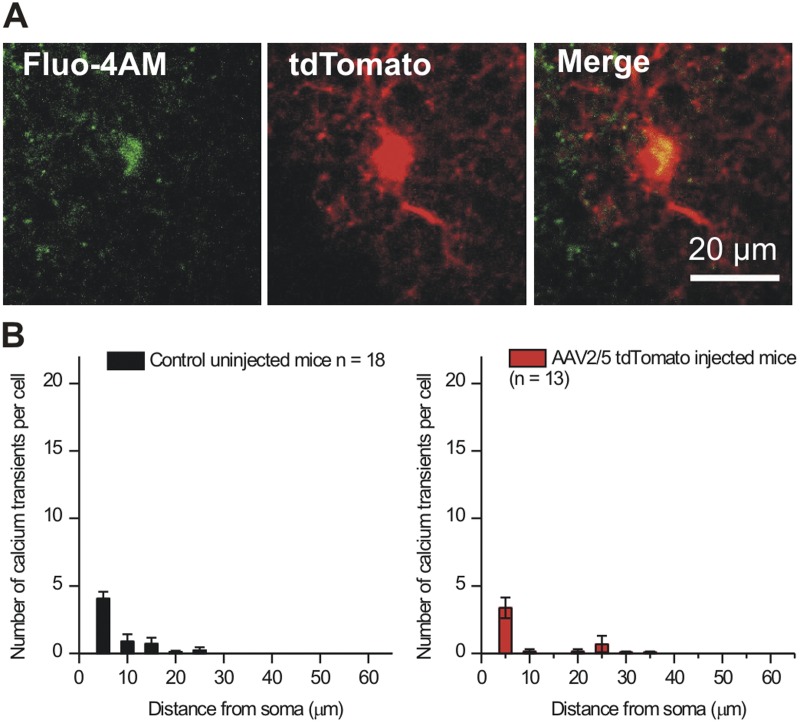
We performed several sets of detailed controls to ensure that our procedures to express cyto-GCaMP3 and Lck-GCaMP3 did not adversely affect astrocytes. First, experiments with Fluo-4AM showed that there were no differences in Ca2+ signals between control and saline-injected mice (Fig. 4 B, i–iii), demonstrating that microinjections per se do not alter astrocyte Ca2+ signals. Second, expression of cyto-GCaMP3 or Lck-GCaMP3 did not change the electrophysiological properties of astrocytes, which displayed equally negative membrane potentials and equally large K+ currents (Fig. 5). Third, we made and used control viruses for Lck-GFP and cyto-GFP and found that astrocytes expressing these fluorescent proteins were fluorescent but did not display fluctuations in dF/F as observed by GECIs (Fig. 6). This rules out movement artifacts as contributing measurably to the peaky signals measured with cyto-GCaMP3 and Lck-GCaMP3. Fourth, AAV2/5-mediated expression of tdTomato within astrocytes did not alter Ca2+ signals measured by Fluo-4AM (Fig. 7), indicating that AAV2/5-mediated expression of fluorescent proteins does not cause increased Ca2+ signals. Collectively, these controls indicate that AAV2/5 microinjection did not detectably alter astrocytes.
Figure 6.
Controls with AAV-expressing cyto-GFP and Lck-GFP. Representative images and traces for ROI (as shown) for astrocytes expressing cyto-GFP (A), Lck-GFP (B), cyto-GCaMP3 (C), and Lck-GCaMP3 (D). No peaks in fluorescence were observed in cells expressing cyto-GFP and Lck-GFP. Hence, those observed for astrocytes expressing cyto-GCaMP3 and Lck-GCaMP3 are caused by Ca2+ signals and not by movement of astrocyte branchlets.
Figure 7.
AAV2/5 does not cause more Ca2+ signals as measured by Fluo-4AM. The data reported in the Results show that many more Ca2+ signals were measured with GECIs than with Fluo-4AM. The data strongly indicate that this is because GECIs sample entire astrocytes. However, to make sure that AAV2/5-mediated expression of a fluorescent protein did not alter the number of Ca2+ signals, we made AAV2/5 for the red fluorescent protein tdTomato and imaged Ca2+ signals from tdTomato-expressing cells using Fluo-4 (A; GCaMP3 cannot be used in conjunction with Fluo-4 to address this issue because the fluorophores have spectral overlap). The Ca2+ signals measured from cells expressing tdTomato were indiscernible from those measured using Fluo-4AM in control uninjected mice (B). These data provide strong evidence that AAV2/5-mediated expression of GECIs and tdTomato does not alter astrocyte Ca2+ signaling.
GECIs reveal equivalently scaled calcium signals from entire astrocyte territories including branchlets and endfeet
The graphs in Fig. 4 (C and D) statistically compare Ca2+ signals measured with GECIs with those measured using Fluo-4AM (the stars indicate a significant difference relative to Fluo-4AM; P < 0.05 using pairwise unpaired Student’s t tests). Using GECIs, we made four observations on spontaneous Ca2+ signals in somata and branchlets, which are the finer secondary and tertiary structures that emanate from branches. (1) Events detected in the somata with cyto-GCaMP3 were larger than those detected with either Fluo-4AM or Lck-GCaMP3 (Fig. 4 C; P < 0.05 with unpaired Student’s t tests). (2) In the branchlets, both GECIs were significantly better than Fluo-4AM in revealing Ca2+ signals in terms of frequency and dF/F (Fig. 4, C and D). Lck-GCaMP3 was also ∼20% better than cyto-GCaMP3 in the branchlets in terms of dF/F of the Ca2+ signals (Fig. 4 C; P < 0.05 with an unpaired Student’s t test). (3) In the branchlets, both GECIs reported many more events than Fluo-4AM, with a trend showing that the greatest numbers were observed with Lck-GCaMP3 (Fig. 4 D), but there were no significant differences in the frequency of the signals measured with Lck-GCaMP3 and cyto-GCaMP3 (Fig. 4 D; P > 0.05 with an unpaired Student’s t test). (4) Both GECIs were more stable than Fluo-4AM (Fluo-4 bleached by −38 ± 8% in 5 min [n = 15], whereas the GECIs bleached <2% [n = 89 and 180]).
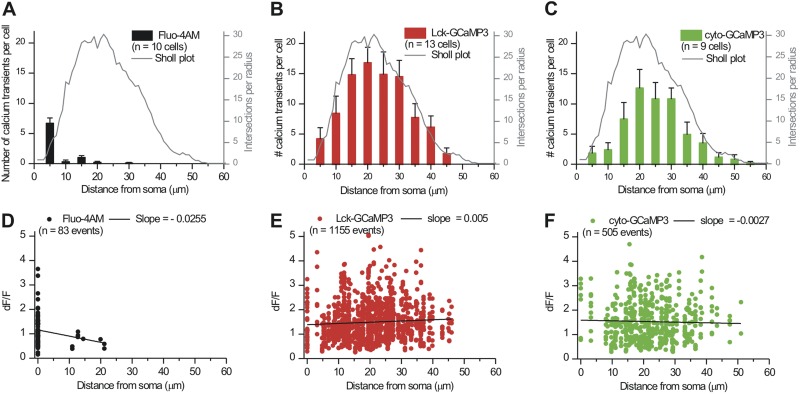
Next, we assessed how reliably cyto-GCaMP3 and Lck-GCaMP3 (as well as Fluo-4 for comparison) sampled astrocyte territories (Fig. 8, A–C). Our past analysis shows that astrocytes are least branched near the soma and most branched ∼20 µm away (Reeves et al., 2011). With this as a point of reference (Fig. 8, A–C, gray lines), we plotted the location of spontaneous Ca2+ signals measured with Fluo-4AM, cyto-GCaMP3, and Lck-GCaMP3 within astrocytes (Fig. 8, A–C). This analysis confirmed that most Ca2+ signals measured with Fluo-4AM were within the first ∼10 µm (Fig. 8 A). In contrast, with cyto-GCaMP3 and Lck-GCaMP3, most Ca2+ signals were measured at >20 µm from the soma, and the overall shape of the graph representing the occurrence of Ca2+ signals as a function of distance mirrored the astrocyte Sholl plot (Fig. 8, A–C). Both cyto-GCaMP3 and Lck-GCaMP3 were far superior to Fluo-4AM, and there was a trend for Lck-GCaMP3 to detect more Ca2+ signals than cyto-GCaMP3 (Fig. 8, B and C). To compare the ability of Lck-GCaMP3 and cyto-GCaMP3 to detect Ca2+ signals as a function of distance from the soma, we compared the number of transients measured with these GECIs at increasing distances from the soma in 5-µm bins (Fig. 8, B and C). This analysis showed that Lck-GCaMP3 was significantly better than cyto-GCaMP3 at 10 and 15 µm from the soma (P < 0.05 with unpaired Student’s t tests). However, at greater distances from the soma, there were no statistically significant differences between the two GECIs (P > 0.05 with unpaired Student’s t tests for each distance bin beyond 15 µm). Thus, overall, the GECIs compare quite well with each other over entire territories.
Figure 8.
Analysis of Ca2+ signals in astrocyte territories. (A) The black bars represent the numbers of Ca2+ signals measured per Fluo-4AM bulk-loaded astrocyte as a function of distance from the soma (5-µm bins). The corresponding y axis is on the left. The gray line is for comparison and shows an average astrocyte Sholl plot (Reeves et al., 2011) (y axis on the right). (B and C) As in A, but for Ca2+ events detected from cells expressing Lck-GCaMP3 or cyto-GCaMP3. (D–F) Scatter graphs of Ca2+ event peak amplitudes (dF/F) as a function of distance from the somata.
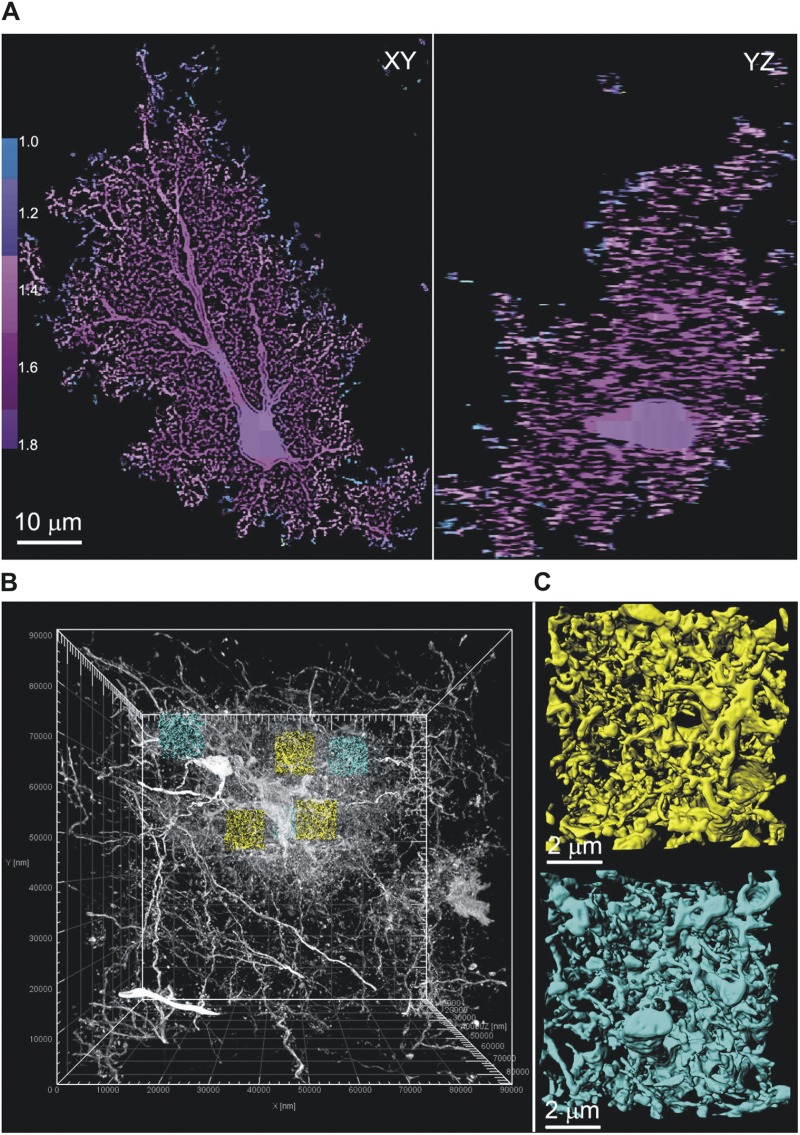
Surprisingly, we found that there was little change in the amplitude of the Ca2+ signals detected with cyto-GCaMP3 and Lck-GCaMP3 across the territory occupied by the branchlets of an individual astrocyte (Fig. 8, E and F), whereas there was a precipitous decrease in their magnitude measured with Fluo-4AM (Fig. 8 D). As far as we know, this has not been observed previously, and thus our findings demonstrate that Ca2+ signals within an individual astrocyte’s territory are equivalent and independent of location. This has important implications for how astrocytes may regulate different synaptic domains of neurons and other cells within their territories. We sought a structural explanation for this result by determining if perisynaptic astrocyte branchlets are also equally abundant in regions near the soma and in the periphery of astrocytes. To this end, we analyzed the complexity of branchlets across the territories of Lucifer yellow–filled astrocytes (n = 6) in diffraction-limited confocal volumes (Fig. 9 A). As assessed by the fractal dimension (DF), the complexity of astrocyte processes was found to be consistent (DF = 1.7) from the perisomatic region to the most peripheral extent of territories, where DF rapidly decreased in value (Fig. 9 A; n = 6). Recognizing that the finest perisynaptic branchlets are difficult to resolve with light microscopy, we also performed serial block face–scanning electron microscopy to reconstruct a complete Golgi-impregnated astrocyte. We confirmed that the morphology of the finest astrocyte branchlets directly adjacent to the soma and in the periphery were indiscernible in morphology and density, with very similar average surface area-to-volume ratios (0.021/nm perisomatic vs. 0.020/nm peripheral) (Fig. 9, B and C, and Video 4).
Figure 9.
High resolution electron and light microscopy analysis of branchlets in astrocytes. (A) Orthogonal slices through a confocal volume of a dye-filled astrocyte. Box-counting fractal analysis was performed to determine the local DF across the astrocyte territory. The vast majority of the territory has a DF of ∼1.7, extending from the soma to the periphery, as shown by the color scale bar. (B) Electron microscopic volume of an entire Golgi-impregnated astrocyte. Three perisomatic (yellow) and three peripheral (cyan; one of them is behind a yellow one in the view shown) subvolumes (∼680 µm3 each) have been extracted to determine surface area and volume of astrocyte branchlets. (C) Close-up views of astrocyte processes in perisomatic and peripheral subvolumes demonstrating dense network of fine branchlets in both regions. The entire astrocyte is rendered in 3-D in Video 4.
Imaging Ca2+ signals in endfeet
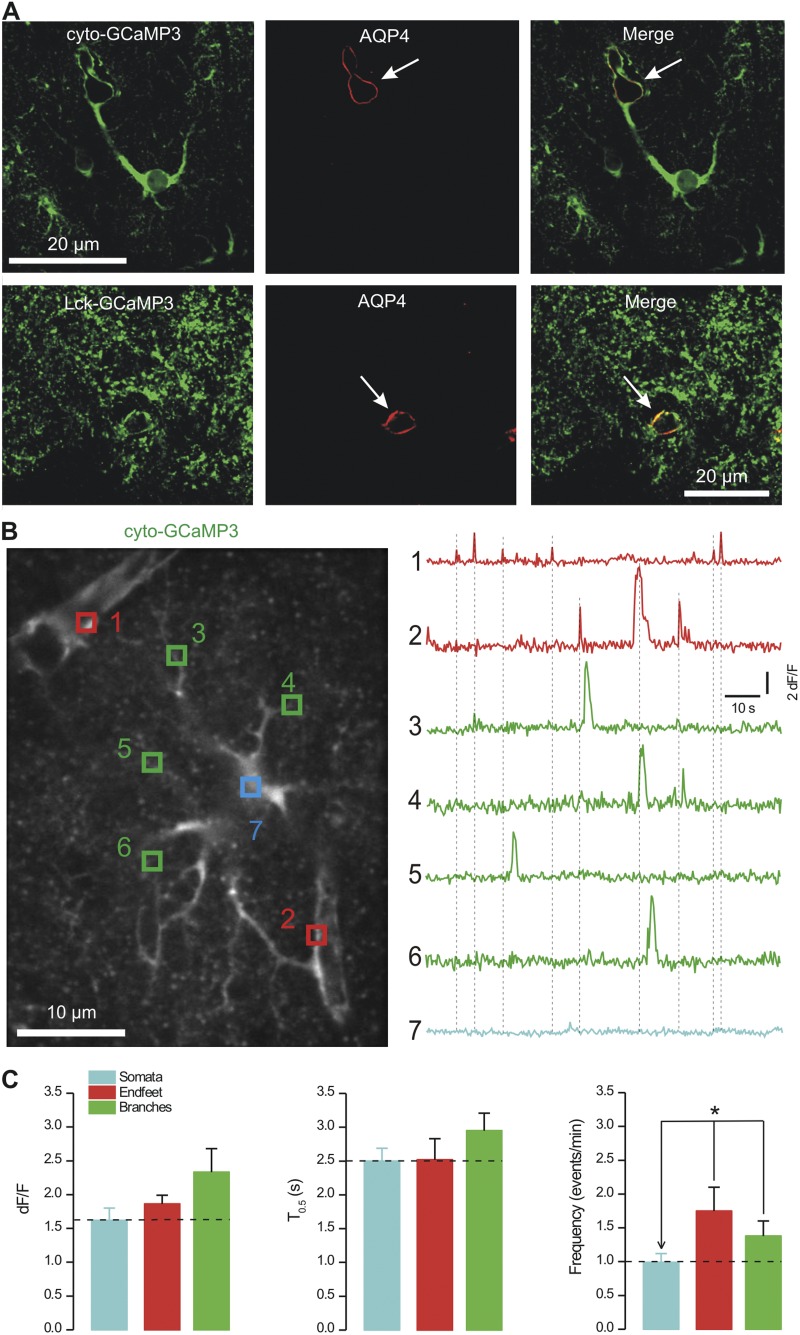
Our initial expression analysis suggested that cyto-GCaMP3 revealed endfeet better than Lck-GCaMP3 (Fig. 1 D), likely because these contacts between astrocytes and blood vessels have larger volumes that are presumably internally filled with cyto-GCaMP3. Colocalization experiments between the GECIs and AQP4 (a marker for endfeet) confirmed these findings and showed that cyto-GCaMP3 robustly revealed endfeet enwrapping blood vessels in the stratum radiatum of the hippocampus (Fig. 10 A). Endfeet were also observed using Lck-GCaMP3 (Fig. 10 A), but the major drawback of this GECI was that it was not possible to image endfeet and follow branches back toward the soma. Moreover, because of the highly bushy nature of the signals, it was not possible to unequivocally associate endfeet to any one of two nearby astrocytes when using Lck-GCaMP3 (e.g., see Fig. 10 A). We suggest that these difficulties arise because Lck-GCaMP3 is strongly membrane tethered and does not fill internal volumes of astrocytes (Fig. 1 D). On the other hand, it was simple to image endfeet and follow branches to the somata with cyto-GCaMP3 (Fig. 10, A and B). In light of this, we focused on using cyto-GCaMP3 to monitor Ca2+ signals in endfeet, branches, and somata simultaneously and found that the signals were not synchronous between these three compartments (Fig. 10 B; n = 12). Thus, Ca2+ signals measured in endfeet were independent of those recorded from branches and somata (Fig. 10 B). Such signals displayed similar dF/F and half-widths but were significantly more frequent within endfeet when compared with the somata (Fig. 10 C; P < 0.05 when compared with an unpaired Student’s t test). On the other hand, the frequency of signals measured in branches was intermediate between that measured from the somata and endfeet, but not statistically significantly different from either (Fig. 10 C; P > 0.05 when compared with an unpaired Student’s t test). Collectively, the (a) broad expression of GECIs in astrocytes, (b) localized and equivalent nature of Ca2+ signals within branchlets, (c) equivalently bushy nature of astrocyte territories (Ventura and Harris, 1999), and (d) nonsynchronous nature of endfeet Ca2+ signals provide compelling evidence that our approaches reveal Ca2+ signals from within entire individual astrocytes.
Figure 10.
Cyto-GCaMP3 reveals Ca2+ signals in endfeet. (A) The panels show representative IHC data from optical sections of 3-µm thickness for cyto-GCaMP3 and Lck-GCaMP3 in relation to the endfoot marker AQP4. We found that cyto-GCaMP3 revealed endfeet that enwrapped blood vessels (white arrow), whereas Lck-GCaMP3 revealed smaller fine associations of astrocytes with blood vessels. Note that the staining for Lck-GCaMP3 appears somewhat punctuate in the images that are shown. We attribute this to the fact that these IHC images are from fixed tissue. Also, one must remember that Lck-GCaMP3 is better at labeling the finest processes (in relation to cyto-GCaMP3), which look punctate because they are tiny (see Results). (B) Representative image of an astrocyte expressing cyto-GCaMP3 and with two endfeet onto blood vessels (representative of 12 cells from four mice). The intensities over time of the numbered ROI are shown on the right. Clear endfeet Ca2+ signals, which were independent of those in branches or the soma, were easily observed. (C) Average data for Ca2+ signals measured using cyto-GCaMP3 for somatic, endfoot, and branch regions of astrocytes from the stratum radiatum (n = 12 cells from four mice).
DISCUSSION
This study is the first to explore the use of GCaMP-based GECIs in astrocytes in situ from adult mice and shows that cytosolic and membrane-targeted GECIs can be used to study Ca2+ signals from entire astrocytes. There are three main findings. (1) The major drawbacks of studying astrocyte Ca2+ signals with organic dyes are remedied by astrocyte-specific expression of GECIs (Lck-GCaMP3 and cyto-GCaMP3). (2) GECIs allow for imaging of astrocyte Ca2+ signals spanning entire astrocyte territories, including within endfeet. (3) Astrocytes display large numbers of Ca2+ microdomains in their territories. These are important breakthroughs, and as far as we know, GECIs represent the only way to image Ca2+ signals in entire astrocyte territories. The use of these approaches, along with the controls we report, will shed new light on the functions of astrocytes in neuronal circuits and help resolve the current debate on their physiological roles (see Introduction).
Why do GECIs provide superior information on Ca2+ transients in relation to that gathered with bulk loading? Because the GECIs and Fluo-4 were compared side-by-side using the exact same confocal microscope, laser lines, and settings, one can rule out instrumentation differences as the cause. Moreover, the Ca2+ affinity of the GECIs and Fluo-4 is comparable (Table 1). Thus, our experiments strongly suggest that the most straightforward reason why the GECIs are superior to Fluo-4 bulk loading is because they are distributed widely throughout entire astrocytes, whereas Fluo-4 is restricted to the somata (Reeves et al., 2011). This difference in the disposition of the probes is readily apparent and quantified with the data presented in Fig. 3, which shows that the GECIs reveal large parts of entire astrocyte territories with areas of ∼2,000 µm2. In contrast, Fluo-4 reveals only the soma and main branches (Fig. 4 A), leaving ∼90% of the astrocyte unsampled (i.e., ∼1,800 µm2 was not loaded sufficiently to image any fluorescence above background levels) (Reeves et al., 2011).
A note on controls and their continuing need in future studies
In this study, we thoroughly characterized the use of AAVs of the 2/5 serotype and their ability, when combined with the minimal promoter gfaABC1D, to express GECIs selectively within astrocytes. In brief, we have shown (a) robust expression of GECIs in astrocytes of the adult mouse hippocampus; (b) colocalization of GECIs with astrocyte markers, but not with markers for neurons, NG2 cells, or microglia; (c) expression of GECIs within large parts of astrocyte territories; (d) lack of effect of GECI expression on GFAP expression levels and GFAP areas; (e) comparisons of Ca2+ signals measured with Fluo-4AM and GECIs in somata and branches; (f) lack of effect of GECI expression on the basic electrophysiological properties of astrocytes; (g) lack of effect of virus infection (with control tdTomato viruses) on spontaneous Ca2+ signals observed with Fluo-4AM; (h) controls to show that the peaky Ca2+ signals observed with GECIs cannot be accounted for by movement of astrocytes (using control viruses for GFP and Lck-GFP); and (i) detailed characterization on astrocyte Ca2+ signals in relation to branches and endfeet.
We performed all the aforementioned controls and experiments on mouse hippocampus, with viral injections performed at ∼P63 and with experimental evaluations performed at ∼P80, i.e., about 2 wk after microinjection. We did this because these experimental conditions relate most closely to our experimental goals and ongoing studies on the potential role(s) of astrocyte Ca2+ signals in the hippocampus that we hope to report in follow-up detailed studies. However, it is not appropriate to conclude that these controls diminish or replace the need for further controls if AAVs are used to express GECIs in other parts of the brain or if the mice (or brain slices) are analyzed at different time points after microinjections. As such, our experiments should not be taken out of context, and future investigators will need to perform all the relevant controls for themselves for their own particular experimental paradigms, taking into account the brain region being studied and the age of the mice being used. Such controls will continue to be important especially because astrocytes in different parts of the brain are heterogeneous (Zhang and Barres, 2010) and display age-dependent changes in function (Sun et al., 2013). The need for control experiments by individual users is particularly apt and relevant for the astrocyte field because of the strong continuing debate between investigators on the most basic aspects of astrocyte physiology (Nedergaard and Verkhratsky, 2012).
Ca2+ signals and their relation to past studies
Using patch-mediated dialysis of astrocytes with high amounts of Ca2+ indicator dyes, Panatier et al. (2011) and Di Castro et al. (2011) recently studied large processes that were 5–20 µm from the soma and between 1.2- and 1.4-µm wide. These main branches are far larger than the fine nanometer scale branchlets and leaflets that are widely considered to be the sites of interaction with synapses (Ventura and Harris, 1999; Bushong et al., 2002). In contrast, the use of GECIs revealed Ca2+ signals in entire astrocytes, including the very periphery up to 50 µm from the soma. Additionally, the dialysis and disruption of astrocyte physiology that occurs with patch-mediated loading (Nett et al., 2002) is avoided using GECIs. As such, the use of GECIs represents a fundamental advance over existing methods to study astrocyte Ca2+ signals, particularly in branches and branchlets. The use of GECIs will also expand our knowledge of astrocyte Ca2+ signals in adult animals. This is significant, because most past studies in situ have used young rodents (typically <3 wk), probably because bulk loading of organic Ca2+ indicators does not work reliably for adults.
We did not observe spontaneous global Ca2+ elevations that covered entire astrocytes with cyto-GCaMP3 or Lck-GCaMP3, and our data show that spontaneous Ca2+ events are local. By virtue of their dimensions, the Ca2+ signals are “microdomains,” but further work is needed to accurately measure their dimensions and those of the underlying branchlets using correlated light and electron microscopy by extending methods we have reported here. Given that astrocyte Ca2+ signals are considered to be a primary basis for interactions with other cells such as neurons, astrocytes, and blood vessels, the molecular basis of the myriad Ca2+ microdomains merits detailed study. This is a significant issue that will require detailed evaluations to satisfactorily address, and several putative mechanisms (e.g., the contributions of intracellular stores, ion channels, and pumps; Nedergaard et al., 2010) need to be rigorously explored using pharmacology and genetic approaches such as knockout mice before evaluating the roles of specific Ca2+ microdomains in specific types of astrocytes (Zhang and Barres, 2010; Oberheim et al., 2012) and in relation to specific types of neurons. In other words, the issue of astrocyte diversity and diversity of Ca2+ signals within astrocytes will require systematic long-term studies before one can propose hypothesis-driven experiments to explore their possible impact on neurons.
Summary and looking forward
We are particularly excited by a new possibility raised by our work, namely that the equally sized Ca2+ microdomains (in terms of dF/F), with spacing independent of location within an astrocyte’s territory, may be adept at locally restricted regulation of vital contributions of astrocytes in the functioning of the brain as a tissue, such as release of trophic factors, responses to injury/trauma, and neurotransmitter clearance (Eroglu and Barres, 2010). Moreover, the ability to measure endfeet Ca2+ signals directly and simultaneously with other parts of the astrocyte will aid the exploration of neurovascular coupling mechanisms in health and disease (Attwell et al., 2010).
It is tempting to suggest that our virus constructs together with recently made floxed mice for cyto-GCaMP3 (Zariwala et al., 2012) and a fluorescence resonance energy transfer–based Ca2+ indicator (Atkin et al., 2009) will be used immediately to image astrocyte Ca2+ signals in vivo. Because of the brightness, signal-to-noise, and stability of the fluorescence signals, GCaMP-based GECIs may provide new opportunities to explore the significance of astrocyte Ca2+ signals for behavior, which are currently unclear. A more immediate and pressing issue concerns if and when astrocytes are engaged in neural microcircuits in situ, and if Ca2+ signals have correlative or causative roles in microcircuit formation and dynamics. These issues must be addressed before we explore and understand more complex astrocyte responses and behavior in vivo, where cellular and biophysical mechanisms cannot be fully explored.
In all the aforementioned endeavors, and in particular for in situ studies, the approaches reported here will open new research areas. They will allow for the exploration of the full panoply of astrocyte Ca2+ signals within entire territories of genetically specified subtypes of astrocytes in different regions of the brain with as of yet unprecedented detail.
Supplementary Material
Acknowledgments
Many thanks to Loren L. Looger for discussions, comments, and feedback throughout the course of this study. Thanks to Amy Baohan for help with some of the immunohistochemistry experiments at the early stages of this project and to Monica Berlanga for providing a Golgi-stained specimen.
The bulk of this study was supported by the NIH (grants NS071292, NS060677, and MH099559) and partly by the CHDI Foundation (to B.S. Khakh). O. Jackson-Weaver was supported by T32 NS007101. The data shown in Fig. 9 involved use of facilities supported by grants from the NIH National Center for Research Resources (grant 5P41RR004050-24) and the National Institute of General Medical Sciences (grant 8 P41 GM103412-24) from the NIH to M.H. Ellisman. E. Shigetomi was partly supported by Takeda Science Foundation and JSPS KAKENHI (grant 24800029).
Edward N. Pugh Jr. served as editor.
Footnotes
Abbreviations used in this paper:
- AAV
- adeno-associated virus
- AQP4
- aquaporin 4
- DF
- fractal dimension
- GECI
- genetically encoded Ca2+ indicator
- GFAP
- glial fibrillary acidic protein
- IHC
- immunohistochemistry
- ROI
- region(s) of interest
References
- Agulhon C., Petravicz J., McMullen A.B., Sweger E.J., Minton S.K., Taves S.R., Casper K.B., Fiacco T.A., McCarthy K.D. 2008. What is the role of astrocyte calcium in neurophysiology? Neuron. 59:932–946 10.1016/j.neuron.2008.09.004 [DOI] [PMC free article] [PubMed] [Google Scholar]
- Akerboom J., Chen T.-W., Wardill T.J., Tian L., Marvin J.S., Mutlu S., Calderón N.C., Esposti F., Borghuis B.G., Sun X.R., et al. 2012. Optimization of a GCaMP calcium indicator for neural activity imaging. J. Neurosci. 32:13819–13840 10.1523/JNEUROSCI.2601-12.2012 [DOI] [PMC free article] [PubMed] [Google Scholar]
- Araque A., Carmignoto G., Haydon P.G. 2001. Dynamic signaling between astrocytes and neurons. Annu. Rev. Physiol. 63:795–813 10.1146/annurev.physiol.63.1.795 [DOI] [PubMed] [Google Scholar]
- Arizono M., Bannai H., Nakamura K., Niwa F., Enomoto M., Matsu-Ura T., Miyamoto A., Sherwood M.W., Nakamura T., Mikoshiba K. 2012. Receptor-selective diffusion barrier enhances sensitivity of astrocytic processes to metabotropic glutamate receptor stimulation. Sci. Signal. 5:ra27 10.1126/scisignal.2002498 [DOI] [PubMed] [Google Scholar]
- Atkin S.D., Patel S., Kocharyan A., Holtzclaw L.A., Weerth S.H., Schram V., Pickel J., Russell J.T. 2009. Transgenic mice expressing a cameleon fluorescent Ca2+ indicator in astrocytes and Schwann cells allow study of glial cell Ca2+ signals in situ and in vivo. J. Neurosci. Methods. 181:212–226 10.1016/j.jneumeth.2009.05.006 [DOI] [PMC free article] [PubMed] [Google Scholar]
- Attwell D., Buchan A.M., Charpak S., Lauritzen M., Macvicar B.A., Newman E.A. 2010. Glial and neuronal control of brain blood flow. Nature. 468:232–243 10.1038/nature09613 [DOI] [PMC free article] [PubMed] [Google Scholar]
- Barres B.A. 2008. The mystery and magic of glia: a perspective on their roles in health and disease. Neuron. 60:430–440 10.1016/j.neuron.2008.10.013 [DOI] [PubMed] [Google Scholar]
- Bushong E.A., Martone M.E., Jones Y.Z., Ellisman M.H. 2002. Protoplasmic astrocytes in CA1 stratum radiatum occupy separate anatomical domains. J. Neurosci. 22:183–192 [DOI] [PMC free article] [PubMed] [Google Scholar]
- Clapham D.E. 2007. Calcium signaling. Cell. 131:1047–1058 10.1016/j.cell.2007.11.028 [DOI] [PubMed] [Google Scholar]
- Di Castro M.A., Chuquet J., Liaudet N., Bhaukaurally K., Santello M., Bouvier D., Tiret P., Volterra A. 2011. Local Ca2+ detection and modulation of synaptic release by astrocytes. Nat. Neurosci. 14:1276–1284 10.1038/nn.2929 [DOI] [PubMed] [Google Scholar]
- Eroglu C., Barres B.A. 2010. Regulation of synaptic connectivity by glia. Nature. 468:223–231 10.1038/nature09612 [DOI] [PMC free article] [PubMed] [Google Scholar]
- Foo L.C., Allen N.J., Bushong E.A., Ventura P.B., Chung W.S., Zhou L., Cahoy J.D., Daneman R., Zong H., Ellisman M.H., Barres B.A. 2011. Development of a method for the purification and culture of rodent astrocytes. Neuron. 71:799–811 10.1016/j.neuron.2011.07.022 [DOI] [PMC free article] [PubMed] [Google Scholar]
- Halassa M.M., Haydon P.G. 2010. Integrated brain circuits: astrocytic networks modulate neuronal activity and behavior. Annu. Rev. Physiol. 72:335–355 10.1146/annurev-physiol-021909-135843 [DOI] [PMC free article] [PubMed] [Google Scholar]
- Hamilton N.B., Attwell D. 2010. Do astrocytes really exocytose neurotransmitters? Nat. Rev. Neurosci. 11:227–238 10.1038/nrn2803 [DOI] [PubMed] [Google Scholar]
- Haugland R.P., Johnson I.D. 1999. Intracellular ion indicators. Fluorescent and Luminescent Probes for Biological Activity: A Practical Guide to Technology for Quantitative Real-Time Analysis. Second edition Mason W.T., editor Academic Press, Waltham, MA: 40–50 [Google Scholar]
- Haydon P.G. 2001. GLIA: listening and talking to the synapse. Nat. Rev. Neurosci. 2:185–193 10.1038/35058528 [DOI] [PubMed] [Google Scholar]
- Helmchen F., Tank D.W. 2000. A single compartment model of calcium dynamics in nerve terminals and dendrites. Imaging Neurons: A Laboratory Manual. Yuste R., Lanni F., Konnerth A., Cold Spring Harbor Laboratory Press, Cold Spring Harbor, NY: 33.1–33.11 [DOI] [PubMed] [Google Scholar]
- Kang J., Nedergaard M. 2000. Calcium imaging of identified astrocytes in hippocampal astrocytes. Imaging Neurons: A Laboratory Manual. Yuste R., Lanni F., Konnerth A., Cold Spring Harbor Laboratory Press, Cold Spring Harbor, NY: 42.1–42.11 [Google Scholar]
- Karperien A.2012. FracLac for ImageJ, Version 2.5w. Available at: http://rsb.info.nih.gov/ij/plugins/fraclac/fraclac-manual.pdf (accessed March 27, 2013) [DOI] [PubMed]
- Kofuji P., Newman E.A. 2004. Potassium buffering in the central nervous system. Neuroscience. 129:1045–1056 10.1016/j.neuroscience.2004.06.008 [DOI] [PMC free article] [PubMed] [Google Scholar]
- Nedergaard M., Verkhratsky A. 2012. Artifact versus reality—how astrocytes contribute to synaptic events. Glia. 60:1013–1023 10.1002/glia.22288 [DOI] [PMC free article] [PubMed] [Google Scholar]
- Nedergaard M., Rodríguez J.J., Verkhratsky A. 2010. Glial calcium and diseases of the nervous system. Cell Calcium. 47:140–149 10.1016/j.ceca.2009.11.010 [DOI] [PubMed] [Google Scholar]
- Neher E. 2000. Some quantitative aspects of calcium fluorimetry. Imaging Neurons: A Laboratory Manual. Yuste R., Lanni F., Konnerth A., Cold Spring Harbor Laboratory Press, Cold Spring Harbor, NY: 31.1–31.11 [Google Scholar]
- Nett W.J., Oloff S.H., McCarthy K.D. 2002. Hippocampal astrocytes in situ exhibit calcium oscillations that occur independent of neuronal activity. J. Neurophysiol. 87:528–537 [DOI] [PubMed] [Google Scholar]
- Oberheim N.A., Goldman S.A., Nedergaard M. 2012. Heterogeneity of astrocytic form and function. Methods Mol. Biol. 814:23–45 10.1007/978-1-61779-452-0_3 [DOI] [PMC free article] [PubMed] [Google Scholar]
- Ortinski P.I., Dong J., Mungenast A., Yue C., Takano H., Watson D.J., Haydon P.G., Coulter D.A. 2010. Selective induction of astrocytic gliosis generates deficits in neuronal inhibition. Nat. Neurosci. 13:584–591 10.1038/nn.2535 [DOI] [PMC free article] [PubMed] [Google Scholar]
- Panatier A., Vallée J., Haber M., Murai K.K., Lacaille J.C., Robitaille R. 2011. Astrocytes are endogenous regulators of basal transmission at central synapses. Cell. 146:785–798 10.1016/j.cell.2011.07.022 [DOI] [PubMed] [Google Scholar]
- Rand M.N., Leinders-Zufall T., Agulian S., Kocsis J.D. 1994. Calcium signals in neurons. Nature. 371:291–292 10.1038/371291b0 [DOI] [PubMed] [Google Scholar]
- Reeves A.M., Shigetomi E., Khakh B.S. 2011. Bulk loading of calcium indicator dyes to study astrocyte physiology: key limitations and improvements using morphological maps. J. Neurosci. 31:9353–9358 10.1523/JNEUROSCI.0127-11.2011 [DOI] [PMC free article] [PubMed] [Google Scholar]
- Russell J.T. 2011. Imaging calcium signals in vivo: a powerful tool in physiology and pharmacology. Br. J. Pharmacol. 163:1605–1625 10.1111/j.1476-5381.2010.00988.x [DOI] [PMC free article] [PubMed] [Google Scholar]
- Schindelin J., Arganda-Carreras I., Frise E., Kaynig V., Longair M., Pietzsch T., Preibisch S., Rueden C., Saalfeld S., Schmid B., et al. 2012. Fiji: an open-source platform for biological-image analysis. Nat. Methods. 9:676–682 10.1038/nmeth.2019 [DOI] [PMC free article] [PubMed] [Google Scholar]
- Shigetomi E., Bowser D.N., Sofroniew M.V., Khakh B.S. 2008. Two forms of astrocyte calcium excitability have distinct effects on NMDA receptor-mediated slow inward currents in pyramidal neurons. J. Neurosci. 28:6659–6663 10.1523/JNEUROSCI.1717-08.2008 [DOI] [PMC free article] [PubMed] [Google Scholar]
- Shigetomi E., Kracun S., Khakh B.S. 2010a. Monitoring astrocyte calcium microdomains with improved membrane targeted GCaMP reporters. Neuron Glia Biol. 6:183–191 10.1017/S1740925X10000219 [DOI] [PMC free article] [PubMed] [Google Scholar]
- Shigetomi E., Kracun S., Sofroniew M.V., Khakh B.S. 2010b. A genetically targeted optical sensor to monitor calcium signals in astrocyte processes. Nat. Neurosci. 13:759–766 10.1038/nn.2557 [DOI] [PMC free article] [PubMed] [Google Scholar]
- Shigetomi E., Tong X., Kwan K.Y., Corey D.P., Khakh B.S. 2012. TRPA1 channels regulate astrocyte resting calcium and inhibitory synapse efficacy through GAT-3. Nat. Neurosci. 15:70–80 10.1038/nn.3000 [DOI] [PMC free article] [PubMed] [Google Scholar]
- Sun W., McConnell E., Pare J.F., Xu Q., Chen M., Peng W., Lovatt D., Han X., Smith Y., Nedergaard M. 2013. Glutamate-dependent neuroglial calcium signaling differs between young and adult brain. Science. 339:197–200 10.1126/science.1226740 [DOI] [PMC free article] [PubMed] [Google Scholar]
- Thévenaz P., Ruttimann U.E., Unser M. 1998. A pyramid approach to subpixel registration based on intensity. IEEE Trans. Image Process. 7:27–41 10.1109/83.650848 [DOI] [PubMed] [Google Scholar]
- Tian L., Hires S.A., Mao T., Huber D., Chiappe M.E., Chalasani S.H., Petreanu L., Akerboom J., McKinney S.A., Schreiter E.R., et al. 2009. Imaging neural activity in worms, flies and mice with improved GCaMP calcium indicators. Nat. Methods. 6:875–881 10.1038/nmeth.1398 [DOI] [PMC free article] [PubMed] [Google Scholar]
- Tong X., Shigetomi E., Looger L.L., Khakh B.S. 2012. Genetically encoded calcium indicators and astrocyte calcium microdomains. Neuroscientist. In press [DOI] [PubMed] [Google Scholar]
- Ventura R., Harris K.M. 1999. Three-dimensional relationships between hippocampal synapses and astrocytes. J. Neurosci. 19:6897–6906 [DOI] [PMC free article] [PubMed] [Google Scholar]
- Xie Y., Wang T., Sun G.Y., Ding S. 2010. Specific disruption of astrocytic Ca2+ signaling pathway in vivo by adeno-associated viral transduction. Neuroscience. 170:992–1003 10.1016/j.neuroscience.2010.08.034 [DOI] [PMC free article] [PubMed] [Google Scholar]
- Zariwala H.A., Borghuis B.G., Hoogland T.M., Madisen L., Tian L., De Zeeuw C.I., Zeng H., Looger L.L., Svoboda K., Chen T.W. 2012. A Cre-dependent GCaMP3 reporter mouse for neuronal imaging in vivo. J. Neurosci. 32:3131–3141 10.1523/JNEUROSCI.4469-11.2012 [DOI] [PMC free article] [PubMed] [Google Scholar]
- Zhang Y., Barres B.A. 2010. Astrocyte heterogeneity: an underappreciated topic in neurobiology. Curr. Opin. Neurobiol. 20:588–594 10.1016/j.conb.2010.06.005 [DOI] [PubMed] [Google Scholar]
- Zhao Y., Araki S., Wu J., Teramoto T., Chang Y.F., Nakano M., Abdelfattah A.S., Fujiwara M., Ishihara T., Nagai T., Campbell R.E. 2011. An expanded palette of genetically encoded Ca2+ indicators. Science. 333:1888–1891 10.1126/science.1208592 [DOI] [PMC free article] [PubMed] [Google Scholar]
Associated Data
This section collects any data citations, data availability statements, or supplementary materials included in this article.


