Abstract
The clinical significance of cytogenetic abnormalities (CA) present in randomly sampled (RS) or focal lesion (FL) bone marrow sites was examined in 419 untreated myeloma patients. Among 290 patients with gene expression profiling (GEP) data generated from RS sites, GEP-defined high-risk was present in 52% of the RS+/FL+ group but in only 9% of the remainder (p<0.001). The RS+/FL+ constellation (18%) was an independent predictor of poor survival, also after adjusting for GEP-derived risk and TP53 status (HR=2.42, p=0.004). The prevalence of high-risk myeloma in the RS+/FL+ group may reflect a dissemination-prone condition not shared by the other 3 groups.
Keywords: myeloma, cytogenetic abnormalities, focal lesions, prognosis
Introduction
The presence of osteolytic lesions distinguishes multiple myeloma (MM) from its precursor condition, monoclonal gammopathy of undetermined significance (MGUS), and is the cause of major morbidity (Kyle, et al 2007). Long recognized as a prognostic variable in the original clinical staging system named after Durie and Salmon (Durie and Salmon 1975), bone destruction has since been recognized not only as a consequence of MM, but also as an active participant in its propagation and component of failure to therapeutic interventions (Yaccoby, et al 2002). We and others have demonstrated that magnetic resonance imaging (MRI) is useful for the early detection of intramedullary focal lesion (FL) growth long before the development of X-ray-detectable bone destruction (Walker, et al 2007). In these investigations, we observed, in confirmation of the Durie-Salmon staging system, that the number of MRI-defined FL adversely affected survival, second only to the presence of metaphase cytogenetic abnormalities (CA). The hypothesis that the sites of FL growth in MM harbored particularly aggressive disease had motivated our efforts over the years to obtain, from consenting subjects, fine needle aspirates (FNA) from MRI-FL under CT guidance, specifically for the purpose of CA analysis.
Patients and Methods
The details of Total Therapy (TT) protocols, approved by the UAMS Institutional Review Board, and outcome results have been reported previously (Barlogie, et al 1997; Barlogie, et al 2006; Barlogie, et al 2007). All participating patients had signed a written informed consent acknowledging the investigative nature of these studies and awareness of alternative treatment options, in keeping with institutional, federal and Helsinki Declaration guidelines. Among 1379 patients successively enrolled in and treated on TT protocols (TT1, n=231; TT2, n=668; TT3, n=480), cytogenetic information prior to transplant was available on RS in 1357; additional information on FL sites was available for 419 of the 1357 patients.
For the purpose of cytogenetic examination, an effort was made to examine at least 20 metaphases, applying Giemsa banding techniques. The presence of CA required the detection of at least 2 abnormal metaphases in cases of hyperdiploidy and translocations, whereas at least 3 metaphases with clonal abnormalities were required in cases of whole and partial chromosome deletions. Gene expression profiling (GEP) data from RS were available from 290 patients prior to therapy. GEP analysis was performed after CD138 purification; both laboratory processing and data analyses have been previously reported regarding a molecular classification (Zhan, et al 2006), 70-gene risk stratification (Shaughnessy, et al 2007) and TP53 deletion (Xiong, et al 2008).
All patients underwent repeated laboratory and imaging examinations as specified in the protocols and in keeping with good medical practice. Definitions of clinical endpoints of response (complete response, CR; near-complete response, n-CR), response duration, event-free survival (EFS) and overall survival (OS) have been previously reported and were similar to recently agreed upon conventions (Durie, et al 2006).
The Kaplan-Meier method was used to estimate EFS and OS. EFS was defined from date of registration to the occurrence of death from any cause, disease progression, or relapse, or was censored at the date of last contact. OS was defined from date of registration to the date of death from any cause or censored at the date of last contact. Duration of complete response was defined from the earliest date of complete response to the date of death from any cause, disease progression or relapse, or censored at the date of last contact. The Cox regression method was used to examine multivariate prognostic factor models for OS and EFS (Cox 1972).
Results and Discussion
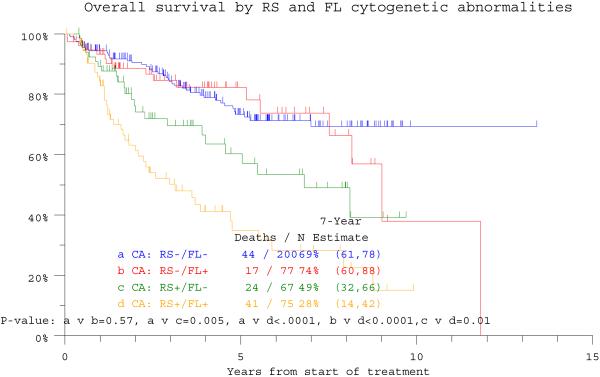
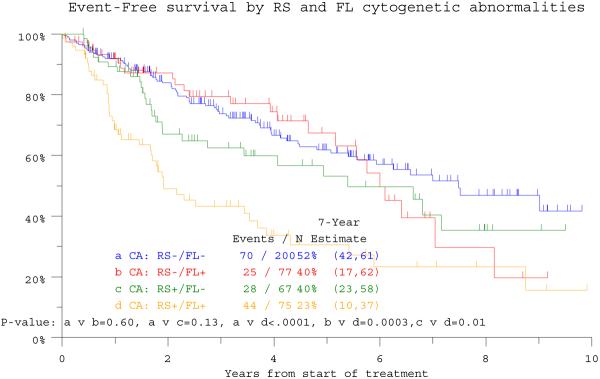
The overall incidence of CA in RS (RS+) among 1357 patients with CA data was 37%, similar to the 34% detected in RS of 419 patients with concurrent RS and FL examinations. Among the latter, CA was absent from both RS and FL (RS−/FL−) in 48%, present in both sites (RS+/FL+) in 18%, only in RS (RS+/FL−) in 16%, and only in FL (RS−/FL+) in 18%. Seven-year estimates of OS and EFS were lowest at 28% and 23%, respectively, among the 75 patients designated as RS+/FL+ (Figure 1a, b). The remainder had comparable EFS, whereas OS was inferior in the 67 subjects with RS+/FL− in comparison with the 277 with RS−/FL− (n=200) or RS−/FL+ (n=77). In the RS+/FL+ category, discordance in CA (unique structural or numerical aberrations in only one of the two sites) was observed in 48 patients whose survival outcomes were similar to those of 27 patients with CA concordance in both sites (p=0.83, data not shown). In case of CA discordance, the presence of greater CA complexity, in RS or FL, likewise did not influence outcome.
Figure 1a.

Overall survival is depicted in relationship to the presence of cytogenetic abnormalities (CA) in either randomly sampled (RS) bone marrow or focal lesion (FL) sites recognized on magnetic resonance imaging (MRI) examination. The worst outcome was observed in the 75 patients exhibiting CA in both RS and FL sites (RS+/FL+), whereas the two cohorts with RS- with FL (RS−/FL+) or without FL (RS−/FL−) enjoyed superior survival; those with RS+/FL− had an intermediate prognosis.
Figure 1b.

Event-free survival is depicted in relationship to the presence of cytogenetic abnormalities (CA) in either randomly sampled (RS) bone marrow or focal lesion (FL) sites recognized on magnetic resonance imaging (MRI) examination. The worst outcome was observed in the 75 patients exhibiting CA in both RS and FL sites (RS+/FL+), whereas the other 3 cohorts with RS−/FL+, RS−/FL− and RS+/FL− had comparable outcomes.
We next examined the relative distributions of baseline prognostic variables among the 4 groups, relative to findings in all 1357 patients. There were no significant differences in the proportions of patients with certain age, C-reactive protein (CRP) and creatinine cut-off values of recognized prognostic importance. The 75 patients with RS+/FL+ exhibited higher frequencies of elevated levels of lactate dehydrogenase (LDH, >= 190U/L) (p<0.0001), whereas the 159 with RS+ status regardless of FL+ status had higher frequencies of elevated B2M and lower hemoglobin compared to those with RS-with or without FL+ (p=0.007 and p=0.002, respectively) (data not shown).
Examination of GEP data, derived from RS sites in 290 patients, revealed that the proportion of patients with high GEP-defined risk scores (>0.66) decreased from a high of 52% among the 54 subjects with RS+/FL+ to 27% in the 49 patients with RS+/FL−(p=0.009) to 6% and 4% (p<0.001) among the 50 patients with RS−/FL+ and the 130 patients with RS−/FL− status (p =0.65). Relevant to molecular subgroup distribution (Zhan, et al 2006), no significant differences were observed in RS/FL constellations among MF (MAF/MAFB), MS (MMSET/FGFR3), CD-1 (CCND1 without CD20 expression) and LB (low bone disease) subtypes; however, RS+/FL+ was uniquely over-represented in the PR (Proliferation) group (p<0.0001) (data not shown).
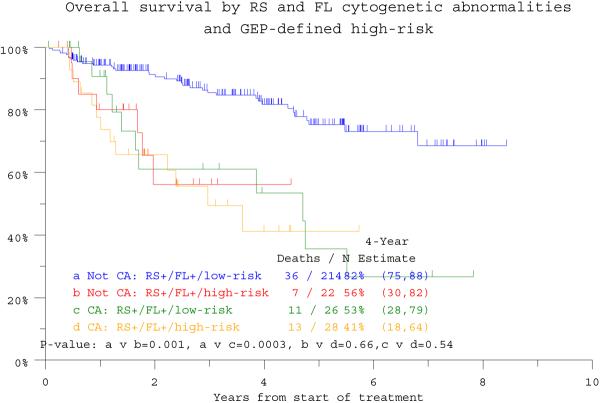
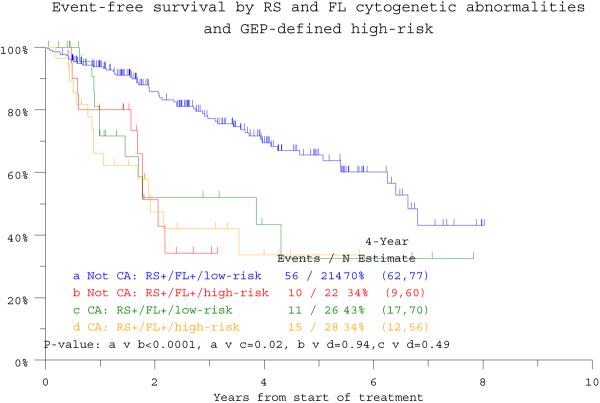
Univariate analysis confirmed the prognostic implications of many well recognized standard and also GEP-derived parameters such as high-risk designation, PR subgroup and TP53 deletion (Table 1). Multivariate analyses, exclusive of GEP data, revealed that RS+/FL+ status imparted inferior OS (HR = 3.52; p < 0.001) and EFS (HR = 2.36; p = <0.001) (see Table 1). This significance was upheld in the context of GEP data available in 284 patients for OS (HR=2.43, p=0.004). Among the 236 patients lacking RS+/FL+, high-risk status segregated 22 patients with markedly inferior clinical outcomes resembling those of the 54 patients with RS+/FL+ whose poor OS and EFS were not affected by GEP risk designation (Figure 1c, d). GEP-derived TP53 deletion status affected both endpoints adversely (OS: HR=2.02, p=0.013; EFS 1.84, p=0.017), whilst GEP-defined high risk and low hemoglobin level were significantly associated with EFS (see Table 1).
Table 1.
Univariate and multivariate analyses of overall survival and event-free survival according to baseline laboratory features without and with gene expression profiling (GEP)-based high-risk information:
| Overall Survival | Event-Free Survival | ||||||
|---|---|---|---|---|---|---|---|
| Variable | n/N (%) | HR (95% CI) | P-value | n/N (%) | HR (95% CI) | P-value | |
| Univariate Analysis | Age >= 65 yr | 98/419 (23%) | 1.18 (0.78, 1.78) | 0.438 | 98/419 (23%) | 1.13 (0.79, 1.63) | 0.496 |
| Albumin < 3.5 g/dL | 95/419 (23%) | 1.92 (1.30, 2.83) | 0.001 | 95/419 (23%) | 1.59 (1.12, 2.28) | 0.011 | |
| B2M >= 3.5 mg/L | 158/417 (38%) | 1.71 (1.20, 2.44) | 0.003 | 158/417 (38%) | 1.46 (1.07, 2.00) | 0.016 | |
| B2M > 5.5 mg/L | 79/417 (19%) | 1.86 (1.22, 2.82) | 0.004 | 79/417 (19%) | 1.55 (1.06, 2.27) | 0.023 | |
| CRP >= 8.0 mg/L | 180/413 (44%) | 1.43 (1.00, 2.04) | 0.048 | 180/413 (44%) | 1.25 (0.92, 1.69) | 0.160 | |
| Hb<10 g/dL | 81/418 (19%) | 1.62 (1.08, 2.44) | 0.020 | 81/418 (19%) | 1.79 (1.25, 2.56) | 0.001 | |
| Creatinine >= 2.0 mg/dL | 26/413 (6%) | 1.53 (0.82, 2.83) | 0.181 | 26/413 (6%) | 1.30 (0.74, 2.28) | 0.368 | |
| LDH >= 190 U/L | 128/418 (31%) | 1.45 (1.01, 2.09) | 0.045 | 128/418 (31%) | 1.25 (0.90, 1.72) | 0.181 | |
| GEP high-risk | 50/290 (17%) | 3.35 (1.95, 5.76) | <.001 | 50/290 (17%) | 3.10 (1.93, 4.98) | <.001 | |
| TP53 deletion | 118/290 (41%) | 2.24 (1.30, 3.87) | 0.004 | 118/290 (41%) | 2.00 (1.22, 3.28) | 0.006 | |
| GEP PR subgroup | 44/290 (15%) | 2.31 (1.31, 4.07) | 0.004 | 44/290 (15%) | 1.82 (1.08, 3.05) | 0.023 | |
| CA: RS+/FL − | 67/419 (16%) | 1.36 (0.87, 2.12) | 0.177 | 67/419 (16%) | 1.10 (0.73, 1.65) | 0.654 | |
| CA: RS−/FL+ | 77/419 (18%) | 0.72 (0.43, 1.20) | 0.211 | 77/419 (18%) | 0.83 (0.54, 1.28) | 0.400 | |
| CA: RS+/FL+ | 75/419 (18%) | 3.19 (2.19, 4.65) | <0.001, | 75/419 (18%) | 2.46 (1.74, 3.48) | <0.001 | |
| Variable | n/N (%) | HR (95% CI) | P-value | n/N (%) | HR (95% CI) | P-value | |
|---|---|---|---|---|---|---|---|
| Multivariate Analysis without GEP data | CA: RS+/FL+ | 75/410 (18%) | 3.52 (2.35, 5.27) | <.001 | 75/416 (18%) | 2.36 (1.67, 3.34) | <.001 |
| CA: RS+/FL − | 65/410 (16%) | 1.81 (1.12, 2.94) | 0.016 | NS | NS | NS | |
| Albumin < 3.5 g/dL | 91/410 (22%) | 1.67 (1.12, 2.48) | 0.011 | NS | NS | NS | |
| Hb<10g/dL | 80/410 (20%) | NS | NS | 81/416 (19%) | 1.70 (1.19, 2.43) | 0.004 | |
| Multivariate Analysis with GEP data | +RS/+FNACA | 54/284 (19%) | 2.43 (1.32, 4.47) | 0.004 | 54/288 (19%) | 1.56 (0.90, 2.71) | 0.112 |
| TP53 deletion | 112/284 (39%) | 2.02 (1.16, 3.52) | 0.013 | 116/288 (40%) | 1.84 (1.12, 3.03) | 0.017 | |
| GEP high-risk | 47/284 (17%) | 1.81 (0.94, 3.52) | 0.078 | 50/288 (17%) | 2.01 (1.12, 3.61) | 0.020 | |
| Hb<10g/dL | 62/284 (22%) | NS | NS | 63/288 (22%) | 1.69 (1.07, 2.69) | 0.025 |
HR- Hazard Ratio, 95% CI- 95% Confidence Interval, P-value from Wald Chi-Square Test in Cox Regression
NS- Multivariate results not statistically significant at 0.05 level. All univariate p-values reported regardless of significance.
Multivariate model uses stepwise selection with entry level 0.1 and variable remains if meets the 0.05 level.
A multivariate p-value greater than 0.05 indicates variable forced into model with significant variables chosen using stepwise selection.
Abbreviations: GEP, gene expression profiling; CA, cytogenetic abnormalities; RS, randomly sampled bone marrow; FL, focal lesion sample; CA: RS+/FL−, CA in RS but not in FL; CA: RS−/FL+, CA in FL but not in RS; CA: RS+/FL+. CA in both RS and FL
Figure 1c.
Overall survival of patients according to gene expression profiling (GEP) defined risk and the presence or absence of CA in both random sites and focal lesion sites (RS+/FL+). High-risk designation only lowers survival expectations in 22 among 236 patients lacking RS+/FL+ (“Not RS+/FL+”).
Figure 1d.
Event-free survival of patients according to gene expression profiling (GEP)-defined risk and the presence or absence of CA in both random sites and focal lesion sites (RS+/FL+). High-risk designation only lowers event-free survival expectations in 22 among the 236 patients lacking RS+/FL+ (“Not RS+/FL+”).
The novel finding of our work relates to the discovery that the adverse prognostic consequences of CA requires the detection of CA at both RS and FL sites, a circumstance linked in turn to a predominance of high-risk and PR GEP designations in RS sites. The unexpected favorable outcomes of patients with CA present solely in FL may be explained by better adhesion of DKK1-secreting FL-resident MM cells, resulting in impaired proliferation and dissemination potentials (Tian, et al 2003). By way of a cell adhesion-mediated drug resistance mechanism, such FL-MM cells respond less favorably and more slowly to systemic therapy, explaining the striking time delay of 1 to 2 years observed in FL resolution compared to MM protein response (Walker, et al 2007). Persistence of FL in complete remission is consistent with a tumor dormancy state from which late relapses can ensue. Given the difference in MM biology in FL and RS sites, presumably with a more diffuse rather than focal growth pattern in the latter, work is in progress to investigate the intra- and inter-tumor heterogeneity in molecular signatures of both MM cells and adjacent stroma at RS and FL sites.
Figure 1.
Kaplan-Meier survival plots of patients according to the presence of cytogenetic abnormalities detected in randomly sampled bone marrow sites or by computer-assisted tomography-guided fine needle aspiration from MRI-defined focal lesions:
Acknowledgments
Supported: Program Project grant (CA 55819) from the National Cancer Institute, Bethesda, MD.
Footnotes
Disclosures: Research support (JDS, EA, FvR, BB) from Celgene, Millennium and Novartis corporations
Honoraria for speaking engagements (JDS, EA, FvR, BB)
Royalties from Novartis (JDS, BB)
References
- Barlogie B, Anaissie E, van Rhee F, Haessler J, Hollmig K, Pineda-Roman M, Cottler-Fox M, Mohiuddin A, Alsayed Y, Tricot G, Bolejack V, Zangari M, Epstein J, Petty N, Steward D, Jenkins B, Gurley J, Sullivan E, Crowley J, Shaughnessy JD., Jr. Incorporating bortezomib into upfront treatment for multiple myeloma: early results of total therapy 3. British Journal of Haematology. 2007;138:176–185. doi: 10.1111/j.1365-2141.2007.06639.x. [DOI] [PubMed] [Google Scholar]
- Barlogie B, Jagannath S, Vesole DH, Naucke S, Cheson B, Mattox S, Bracy D, Salmon S, Jacobson J, Crowley J, Tricot G. Superiority of tandem autologous transplantation over standard therapy for previously untreated multiple myeloma. Blood. 1997;89:789–793. [PubMed] [Google Scholar]
- Barlogie B, Tricot G, Anaissie E, Shaughnessy J, Rasmussen E, van Rhee F, Fassas A, Zangari M, Hollmig K, Pineda-Roman M, Lee C, Talamo G, Thertulien R, Kiwan E, Krishna S, Fox M, Crowley J. Thalidomide and hematopoietic-cell transplantation for multiple myeloma. New England Journal of Medicine. 2006;354:1021–1030. doi: 10.1056/NEJMoa053583. [DOI] [PubMed] [Google Scholar]
- Cox DR. Regression Models and Life-Tables. Journal of the Royal Statistical Society B. 1972;34:187–220. [Google Scholar]
- Durie BG, Harousseau JL, Miguel JS, Blade J, Barlogie B, Anderson K, Gertz M, Dimopoulos M, Westin J, Sonneveld P, Ludwig H, Gahrton G, Beksac M, Crowley J, Belch A, Boccadaro M, Cavo M, Turesson I, Joshua D, Vesole D, Kyle R, Alexanian R, Tricot G, Attal M, Merlini G, Powles R, Richardson P, Shimizu K, Tosi P, Morgan G, Rajkumar SV. International uniform response criteria for multiple myeloma. Leukemia. 2006;20:1467–1473. doi: 10.1038/sj.leu.2404284. [DOI] [PubMed] [Google Scholar]
- Durie BG, Salmon SE. A clinical staging system for multiple myeloma. Correlation of measured myeloma cell mass with presenting clinical features, response to treatment, and survival. Cancer. 1975;36:842–854. doi: 10.1002/1097-0142(197509)36:3<842::aid-cncr2820360303>3.0.co;2-u. [DOI] [PubMed] [Google Scholar]
- Kaplan EL, Meier P. Nonparametric estimation from incomplete observations. Journal of the American Statistical Association. 1958;53:457–481. [Google Scholar]
- Kyle RA, Remstein ED, Therneau TM, Dispenzieri A, Kurtin PJ, Hodnefield JM, Larson DR, Plevak MF, Jelinek DF, Fonseca R, Melton LJ, 3rd, Rajkumar SV. Clinical course and prognosis of smoldering (asymptomatic) multiple myeloma. New England Journal of Medicine. 2007;356:2582–2590. doi: 10.1056/NEJMoa070389. [DOI] [PubMed] [Google Scholar]
- Shaughnessy JD, Jr., Zhan F, Burington BE, Huang Y, Colla S, Hanamura I, Stewart JP, Kordsmeier B, Randolph C, Williams DR, Xiao Y, Xu H, Epstein J, Anaissie E, Krishna SG, Cottler-Fox M, Hollmig K, Mohiuddin A, Pineda-Roman M, Tricot G, van Rhee F, Sawyer J, Alsayed Y, Walker R, Zangari M, Crowley J, Barlogie B. A validated gene expression model of high-risk multiple myeloma is defined by deregulated expression of genes mapping to chromosome 1. Blood. 2007;109:2276–2284. doi: 10.1182/blood-2006-07-038430. [DOI] [PubMed] [Google Scholar]
- Tian E, Zhan F, Walker R, Rasmussen E, Ma Y, Barlogie B, Shaughnessy JD., Jr. The role of the Wnt-signaling antagonist DKK1 in the development of osteolytic lesions in multiple myeloma. New England Journal of Medicine. 2003;349:2483–2494. doi: 10.1056/NEJMoa030847. [DOI] [PubMed] [Google Scholar]
- Tusher VG, Tibshirani R, Chu G. Significance analysis of microarrays applied to the ionizing radiation response. Proceedings of the National Academy of Sciences U S A. 2001;98:5116–5121. doi: 10.1073/pnas.091062498. [DOI] [PMC free article] [PubMed] [Google Scholar]
- Venables WN, Ripley BD. Modern applied statistics with S. Springer; New York, NY: 2002. [Google Scholar]
- Walker R, Barlogie B, Haessler J, Tricot G, Anaissie E, Shaughnessy JD, Jr., Epstein J, van Hemert R, Erdem E, Hoering A, Crowley J, Ferris E, Hollmig K, van Rhee F, Zangari M, Pineda-Roman M, Mohiuddin A, Yaccoby S, Sawyer J, Angtuaco EJ. Magnetic resonance imaging in multiple myeloma: diagnostic and clinical implications. Journal of Clinical Oncology. 2007;25:1121–1128. doi: 10.1200/JCO.2006.08.5803. [DOI] [PubMed] [Google Scholar]
- Xiong W, Shaughnessy JD, Jr, Starnes S, Johnson S, Huang Y, Barlogie B, Zhan F. An anaylsis of the clinical and biological significance of TP53 loss in multiple myeloma. Blood. 2008;112:4235–4246. doi: 10.1182/blood-2007-10-119123. [DOI] [PMC free article] [PubMed] [Google Scholar]
- Yaccoby S, Pearse RN, Johnson CL, Barlogie B, Choi Y, Epstein J. Myeloma interacts with the bone marrow microenvironment to induce osteoclastogenesis and is dependent on osteoclast activity. British Journal of Haematology. 2002;116:278–290. doi: 10.1046/j.1365-2141.2002.03257.x. [DOI] [PubMed] [Google Scholar]
- Zhan F, Huang Y, Colla S, Stewart JP, Hanamura I, Gupta S, Epstein J, Yaccoby S, Sawyer J, Burington B, Anaissie E, Hollmig K, Pineda-Roman M, Tricot G, van Rhee F, Walker R, Zangari M, Crowley J, Barlogie B, Shaughnessy JD., Jr. The molecular classification of multiple myeloma. Blood. 2006;108:2020–2028. doi: 10.1182/blood-2005-11-013458. [DOI] [PMC free article] [PubMed] [Google Scholar]


