Abstract
Considerable evidence suggests that the Homer family of scaffolding proteins contributes to synaptic organization and function. We investigated the role of both Homer 1b, the constitutively-expressed and developmentally-regulated form of Homer, and Homer1a, the activity-induced immediate early gene, in dendritic arbor elaboration and synaptic function of developing Xenopus optic tectal neurons. We expressed exogenous Homer 1a or Homer 1b in developing Xenopus tectal neurons. By collecting in vivo time lapse images of individual, EGFP-labeled and Homer-expressing neurons over 3 days we found that Homer 1b leads to a significant decrease in dendritic arbor growth rate and arbor size. Synaptic transmission was also altered in developing neurons transfected with Homer 1b. Cells expressing exogenous Homer 1b over three days had a significantly greater AMPA to NMDA ratios, and increased AMPA mEPSC frequency. These data suggest that increasing Homer1b expression increases excitatory synaptic inputs, increases synaptic maturation and slows dendritic arbor growth rate. Exogenous Homer 1a expression increases AMPA mEPSC frequency but did not significantly affect tectal cell dendritic arbor development. Changes in the ratio of Homer1a to Homer1b may signal the neuron that overall activity levels in the cell have changed, and this in turn could affect protein interactions at the synapse, synaptic transmission and structural development of the dendritic arbor.
Keywords: Homer, dendritic morphology, synaptic function, development, Xenopus
Introduction
The formation of neural circuits is essential to the proper integration and transfer of information from one brain region to another and requires development of both appropriate synaptic contacts and neuronal structures, including axons and dendrites. The composition and organization of the synapse influences which trans-synaptic signals are sent and received, how they are processed and subsequently propagated throughout the postsynaptic neuron. The molecular composition and shape of the dendritic arbor are important components that contribute to information reception, processing and propagation. Therefore, dendritic morphology is a key regulator of information integration. The information received and processed by a postsynaptic neuron is shaped by its distribution of synaptic contacts and the properties of the dendritic branches on which they reside. Dendrites and synapses do not simply passively collect information. They receive and dynamically process information, and they are themselves changed by the spatial and temporal properties of inputs through a feedback of synaptic and dendritic rearrangements that are constantly refined. The development of dendritic arbor structure and the establishment of synaptic connections are concurrent and recent evidence suggests a dynamic interaction between the regulation of synapses and dendritic arbor development (Haas and Cline, 2008). Because Homer proteins are emerging as important modulators of synaptic transmission and spine maturation, we wanted to determine whether Homer proteins also play a role in the development of neuronal structure.
The Homer family of scaffolding proteins link several important components of the postsynaptic density, including, but not limited to, metabotropic glutamate receptors (Brakeman et al., 1997), inositol 1,4,5 triphosphate receptors (Tu et al., 1998), TRP channels (Yuan et al., 2003) and the scaffolding protein Shank (Tu et al., 1999), which may affect synaptic function or plasticity. Because some splice forms of the Homer gene are activity-regulated immediate-early gene products, they are uniquely poised to influence synaptic transmission and synapse stability in response to synaptic activity. All Homer 1 proteins share the same N-terminus, while the C-terminus varies among isoforms by activity-dependent alternative splicing (Xiao et al., 1998). The forms of Homer 1 that contain a longer C-terminal with a coiled coil domain, are constitutively expressed (Homer 1b/1c) and the short form of Homer that is lacking the C-terminal domain (Homer 1a) is regulated by activity (Brakeman et al., 1997; Kato et al., 1997, Bottai et al., 2002). Homer proteins that have the longer C-terminal can multimerize by binding through their coiled coil domains. The N-terminal domain of either Homer protein binds to proteins in the postsynaptic density and can cluster (Homer 1b/1c) or disperse (Homer 1a) proteins by the presence or absence of the C-terminal (Xiao et al., 1998, Beneken et al., 2000; Kammermeir and Worley 2007).
Several studies have provided evidence that glutamatergic synaptic strength influences dendritic structure (Rajan and Cline 1998; Rajan et al 1999; Cline 2001; Zhou et al., 2004; Matsuzaki et al., 2004; Chen and Ghosh 2005; Haas et al., 2006). Homer proteins may be involved in developmental plasticity, not only by affecting synaptic transmission, but also by affecting the development of dendritic arbor. Homer proteins have been shown to influence the expression/localization and transmission/signaling of Group I metabotropic glutamate receptors (Ango et al, 2000, 2001; Ciruela et al, 1999, 2000; Tadokoru, et al, 1999, Van Keuren-Jensen and Cline 2006; Kammermeir and Worley 2007). A recent study indicates that Homer1a may regulate glutamate-induced rearrangements of pre- and postsynaptic proteins, including Homer1c and the GluR2 subunit of AMPAR (Inoue et al., 2007). Increased Homer 1b levels, in cooperation with Shank, correlate with increases in cell surface expression of GluR2 subunit containing AMPA receptors and NMDA receptors, as well as, spine size and number (Sala et al., 2001). Depending on the type of neuron, length of expression and activity state of the neuron, Homer 1a has been found to both reduce and increase cell surface expression of AMPA and NMDA receptors, and to reduce and increase the size and number of spines (Hennou et al., 2003; Sala et al., 2003; Van Keuren-Jensen et al., 2006).
Here we test the possibility that the activity-regulated synaptic scaffolding protein, Homer, plays a role in the development of dendritic arbor structure. We explored the effects of Homer expression on the early stages of dendritic arbor growth of developing dendrites in vivo, and in parallel, assessed synaptic development in these cells. We transfected individual neurons with different Homer isoforms to test whether manipulating either Homer 1a to Homer 1b levels could effect early tectal cell development. We previously used this strategy of expressing either Homer1a or Homer1b to shift the Homer 1a to Homer 1b ratio in favor of either Homer1a or Homer1b (Van Keuren-Jensen and Cline, 2006). We found that expression of Homer 1b, but not Homer 1a, significantly affected dendritic arbor morphology and that this effect correlated with a change in synaptic transmission.
Materials and Methods
Xenopus laevis tadpoles
Albino Xenopus laevis tadpoles, stage 47-48, were used for all experiments. Tadpoles were kept on a 12 hour light/dark cycle at 25° C for all experiments unless otherwise stated.
Constructs
Rat Homer1b and Homer1a were a generous gift from Paul Worley and J.C. Tu (Johns Hopkins School of Medicine). Homer cDNAs were expressed from pRK5 plasmids containing a CMV promotor, and coexpressed with Clontech EGFP for imaging single cells. For electrophysiology experiments, the Homer cDNAs were cloned into a bidirectional PCS2 plasmid (BiCS2, containing two CMV promotors, one on each strand), which was a generous gift from Dave Turner (University of Michigan). One multiple cloning site expressed EGFP and the other site expressed either Homer 1b, Homer 1a or was an empty site for control. To verify expression of the Homer 1a and Homer 1b constructs, heterologous cells were transfected and the proteins detected by Western blot (data not shown).
Whole Tectum Electroporation
Tadpole optic tectal cells were electroporated as in Haas et al., 2002. Tadpoles were anesthetized in 0.01% MS-222 (3-aminobenzoic acid ethyl ester, Sigma). A solution containing either EGFP-biCS2-Homer 1b, EGFP-biCS2-Homer 1a, or EGFP-biCS2 (3 μg/μl) and a small amount of fast green, to visualize the DNA solution, was injected into the brain ventricle and a 50 mV current was passed five times in each direction across the brain using custom-built platinum electrodes. Electrophysiology experiments were performed 3 days after electroporation.
Single Cell Electroporation
Single immature tectal cells were electroporated with Clontech EGFP alone or with one of the Homer pRK5 constructs (Haas et al., 2001 and Bestman et al., 2006). When constructs were coelectroporated, the ratio was 1:2, EGFP plasmid: plasmid containing the experimental gene. Voltage pulses between the microelectrode and ground were delivered by a Grass SD9 Stimulator. 200 Hz trains of square pulses of 80-100 volts were typically used.
Imaging and Image Analysis
Images were collected on a custom-built two-photon laser-scanning microscope that was modified from an Olympus Fluoview confocal scan box mounted on an Olympus (Center Valley, PA) BX50WI microscope. The light source was a Tsunami femtosecond-pulsed Ti:sapphire laser pumped by a 10 W solid-state Millenia × laser (both from Newport Spectra, Physics, Mountain View, CA) at 905–910 nm. Images were acquired with the Olympus Fluoview acquisition software and a 40× water-immersion lens. Images were collected at 2 μm steps in the z direction. The three dimensional dendritic arbor of the cells was manually reconstructed from the raw two-photon z-stack series using the drawing program Object Image (http://simon.bio.uva.nl/object-image.html). Custom macros developed by Dr. Edward Ruthazer (McGill University, Montreal, Canada; http://clinelab.cshl.edu/methods.html) were used to determine total dendritic branch length and branch tip numbers, and for the three-dimensional (3D) Sholl analysis (1 μm radius intervals).
Electrophysiology
Tadpole brains were prepared for recordings as described in Wu et al. (1996). The brain was removed and a cut was made along the dorsal midline. The ventricular lining was removed and the tectal cells exposed to extracellular saline containing: 115 mM NaCl, 2 mM KCl, 3 mM CaCl2, 3 mM MgCl2, 5 mM HEPES, 10 mM glucose, 10 mM glycine, 100 mM Picrotoxin, pH 7.2 with NaOH, osmolarity 255. Brains were laid flat and stabilized with a metal harp in a perfusion chamber kept at room temperature. Cells throughout the optic tectum were patched under visual guidance of a Nikon E600FN light microscope with a 60× water immersion objective. Glass microelectrodes (7-10 Mω) were filled with internal solution (90 mM Cs-methane sulfonate, 5 mM MgCl2, 20 mM TEA, 10 mM EGTA, 20mM HEPES, 2mM ATP, 0.3 mM GTP, pH 7.2 with CsOH, osmolarity 255). The input resistance (average 1.5 Gω), series resistance (average 50 Mω) and the holding potential at −60 mV (average −0.03 nA) were similar to that reported previously using this preparation (Wu et al,1996; Cantallops et al, 2000; Aizenman et al, 2002; 2003) and were monitored throughout the experiments. Recordings were made with an Axopatch 2-D amplifier (Axon Instruments) and a Digidata 1200 A-D board. AMPAR-mediated miniature postsynaptic excitatory currents (mEPSCs) were recorded at −60 millivolts (mV) holding potential with 1 μm tetrodotoxin (TTX) (Alamone Labs) in the external saline.. For AMPA/NMDA ratios, cells were patched in whole cell mode and retinal axons were stimulated at the optic chiasm with a bipoar stimulating electrode. 50-100 traces were recorded at −60 mV (AMPA component) and 50 – 100 traces were recorded at +55 mV (AMPA and NMDA component). Paired pulse ratios were recorded at −60 mV with 25 msec between stimuli with 6 sec between trials.
AMPA mEPSCs were analyzed using the template matching program in Axograph 4.6 (Axon Instruments). The template matching criterion was set to a threshold of 3-3.5 (moderately stringent). The program was run in the positive direction first, to detect the amount of noise in a given trace. Only traces that had less than 5% noise events were analyzed (average noise was less than 1%). All mEPSCs detected in the first 1-2 minutes of recording were analyzed. Data collected this way were highly reliable from experiment to experiment. For AMPA/NMDA ratios, evoked AMPAR responses were measured at −60 mV and compared to evoked NMDAR mediated responses measured at +55 mV. The AMPAR response was calculated from the average of 40-50 traces and the amplitude was measured at the peak of the AMPA response. When the peak amplitude of the AMPAR response was recorded, so was the time in milliseconds (msec) at which the peak occurred. The NMDAR current response was then calculated from the average of 40-50 traces at +55 mV by measuring the amplitude of the response in a 2 msec window 25 msec after the peak AMPA response, by which time 75% or more of the AMPA response had decayed. For measurements of paired pulse ratios, the peak amplitudes of the first and second responses were measured from 50-100 averaged traces. The peak amplitude of the second evoked current was divided by the peak amplitude of the first evoked current.
Statistics
Nonparametric statistical tests were used to determine significance in all the experiments. Mann Whitney U (MW) tests were used for all statistical comparisons between two groups. A Kruskal Wallis (KW) test was used for groups of three or more and a Dunn's post test was performed for those with significant differences (InStat, 2001). Kolmogorov Smirnov (KS) was used to compare cumulative frequencies. All graphs are plots of the medians and error bars are interquartile ranges (IQR) unless otherwise stated.
Results
Homer regulates dendritic arbor growth
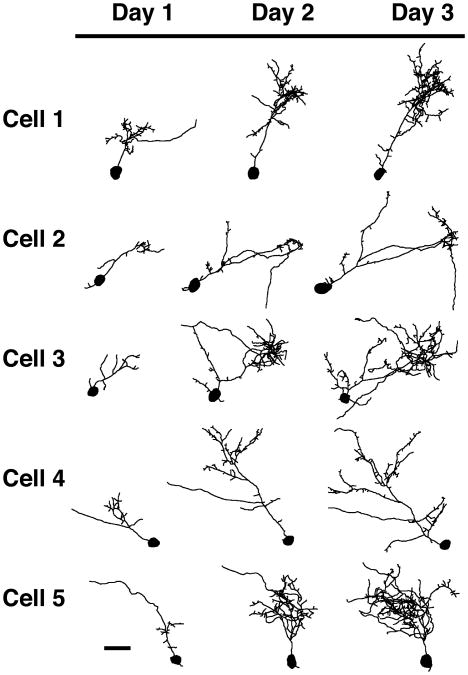
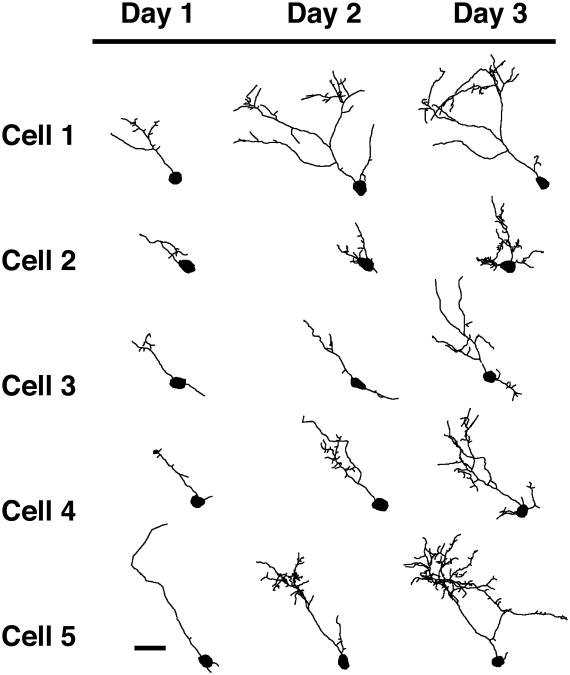
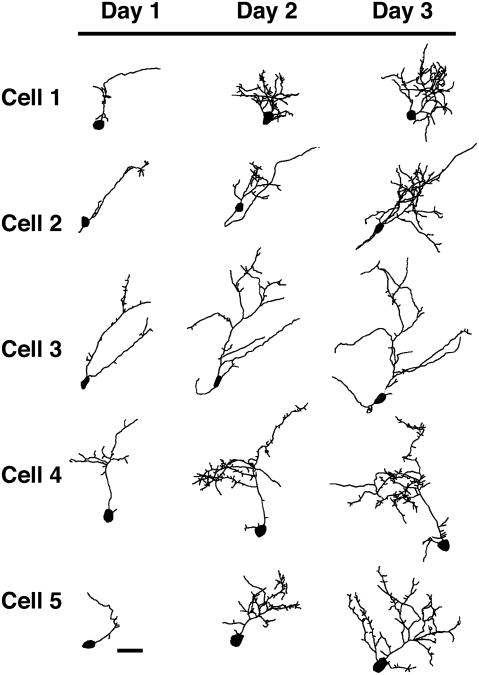
To study the effect of Homer on the early growth of developing cells, we targeted tectal cells that are very small and synaptically immature (Wu et al., 1996). We transfected single immature cells of the optic tectum with either EGFP, Homer 1b, or Homer 1a. Cells chosen for image analysis on the first day after transfection had a very simple dendritic arbor with, on average, less than 400 μm total dendritic branch length (Fig. 1). The cells were imaged for the first time 24 hours after transfection and once each day for a total of three days. Cells expressing EGFP (Fig. 1) are simple on day 1 and grow throughout the three-day imaging period. Most of these cells have a complex arbor with clusters of branches by day 3. Cells transfected with Homer 1b (Fig. 2) are very simple on the first day of imaging, and while they grow on days 2 and 3, they do not grow as fast as control cells expressing EGFP. With exogenous expression of Homer 1a, tectal cells grow and become complex over the three days of imaging (Fig. 3).
Figure 1.
Morphological development of optic tectal neurons expressing EGFP. Drawings of 5 representative cells transfected with EGFP. Cells were imaged in vivo once each day for three days starting 24 hours after electroporation. Scale bar = 25 μm. (n = 16 cells).
Figure 2.
Morphological development of optic tectal neurons expressing Homer1b. Drawings of 5 representative cells transfected with Homer 1b. Cells were imaged in the intact animal once each day for three days starting 24 hours after electroporation. Scale bar = 25 μm. (n = 16 cells).
Figure 3.
Morphological development of optic tectal neurons expressing Homer1a. Drawings of 5 representative cells transfected with Homer 1a. Cells were imaged in vivo once each day for three days starting 24 hours after electroporation. Scale bar = 25 μm. (n = 16 cells).
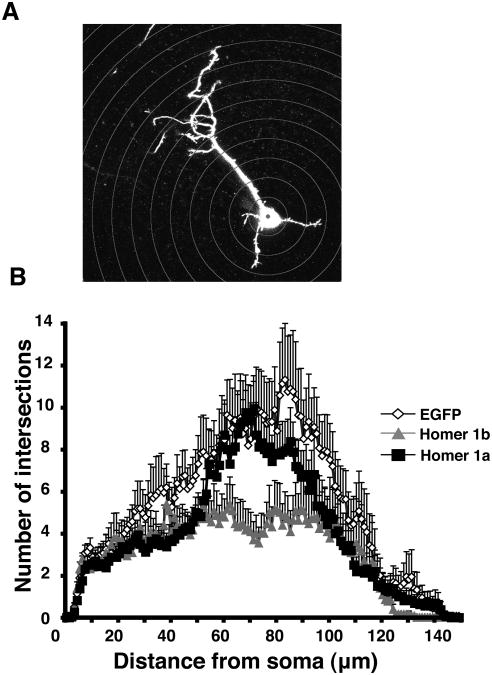
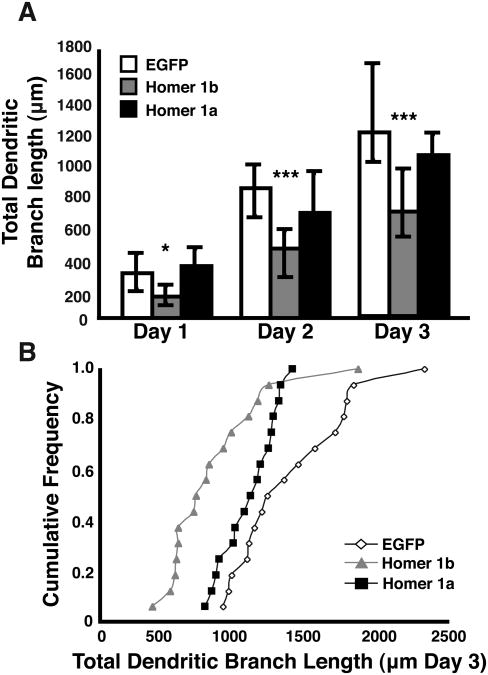
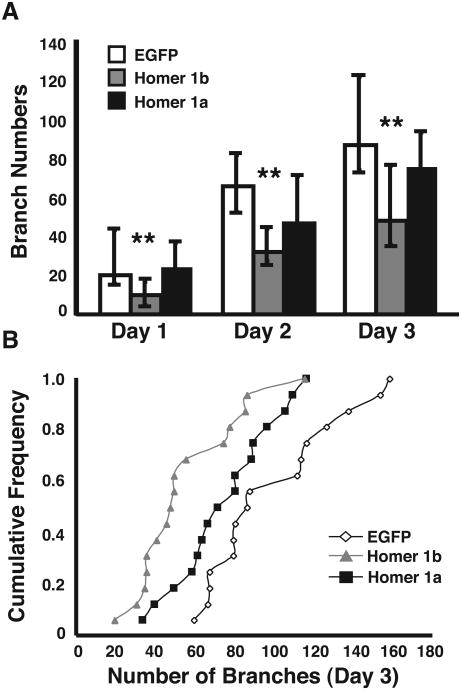
To quantify the daily imaging data for the three conditions, we analyzed 3-dimensional reconstructions of the cells using a Sholl analysis program designed to calculate the complexity of the dendritic arbor. This analysis measures the number of intersections made by the arbor onto a set of concentric spheres that radiate out from the cell body at 1 μm intervals (Fig. 4A). Fig. 4B displays the Sholl analysis for all of the cells analyzed on the third day and averaged together for each group. Cells transfected with Homer 1b do not have the same complexity as cells transfected with Homer 1a or EGFP, nor do they extend as far into the tectal neuropil as controls or Homer 1a-expressing neurons. A further examination of the dendritic arbors reveals that cells expressing exogenous Homer 1b have significantly less total dendritic branch length than cells exogenously expressing Homer 1a or EGFP (Kruskal Wallis p<0.005, post test p<0.0001 for Homer 1b day 3, Fig. 5). Homer 1b transfection significantly decreases the total number of branches (Kruskal Wallis day 3 p<0.005, post test p<0.0001 for Homer 1b, Fig. 6).
Figure 4.
Sholl analysis of cells expressing EGFP, Homer1b, and Homer 1a. (A) The Sholl analysis displays the complexity of the dendritic arbor from the cell soma to the most distal branches by counting the number of intersections the dendrites make with the concentric spheres. (B) Sholl analysis for cells transfected with EGFP, Homer 1b or Homer 1a (n = 16 cells in each condition).
Figure 5.
Total dendritic branch length of cells transfected with EGFP, Homer 1b, or Homer 1a. (A) Medians and IQR are plotted for total dendritic branch length measured for each day of imaging over three days. (IQR = the range of data from the 25th to the 95th percentile of the data distribution) (B) Cumulative frequency plot of the total dendritic branch length for each cell on the third day of imaging. (n = 16 cells in each condition).
Figure 6.
Total number of dendritic branches in cells transfected with EGFP, Homer 1b, or Homer 1a. (A) Medians and IQR are plotted for branch numbers at each day of the 3-day imaging protocol. (B) Cumulative frequency plot of the dendritic branch numbers for each cell on the third day of imaging. (n = 16 cells in each condition).
These data suggest that the balance of Homer proteins (Homer 1a/Homer 1b) is important for morphological development of the neuronal dendritic arbor. Cells expressing exogenous Homer 1b fail to grow to the same size as cells expressing exogenous Homer 1a or EGFP. Because Homer has been implicated in regulation of glutamatergic transmission (Sala et al., 2001; Hennou et al., 2003; Sala et al., 2003; Van Keuren-Jensen et al., 2006), and because several studies have suggested that glutamatergic synaptic transmission affects dendritic arbor development (Rajan et al 1999; Rajan and Cline, 1998; Cline 2001; Zhou et al., 2004; Matsuzaki et al., 2004; Chen and Ghosh 2005; Haas et al, 2006), it is possible that dendritic arbor development is affected in neurons expressing exogenous Homer 1b, because they have altered synaptic properties. We, therefore, compared several aspects of synaptogenesis and synaptic maturation in cells expressing exogenous Homer 1a or Homer 1b to controls.
Homer expression affects the development of glutamatergic synaptic transmission
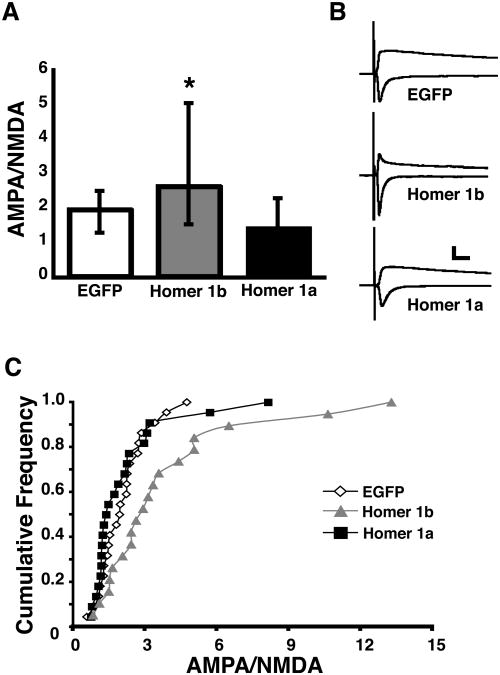
To test whether changing the Homer proteins within a cell for three days affects the development of synaptic currents, cells were transfected by whole brain electroporation (WBE) with EGFP alone or EGFP and either Homer 1a or Homer 1b. We identified transfected neurons by EGFP expression and recorded evoked synaptic currents three days after WBE, and determined the AMPA/NMDA ratio. The AMPA/NMDA ratio is an indicator of synaptic maturation (Wu et al., 1996). As glutamatergic neurons in the tectum mature the AMPA/NMDA ratio increases as the predominantly NMDAR-only immature synapses acquire AMPAR (Wu et al., 1996). Neurons expressing Homer 1b had significantly larger AMPA/NMDA ratios than neurons expressing EGFP alone or Homer 1a (Kruskal Wallis p<0.02, post test p<0.01, Fig. 7A,B). The cumulative frequency plot (Fig. 7C) shows that the distributions of AMPA/NMDA ratios are significantly different between Homer 1b-expressing neurons and either EGFP or Homer1a-expressing neurons. These data indicate that overexpression of Homer 1b increased the ratio of AMPA- to NMDA receptor–mediated synaptic responses, characteristic of mature tectal neurons.
Figure 7.
Homer1b expression increases AMPA to NMDA ratios. (A) Medians and IQR of AMPA to NMDA ratio for cells expressing EGFP, Homer 1a, or Homer 1b. (B) Representative AMPA and NMDA traces for each condition. AMPA currents were recorded at −60mV;AMPA and NMDA currents were recorded at +55mV. Scale bar = 50 pA and 20 msec. (C) Cumulative frequency plot of all of the data points for each condition. (n =19-22 cells in each condition).
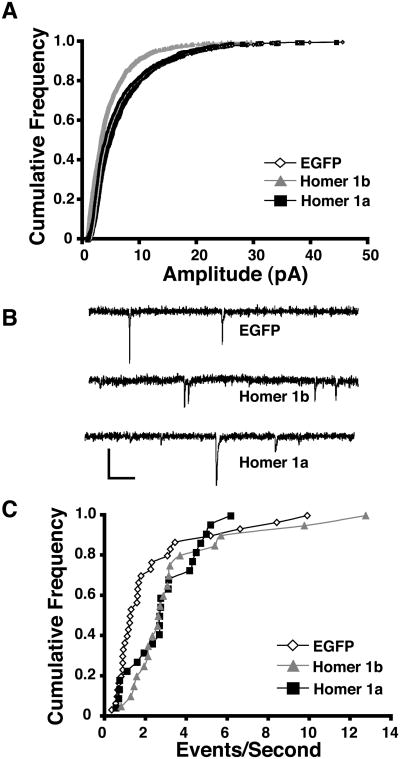
We further tested whether Homer affects synaptic transmission in optic tectal neurons by recording spontaneous AMPA miniature postsynaptic excitatory currents (mEPSC) 3 days after transfection. Brains from tadpoles transfected with EGFP, Homer 1a, or Homer 1b were placed in TTX (1 μm solution) and AMPA mEPSCs were measured at −60 mV. Homer 1b-expressing neurons had significantly smaller AMPA mEPSC amplitudes (Kruskal Wallis p<0.001, post test p<0.005, Fig. 8A). Fifty random events from each cell were used to examine the distribution of amplitudes for each condition (Kolmogorov Smirnov test between EGFP and Homer 1b p<.0001, Fig. 8A). In addition, AMPA mEPSC frequency was higher in cells expressing Homer 1a and Homer 1b compared to EGFP (Kruskal Wallis p<0.02, Fig. 8B,C). Because the frequency of events was greater in cells expressing Homer1b, but the amplitudes were smaller, we tested whether the AMPA-mediated charge transfer differed between the three groups by multiplying the average mEPSC amplitude by the number of events over a one minute interval for ten cells in each group. First we determined that there was no difference in the rise or decay times for mEPSCs among the groups (Kruskal Wallis: rise time p<0.2, decay time p<0.2). Interestingly, there was also no difference in charge transfer between the groups (Kruskal Wallis p<0.5) suggesting that the AMPA-mediated input to cells expressing Homer1b or Homer 1a is comparable to controls.
Figure 8.
Homer1a and Homer1b expression increase AMPA mEPSC frequency. (A) Cumulative frequency plot of AMPA mEPSC amplitudes for cells expressing EGFP, Homer 1a, or Homer 1b. 50 events were analyzed from each cell. (B) Example traces for each condition. Scale bar = 10 pA and 100 ms. (C) Cumulative frequency plot of AMPA mEPSC frequency for cells expressing EGFP, Homer 1a, or Homer 1b. (n = 21-30 cells in each condition).
To test whether postsynaptic Homer expression affects the probability of transmitter release from presynaptic terminals, we recorded paired pulse ratios from cells transfected with the three different constructs. Paired pulse ratio (PPR, the amplitude of the second event divided by the amplitude of the first event) negatively correlates with the probability of neurotransmitter release (Zucker and Regehr, 2002). The PPR of 15-20 neurons transfected with Homer 1a or Homer 1b was not statistically different from cells expressing EGFP (Kruskal Wallis p<0.08, data not shown), indicating that Homer expression does not retrogradely affect presynaptic release from retinal axons.
Discussion
These data indicate the expression levels of Homer proteins can regulate the morphological development of dendritic arbors in vivo. Cells expressing exogenous Homer 1b fail to elaborate a dendritic arbor of comparable size to cells expressing exogenous Homer 1a or EGFP. The electrophysiological characterization of these cells indicates that increasing Homer 1b expression in the cell increased synaptic maturation, as evidenced by larger AMPA/NMDA ratios. Homer1b expression also increased AMPA mEPSC frequency, suggesting that these neurons have more glutamatergic synaptic inputs than control neurons. This conclusion is further supported by our finding that the AMPAR-mediated charge transfer to cells in all of the conditions is comparable, despite smaller mEPSCs in cells expressing Homer 1b. These data suggest that Homer1b expression, and the likely increase in the ratio of Homer1b to Homer1a, promotes synaptic maturation, increases synaptic inputs to the cell, and slows dendritic arbor growth rate. It is interesting to note that a similar increase in synaptic maturation and slowed dendritic arbor growth rate was seen with expression of constitutively active CaMKII (Wu et al., 1996; Wu and Cline, 1998). Homer 1a transfection did not significantly affect synaptic maturation or the features of dendritic arbor development studied here.
The temporal features of changes in Homer1b to Homer1a expression may be critical in regulating the dynamic aspects of synaptic transmission and arbor development, since Homer1a expression or increases in endogenous Homer1a by visual stimulation can affect AMPAR-mediated synaptic transmission over short time periods (Van Keuren-Jensen and Cline, 2006), but such a difference is not seen after 3 days of Homer1a expression.
The decreased amplitudes of the AMPA mEPSCs in Homer1b -expressing neurons suggest that these neurons have altered glutamatergic transmission at individual synapses throughout the neurons, reminiscent of homeostatic synaptic scaling of AMPAR mEPSCs seen in a variety of systems following prolonged periods of altered synaptic activity levels (Aizenman et al., 2002; Maffei et al. 2004; Geol and Lee, 2007). Several distinct mechanisms have been shown to regulate the amplitudes of AMPA mEPSCs recorded from tectal neurons following visual stimulation and activity-dependent changes in Homer1a expression (Aizenman et al., 2002; Van Keuren-Jensen and Cline, 2006). After 4 hour of enhanced visual stimulation, homeostatic decreases in mEPSC amplitude occur through AMPAR modulation by intracellular polyamines (Aizenman et al, 2002). Over a shorter time frame of 30 minutes, visual stimulation and the resultant increased Homer1a expression modulates mEPSC amplitude mediated by mGluR activation (Van Keuren-Jensen and Cline, 2006). Several studies have demonstrated that altering the balance of Homer 1a to Homer 1b results in rearrangements of components of the pre- and postsynaptic elements (Kato et al. 1998; Xiao et al., 1998; Hennou et al., 2003; Sala et al., 2003; Inoue et al., 2007) including AMPAR containing the GluR2 subunit. These findings are consistent with our results that altering Homer1a or Homer1b expression affects synaptic transmission.
Homer proteins have also been shown to regulate plasticity (as opposed to homeostasis) of ionotropic glutamatergic transmission (Celikel et al., 2007; Kammermeier and Worley, 2007; Ronesi and Huber, 2008) and structural plasticity of spines (Shinoda et al., 2005) likely mediated by interactions with mGluRs. These data suggest that mGluR signaling may affect structural plasticity. It will be important to decipher how mGluR-Homer interactions can lead to the divergent molecular outcomes in thusfar reported in neurons.
In addition to the changes in AMPAR responses, our data suggest that Homer lb has an impact on NMDARs as well. We saw a significant increase in AMPA/NMDA ratios for cells expressing exogenous Homer 1b and a significant decrease in AMPA mEPSC amplitude. Together these data indicate that NMDAR synaptic transmission is dramatically reduced by Homer 1b expression.
In conclusion, this study compared the effects of Homer1a and Homer1b expression on dendritic arbor development and synaptic maturation in optic tectal neurons in the intact Xenopus tadpole. The results suggest that decreasing the ratio of Homer1a to Homer1b by exogenous expression of Homer1b over a 3-day period increases synaptic strength and the number of synaptic inputs to the neurons and coordinately slows dendritic arbor growth rate. The data suggest that neurons slow arbor growth rates once synaptic inputs reach a certain strength, as was previously seen with manipulations of CaMKII activity (Wu et al, 1996; Wu and Cline, 1998; Zou and Cline, 1999). The data further suggest the changes in relative expression of Homer1a to Homer1b may signal the neuron that overall activity levels in the cell have changed, and this in turn could affect protein interactions at the synapse, synaptic transmission and dendritic arbor structural plasticity.
Acknowledgments
This work was supported by the National Eye Institute. We thank past and present members of the Cline lab for valuable discussions and Dr. Jen Bestman for careful reading of the manuscript.
References
- Aizenman CD, Munoz-Elias G, Cline HT. Visually driven modulation of glutamatergic synaptic transmission is mediated by the regulation of intracellular polyamines. Neuron. 2002;34:623–34. doi: 10.1016/s0896-6273(02)00674-8. [DOI] [PubMed] [Google Scholar]
- Aizenman CD, Akerman CJ, Jensen KR, Cline HT. Visually driven regulation of intrinsic neuronal excitability improves stimulus detection in vivo. Neuron. 2003;39:831–42. doi: 10.1016/s0896-6273(03)00527-0. [DOI] [PubMed] [Google Scholar]
- Ango F, Pin JP, Tu JC, Xiao B, Worley PF, Bockaert J, Fagni L. Dendritic and axonal targeting of type 5 metabotropic glutamate receptoris regulated by homer 1 proteins and neuronal excitation. J Neurosci. 2000;20:8710–9716. doi: 10.1523/JNEUROSCI.20-23-08710.2000. [DOI] [PMC free article] [PubMed] [Google Scholar]
- Ango F, Prezeau L, Muller T, Tu JC, Xiao B, Worley PF, Pin JP, Bockaert J, Fagni L. Agonist –independent activation of metabotropic glutamate receptors by the intracellular protein homer. Nature. 2001;411:962–965. doi: 10.1038/35082096. [DOI] [PubMed] [Google Scholar]
- Beneken J, Tu JC, Xiao B, Nuriya M, Yuan JP, Worley PF, Leahy DJ. Structure of the Homer EVH1 domain-peptide complex reveals a new twist in polyproline recognition. Neuron. 2000;26:143–154. doi: 10.1016/s0896-6273(00)81145-9. [DOI] [PubMed] [Google Scholar]
- Bestman JE, Ewald RC, Chiu SL, Cline HT. In vivo single-cell electroporation for transfer of DNA and macromolecules. Nat Protoc. 2006;1:1267–1272. doi: 10.1038/nprot.2006.186. [DOI] [PubMed] [Google Scholar]
- Bottai D, Guzowski JF, Schwarz MK, Kang SH, Xiao B, Lanahan A, Worley PF, Seeburg PH. Synaptic activity-induced conversion of intronic to exonic sequence in Homer 1 immediate early gene expression. J Neurosci. 2002;22:167–75. doi: 10.1523/JNEUROSCI.22-01-00167.2002. [DOI] [PMC free article] [PubMed] [Google Scholar]
- Brakeman PR, Lanahan AA, O'Brien R, Roche K, Barnes CA, Huganir RL, Worley PF. Homer: a protein that selectively binds metabotropic glutamate receptors. Nature. 1997;386:284–288. doi: 10.1038/386284a0. [DOI] [PubMed] [Google Scholar]
- Cantallops I, Haas K, Cline HT. Postsynaptic CPG15 promotes synaptic maturation and presynaptic axon arbor elaboration in vivo. Nat Neurosci. 2000;3:1004–11. doi: 10.1038/79823. [DOI] [PubMed] [Google Scholar]
- Celikel T, Marx V, Freudenberg F, Zivkovic A, Resnik E, Hasan M, Licznerski P, Osten P, Rosov A, Seeburg P, Schwarz M. Select overexpression of Homer 1a in dorsal hippocampus impairs spatial working memory. Frontiers in Neuro. 2007;1:97–110. doi: 10.3389/neuro.01.1.1.007.2007. [DOI] [PMC free article] [PubMed] [Google Scholar]
- Chen Y, Ghosh A. Regulation of dendritic development by neuronal acivity. J Neurobiol. 2005;64:4–10. doi: 10.1002/neu.20150. [DOI] [PubMed] [Google Scholar]
- Ciruela F, Soloviev MM, McIlhinney J. Co-expression of metabotropic glutamate receptor type 1a with Homer-1a/vesl-1s increases the cell surface expression of the receptor. Biochem J. 1999;341:795–803. [PMC free article] [PubMed] [Google Scholar]
- Ciruela F, Sloviev MM, Chan WY, McIlhinney J. Homer-1c/vesl-1l modulates the cell surface targeting of metabotropic glutamate receptor type 1a: evidence for an anchoring function. Mol and Cell Neurosci. 2000;15:36–50. doi: 10.1006/mcne.1999.0808. [DOI] [PubMed] [Google Scholar]
- Cline HT. Dendritic arbor development and synaptogenesis. Curr Opin Neurobiol. 2001;11:118–126. doi: 10.1016/s0959-4388(00)00182-3. [DOI] [PubMed] [Google Scholar]
- Geol A, Lee HK. Persistence of experience-induced homeostatic synaptic plasticity through adulthood in superficial layers of mouse visual cortex. J Neurosci. 2007;27:6692–700. doi: 10.1523/JNEUROSCI.5038-06.2007. [DOI] [PMC free article] [PubMed] [Google Scholar]
- Haas K, Sin WC, Javaherian A, Li Z, Cline HT. Single cell electroporation for gene transfer in vivo. Neuron. 2001;29:583–591. doi: 10.1016/s0896-6273(01)00235-5. [DOI] [PubMed] [Google Scholar]
- Haas K, Jensen K, Sin WC, Foa L, Cline HT. Targeted electroporation in Xenopus tadpoles in vivo – from single cells to the entire brain. Differentiation. 2002;70:148–154. doi: 10.1046/j.1432-0436.2002.700404.x. [DOI] [PubMed] [Google Scholar]
- Haas K, Li J, Cline HT. AMPA receptors regulate experience dependent dendritic arbor growth in vivo. Proc Natl Acad Sci. 2006;103:12127–12131. doi: 10.1073/pnas.0602670103. [DOI] [PMC free article] [PubMed] [Google Scholar]
- Haas K, Cline HT. The regulation of dendritic arbor development and plasticity by glutamatergic synaptic input: a review of the synaptotrophic hypothesis. J Physiol. 2008 doi: 10.1113/jphysiol.2007.150029. in press. [DOI] [PMC free article] [PubMed] [Google Scholar]
- Hennou S, Kato A, Schneider EM, Lundstrom K, Gahwiler BH, Inokuchi K, Gerber U, Ehrengruber MU. Homer-1a/Vesl-1S enhances hippocampal synaptic transmission. Eur J Neurosci. 2003;18:811–9. doi: 10.1046/j.1460-9568.2003.02812.x. [DOI] [PubMed] [Google Scholar]
- Inoue Y, Udo H, Inokuchi K, Sugiyama H. Homer1a regulates the activity-induced remodeling of synaptic structures in cultured hippocampal neurons. Neuroscience. 2007;150:841–52. doi: 10.1016/j.neuroscience.2007.09.081. [DOI] [PubMed] [Google Scholar]
- Kammermeir PJ, Worley PF. Homer 1a uncouples metabotropic glutamate receptor 5 from postsynaptic effectors. Proc Natl Acad Sci. 2007;104:6055–6060. doi: 10.1073/pnas.0608991104. [DOI] [PMC free article] [PubMed] [Google Scholar]
- Kato A, Ozawa F, Saitoh Y, Hirai K, Inokuchi K. vesl, a gene encoding VASP/Ena family related protein, is upregulated during seizure, long-term potentiation and synaptogenesis. Febs Lett. 1997;412:183–189. doi: 10.1016/s0014-5793(97)00775-8. [DOI] [PubMed] [Google Scholar]
- Maffei A, Nelson S, Turrigiano G. Selective reconfiguration of layer 4 visual cortical circuitry by visual deprivation. Nat Neurosci. 2004;7:1353–9. doi: 10.1038/nn1351. [DOI] [PubMed] [Google Scholar]
- Matsuzaki M, Honkura N, Ellis-Davies GC, Kasai H. Structural basis of long-term potentiaion in single dendritic spines. Nature. 2004;429:761–766. doi: 10.1038/nature02617. [DOI] [PMC free article] [PubMed] [Google Scholar]
- Rajan I, Witte S, Cline HT. NMDA receptor activity stabilizes presynaptic retinotectal axons and postsynaptic optic tectal cell dendrites in vivo. J Neurobiol. 1999;38:357–368. doi: 10.1002/(sici)1097-4695(19990215)38:3<357::aid-neu5>3.0.co;2-#. [DOI] [PubMed] [Google Scholar]
- Rajan I, Cline HT. Glutamate receptor activity is required for normal development of tectal cell dendrites in vivo. J Neurosci. 1998;18:7836–46. doi: 10.1523/JNEUROSCI.18-19-07836.1998. [DOI] [PMC free article] [PubMed] [Google Scholar]
- Ronesi JA, Huber KM. Homer interactions are necessary for metabotropic glutamate receptor-induced long-term depression and translational activation. J Neurosci. 2008;28:543–547. doi: 10.1523/JNEUROSCI.5019-07.2008. [DOI] [PMC free article] [PubMed] [Google Scholar]
- Sala C, Piech V, Wilson NR, Passafaro M, Liu G, Sheng M. Regulation of dendritic spine morphology and synaptic function by Shank and Homer. Neuron. 2001;31:115–130. doi: 10.1016/s0896-6273(01)00339-7. [DOI] [PubMed] [Google Scholar]
- Sala C, Futai K, Yamamoto K, Worley PF, Hayashi Y, Sheng M. Inhibition of dendritic spine morphogenesis and synaptic transmission by activity-inducible protein Homer1a. J Neurosci. 2003;23:6327–37. doi: 10.1523/JNEUROSCI.23-15-06327.2003. [DOI] [PMC free article] [PubMed] [Google Scholar]
- Shinoda Y, Kamikubo Y, Egashira Y, Tominaga-Yoshino K, Ogura A. Repetition of mGluR-dependent LTD causes slowly developing persistent reduction in synaptic strength accompanied by synapse elimination. Brain Res. 2005;1042:99–107. doi: 10.1016/j.brainres.2005.02.028. [DOI] [PubMed] [Google Scholar]
- Tadokoro S, Tachibana T, Imanaka T, Nishida W, Sobue K. Involvement of unique leucine-zipper motif of PSD-Zip45 (Homer 1c/vesl-1L) in group 1 metabotropic glutamate receptor clustering. PNAS. 1999;96:13801–13806. doi: 10.1073/pnas.96.24.13801. [DOI] [PMC free article] [PubMed] [Google Scholar]
- Tu JC, Xiao B, Yuan JP, Lanahan AA, Leoffert K, Li M, Linden DJ, Worley PF. Homer binds a novel proline-rich motif and links group 1 metabotropic glutamate receptors with IP3 receptors. Neuron. 1998;21:717–726. doi: 10.1016/s0896-6273(00)80589-9. [DOI] [PubMed] [Google Scholar]
- Tu JC, Xiao B, Naisbitt S, Yuan JP, Petralia RS, Brakeman P, Doan A, Aakalu VK, Lanahan AA, Sheng M, Worley PF. Coupling of mGluR/Homer and PSD-95 complexes by the Shank family of postsynaptic density proteins. Neuron. 1999;23:583–592. doi: 10.1016/s0896-6273(00)80810-7. [DOI] [PubMed] [Google Scholar]
- Turrigiano GG, Nelson SB. Thinking globally, acting locally: AMPA receptor turnover and synaptic strength. Neuron. 1998;21:933–5. doi: 10.1016/s0896-6273(00)80607-8. [DOI] [PubMed] [Google Scholar]
- Turrigiano GG, Nelson SB. Homeostatic plasticity in the developing nervous system. Nat Rev Neurosci. 2004;5:97–107. doi: 10.1038/nrn1327. [DOI] [PubMed] [Google Scholar]
- Van Keuren-Jensen K, Cline HT. Visual experience regulates metabotropic glutamate receptor-mediated plasticity of AMPA receptor synaptic transmission by Homer 1a induction. J Neurosci. 2006;26:7575–80. doi: 10.1523/JNEUROSCI.5083-05.2006. [DOI] [PMC free article] [PubMed] [Google Scholar]
- Wu GY, Malinow R, Cline HT. Maturation of a central glutamatergic synapse. Science. 1996;274:972–976. doi: 10.1126/science.274.5289.972. [DOI] [PubMed] [Google Scholar]
- Wu GY, Cline HT. Stabilization of dendritic arbor structure in vivo by CaMKII. Science. 1998;279:222–6. doi: 10.1126/science.279.5348.222. [DOI] [PubMed] [Google Scholar]
- Xiao B, Tu JC, Petralia RS, Yuan JP, Doan A, Breder CD, Ruggiero A, Lanahan AA, Wenthold RJ, Worley PF. Homer regulates the association of group 1 metabotropic glutamate receptors with multivalent complexes of homer-related, synaptic proteins. Neuron. 1998;21:707–716. doi: 10.1016/s0896-6273(00)80588-7. [DOI] [PubMed] [Google Scholar]
- Yuan JP, Kiselyov K, Shin DM, Chen J, Shcheynikov N, Kang SH, Dehoff MH, Schwarz MK, Seeburg PH, Muallem S, Worley PF. Homer binds TRPC family channels and is required for gating of TRPC1 by IP3 receptors. Cell. 2003;114:777–89. doi: 10.1016/s0092-8674(03)00716-5. [DOI] [PubMed] [Google Scholar]
- Zhou Q, Homma KJ, Poo MM. Shrinkage of dendritic spines associated with long-term depression of hippocampal synapses. Neuron. 2004;44:749–757. doi: 10.1016/j.neuron.2004.11.011. [DOI] [PubMed] [Google Scholar]
- Zhu JJ, Malinow R. Acute versus chronic NMDAR blockade and synaptic AMPA receptor delivery. Nat Neurosci. 2002;5:513–514. doi: 10.1038/nn0602-850. [DOI] [PubMed] [Google Scholar]
- Zou DJ, Cline HT. Postsynaptic calcium/calmodulin-dependent protein kinase II is required to limit elaboration of presynaptic and postsynaptic neuronal arbors. J Neurosci. 1999;19:8909–18. doi: 10.1523/JNEUROSCI.19-20-08909.1999. [DOI] [PMC free article] [PubMed] [Google Scholar]
- Zucker RS, Regehr WG. Short-term synaptic plasticity. Annu Rev Physiol. 2002;64:355–405. doi: 10.1146/annurev.physiol.64.092501.114547. [DOI] [PubMed] [Google Scholar]


