


Abstract
Existing state-of-the-art methods that take a single RNA sequence and predict the corresponding RNA secondary structure are thermodynamic methods. These aim to predict the most stable RNA structure. There exists by now ample experimental and theoretical evidence that the process of structure formation matters and that sequences in vivo fold while they are being transcribed. None of the thermodynamic methods, however, consider the process of structure formation. Here, we present a conceptually new method for predicting RNA secondary structure, called CoFold, that takes effects of co-transcriptional folding explicitly into account. Our method significantly improves the state-of-art in terms of prediction accuracy, especially for long sequences of >1000 nt in length.
INTRODUCTION
The primary products of almost all genomes are transcripts, i.e. RNA sequences. The expression of many genes is regulated by RNA structure, which forms when the transcript interacts with itself by forming hydrogen-bonds between pairs of complementary nucleotides (G–C, A–U and G–U). These structures play key roles in regulating translation, transcription, splicing, RNA editing and transcript degradation. To study the potential functional role of a given transcript, it typically suffices to know its RNA secondary structure, i.e. the sequence positions that form base pairs. As entire transcriptomes are now routinely sequenced using high-throughput sequencing techniques, computational methods that predict an RNA secondary structure for a given input RNA sequences play a key role in assigning functional roles to new transcripts. The need for these methods is emphasized by the fact that the majority of mammalian genomes is transcribed into transcripts of yet unknown function (1,2), and that experimental techniques for RNA structure determination, such as X-ray crystallography and NMR, remain costly and slow.
More than 3 decades of research has been invested into devising methods that take a single RNA sequence and predict the corresponding RNA secondary structure. When homologous sequences from related species are scarce or not available, non-comparative methods, such as RNAfold (3) and Mfold (4), provide the state-of-art in terms of prediction accuracy. They use an optimization strategy that searches the space of potential secondary structures for the most stable structure and depends on hundreds of free-energy parameters that have been initially experimentally determined (5) and computationally tweaked (6). Recent attempts at replacing these thermodynamic parameters by probabilistic ones have lead to similar or slightly improved prediction accuracy (7). All non-comparative thermodynamic methods, however, show a marked drop in performance accuracy for increased sequence lengths.
Thermodynamic methods typically consider only the overall change in free energy to predict most stable RNA secondary structure conformation, but do not take into account the process of RNA structure formation. This implicitly assumes that the RNA sequence will always be able to reach the most stable RNA configuration in vivo. Key experiments (8–10) from the early 1980s, however, show that structure formation happens co-transcriptionally, i.e. while the RNA is being transcribed. Many experiments (11–19) have since substantiated this view. From these experiments, we know that RNA molecules are not necessarily in thermodynamic equilibrium during structure formation in vivo, and that the co-transcriptional folding process determines the formation of the functional RNA structure in vivo. In 1996, Morgan and Higgs (20) studied the discrepancies between the evolutionarily conserved RNA secondary structure and the corresponding predicted minimum free-energy (MFE) structures for long RNA sequences and concluded that these differences ‘cannot simply be put down to errors in the free-energy parameters used in the model’. They hypothesized that this difference may be due to effects of kinetic folding. Their results are complemented by statistical evidence that structured transcripts not only encode information on the functional RNA structure but also on their co-transcriptional folding pathway (21). Although there is thus ample evidence that the process of structure formation matters to the formation of the functional structure in vivo, it is ignored by the state-of-the-art methods for RNA secondary structure prediction.
A number of existing computational methods explicitly simulate the co-transcriptional folding pathway as a series of structural changes over time. These methods require a single sequence as input, and they return a list of predicted structural configurations. Most kinetic simulation methods use stochastic simulation and model the reaction kinetics of helix formation and disruption [e.g. RNAkinetics (22–24), Kinfold (25) and Kinefold (26–29)]. Conversely, Kinwalker (30) is a deterministic algorithm that uses free-energy minimization along with a heuristic that disallows transitions deemed kinetically infeasible. All of the aforementioned kinetic folding methods are inherently subject to length limitations (typically a few 100 bp); thus, they are not appropriate for the analysis of long RNA molecules. Because of the lack of experimentally confirmed RNA folding pathways, these methods have so far been evaluated on a small number of cases, mostly comprising only the final structure. Furthermore, these methods need to make a range of simplifying assumption about the in vivo environment, such as a constant transcription speed and no interaction partners. Kinetic folding pathway prediction methods are thus useful tools for the analysis of folding pathways, but suffer from significant limitations as tools for RNA secondary structure prediction.
Here, we propose a conceptually new method called CoFold for non-comparative secondary structure prediction that explicitly takes into account the effects of co-transcriptional folding. For this, we build on the state-of-the-art method for RNA secondary structure prediction, RNAfold (3), by combining its thermodynamic energy scores with a scaling function that captures effects of kinetic folding. CoFold does not aim to explicitly simulate the folding pathway, but rather to improve RNA secondary structure prediction by considering the implications of kinetic folding. We examine the predictive power of CoFold on a large and diverse set of known RNA secondary structures and show a significant improvement in prediction accuracy, in particular for long RNA sequences (>1000 nt), such as ribosomal RNAs (rRNA).
MATERIALS AND METHODS
Compilation of the long and combined data sets
The long data set consists of 16S and 23S rRNAs only. Bacteria, eukaryote, archaea and chloroplast multiple sequence alignments of 16S and 23S sequences were retrieved from the comparative RNA website (CRW) (31). Because no consensus RNA structure is provided for each alignment, we projected individual structures for each sequence onto the alignment. The structure with the lowest mismatch score was chosen as the consensus RNA structure for each alignment. The mismatch score is defined as  , where
  is the number of one-sided gaps (i.e. base pairs with a gap in one base position and a non-gap in the other),
  is the number of two-sided gaps (i.e. base pairs with gaps on both sides), I is the number of non-canonical pairs (i.e. those other than G–C, A–U and G–U) and N is the number of sequences in the alignment.
Sequences with large in-dels, many ambiguous nucleotides, or a poor fit to the consensus RNA structure were removed from the alignment. Unpaired regions of the alignment were realigned using MUSCLE (32). Individual sequences were extracted from each resulting alignment such that no pair of extracted sequences has a pairwise per cent sequence identity greater than an alignment-specific threshold. The exact threshold varies to ensure no biological class, or evolutionary clade is overrepresented in the long data set (max 85%, Supplementary Table S1). Because no two sequences are similar in terms of primary sequence conservation, we guarantee that the long data set is as diverse as possible and without redundancy. The consensus alignment structure was projected onto each extracted sequence by removing base pairs at gap positions and any non-canonical base pairs. The resulting 61 sequences have a mean sequence length of 2397 nt and constitute the long data set (Table 1, Supplementary Tables S1 and S2). The long data set thus contains all annotated sequences >1000 nt that meet our quality criteria for uniqueness and evolutionary support.
Table 1.
Evolutionary composition and length statistics for the long and the combined data set
| Long data set | Combined data set | ||
|---|---|---|---|
| Clade | >1000 nt | All | ≤1000 nt |
| Bacteria | 15 | 69 | (54) |
| Eukaryotes | 15 | 112 | (97) |
| Virus | 0 | 20 | (20) |
| Archea | 17 | 33 | (16) |
| Chloroplast | 14 | 14 | (0) |
| Sum | 61 | 248 | (187) |
| Sequence length (nt) | |||
| Average | 2397 | 776 | (247) |
| Minimum | 1245 | 110 | (110) |
| Maximum | 3578 | 3578 | (628) |
Numbers in brackets specify the respective numbers for the short sequences in the combined data set.
The combined data set was constructed primarily for robustness of parameter training, and it contains Rfam sequences from a wide variety of biological classes (33). Rfam alignments were chosen such that the mean sequence length is >115, co-variation (defined later in the text) is >0.18, they contain a minimum of 5 sequences, they contain at least 80% canonical base pairs and they include diverse biological classes and evolutionary clades.
Sequences were extracted from the Rfam alignments using the same protocol as for the CRW alignments described earlier in the text. Specifically, no pair of sequences extracted from the same alignment share a pairwise per cent sequence identity above an alignment-specific threshold (max 85%, Supplementary Table S1). Consensus RNA structures were projected onto individual sequences by removing base pairs at gap positions and by removing any non-canonical base pairs. The mean sequence length of the resulting 187 Rfam sequences is 247 nt, and the combined data set has an average sequence length of 778 nt (Table 1). See Supplementary Table S2 for a description of biological class and sequence extraction details and Supplementary Table S2 for alignment quality metrics.
For a given multiple-sequence alignment, the co-variation is defined as: 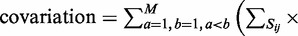
 , where
  is the set of base pairs i and j in the consensus secondary structure, M is the number of sequences in the alignment.
  is the Hamming distance between the strings
  and
and  .
.  is an indicator function such that if
  and
and  can form a canonical base pair, and
  and
and  can also form a canonical base pair,
  (otherwise
  ).
).  is an indicator function such that if
  and
and  and/or
  and
and  cannot for a canonical base pair,
  (otherwise
  ).
).
Definition of performance metrics
Structure prediction accuracy is measured on a base pair level. True positives (TP) are correctly predicted base pairs. False positives (FP) are incorrectly predicted base pairs that are not part of the reference structure. True negatives (TN) are hypothetical base pairs that are neither predicted nor part of the reference structure. False negatives (FN) are reference base pairs missed by the prediction. We define the following performance metrics: true positive rate ( ), false positive rate (
 ), positive predictive value (
 ) and Matthew’s correlation coefficient (MCC) (

 ). We define change in a performance metric X as
 .
.
True positive rate is a measurement of sensitivity and indicates the proportion of reference base pairs that were predicted. False positive rate and positive predictive value are both measurements of specificity, i.e. the abundance of false positives. MCC is a measurement of overall prediction quality, taking into account both sensitivity and specificity.
Incorporating co-transcriptional folding into the prediction algorithm of CoFold
The Nussinov algorithm (34) was one of the first attempts at RNA secondary structure prediction. It is a dynamic programming method that efficiently calculates the secondary structure with the largest number of base pairs in  time, where L denotes the length of the input sequence. The algorithm solves the problem recursively by determining the optimal structure for sub-sequences, and using these solutions to derive optimal structures for successively larger sub-sequences. The output structure is the optimal solution for the full sequence. This algorithm, however, has several shortcomings. First, base pairs vary in stability, for example, G–C pairs are energetically more favourable than A–U pairs. The Nussinov algorithm weights all pairs equally. Second, the stability of a base pair depends highly on its neighbouring base pairs because of so-called stacking interactions between adjacent pairs, and this contextual effect is ignored by the algorithm.
The Zuker–Stiegler algorithm (3) is an advancement of the Nussinov algorithm. Rather than predicting the structure with the greatest number of pairs, the Zuker–Stiegler algorithm predicts the most thermodynamically favourable (and pseudo-knot free) RNA structure according to a set of free-energy parameters. This structure is also called the MFE structure. The algorithm assigns a sequence-specific free-energy value to various structural building blocks, such as stacking interactions between pairs of adjacent base pairs, unpaired nucleotides and hairpin loops. The algorithm uses dynamic programming similarly to the Nussinov algorithm, but it calculates two energy values for all sub-sequences  of a given input sequence S, where
  (the MFE of sub-sequence
  given nucleotides i and j form a base pair) and
  (the MFE of sub-sequence
  )
)
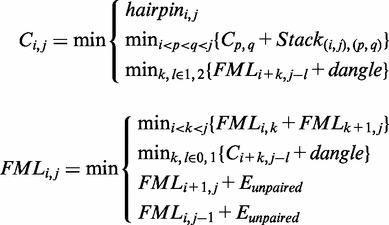 |
 and
and  are calculated for each sub-sequence
  as the minimum of a well-defined set of rules. The MFE can be retrieved from the value at
  , where L denotes the length of the input sequence. The corresponding MFE structure is retrieved by backtracking through the
  and
and  matrices.
The Zuker–Stiegler algorithm requires a large set of thermodynamic parameters. In 1999, the Turner group published one such model, which included a combination of experimentally measured energies and estimated values (5). This parameter set (called Turner 1999 parameter set) is widely used by many state-of-the-art tools, including RNAfold (35) and Mfold (4). Andronescu et al. (6) improved estimated values in the Turner 1999 parameter set by applying sophisticated machine-learning techniques to train 363 free parameter values (referred to as the Andronescu 2007 model). These parameters were adjusted using a training set of 3439 reference structures and 946 thermodynamic measurements by optical melting. They observed an average performance increase of 7% on a test set of 1660 sequences containing several biological classes, including tRNA, RNase P, rRNA and signal recognition particle (SRP) RNA.
The Zuker–Stiegler algorithm traditionally considers only the change in free energy for a given RNA secondary structure conformation in thermodynamic equilibrium, but it does not consider the process of RNA structure formation, i.e. how the RNA sequence arrives at the MFE structure. Rather, the Zuker–Stiegler algorithm implicitly assumes that the input RNA sequence (i) is already fully synthesized, (ii) is in thermodynamic equilibrium and (iii) will always be able to reach the RNA structure that minimizes the overall free energy of the molecule. We know from a range of experiments, however, that RNA molecules start to fold while they emerge during transcription, that they are not necessarily in thermodynamic equilibrium during structure formation in vivo and that they may get trapped during their kinetic folding pathway. That RNA molecules overall proceed towards the MFE structure over time is only an approximation of the complex reality in vivo. As the molecule emerges from the polymerase, local structures immediately begin to form. Formation of long-range base pairs may require disruption of these local structures, and their folding rate may be prohibitively slow because of high-energy barriers. That is, the molecule may never reach the MFE structure because of kinetic considerations. The structure formation in vivo may be further complicated because of trans interactions between the RNA sequence and other molecules in the living cell that we ignore for now.
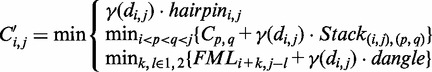
We propose a new method for RNA secondary structure prediction, CoFold, that takes into account some effects of co-transcriptional folding. The key effect that we aim to model is that during co-transcriptional folding in vivo, it does matter to a given sequence position whether a potential pairing partner is available for base pairing. To capture this, we model the distance along the sequence between base pairing sequence positions. CoFold is a modification to the Zuker–Stiegler algorithm (3), and it was implemented using the RNAfold source code from the ViennaRNA package (35,36).
CoFold calculates energies in the same fashion as in RNAfold, but all energy contributions associated with a base pair are modified by a scaling function according to the number of nucleotides between the pair (i.e. the distance d). This scaling function  models the exponential decay in reachability as function of the nucleotide distance d between the two potential pairing partners and depends on two parameters
  and
and  (Supplementary Figure S1). Both parameters have a straightforward interpretation. The value of
  specifies the range of the scaling function (e.g. when
  is 0.2, the affected free energies will range from 80 to 100% of their original values). The value of
  determines the rate of the exponential decay, where low values of
  result in a steep decay function.
The scaling function  is only used in conjunction with energy values in the
  calculation because these correspond to predicted base pairs. The function is not applied to the energy of sub-sequences to avoid multiple applications to the same value. The function is applied both to elements with positive energy, such as loops and bulges, and to those with negative energy, such as stacking interactions. This is necessary to preserve the relative magnitude of the contributions from structural components. See
  equation later in the text and Supplementary Figure S2 for detailed description. The
  calculation remains the same as in RNAfold.
 |
The output of CoFold is an RNA secondary structure that promotes base pairs according to the aforementioned scaling function. This RNA secondary structure, therefore, captures both thermodynamic contributions and effects because of co-transcriptional structure formation. Like RNAfold, CoFold allows the user to select a thermodynamic parameter set. For performance evaluation, we use both the Turner 1999 (CoFold) and the Andronescu 2007 (CoFold-A) parameter sets introduced earlier in the text.
Parameter training
CoFold has two free parameters:  and
and  . Because of the small number of parameters, they were trained using a simple brute force scheme. CoFold was run on all sequences of the combined data set, and performance metrics were calculated for each
  combination in set
  . The Turner 1999 thermodynamic parameter set (5) was used for
  parameter training. We define
  as the mean MCC for a set of sequences S and parameter combination (
 ) in P. The mean MCC change is likewise defined as
  .
.
Performance metrics were found to be highly correlated in  and
and  [Figure 1 (right) and Supplementary Figure S3]. To demonstrate this, linear regression was performed on the
  matrix [Figure 1 (left)]. We first compiled a set of triples
 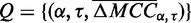 , for which
  is in the 97th quantile of the performance matrix. Weighted linear regression was performed with
  and
and  as dimensions and
  as the weight. The regression line fits the data with an
  value of 98.4%, indicating that variability in
  highly accounts for the variability in
  . Regression line (solid) and its 95% confidence region (dotted) are plotted in Figure 1 (left).
Figure 1.

Training of parameters in CoFold: linear fit and robustness. Left figure, heat-map showing the average MCC differences w.r.t. RNAfold as function of the  (x-axis) and
  (y-axis) parameters values. The average MCC differences are indicated via the colours from high (bright yellow) to low (dark red), see Supplementary Figure S3 for details. The solid line corresponds to the linear regression line (
 with a slope of
  and an intercept of
  ). The two dotted lines delineate the 95% confidence region. The asterisk shows parameter pair with highest average MCC (
 and
and  ), which is the parameter combination used in CoFold and CoFold-A. Right figure, same heat-map as in left figure, but this time showing the count of trials in 20 trials of 5-fold cross-validation where that the corresponding pair of parameter values has the highest average MCC for the set of training sequences.
Twenty trials of 5-fold cross-validation were performed to determine robustness of parameter training. In each trial, the combined data set D was randomly divided into five partitions  . The optimal parameter combination is determined for the remaining four partitions by optimizing
  . This results in five sampled
  parameter combinations for each trial. The cross-validation results are plotted in Figure 1 (right), where the integer in each cell indicates the number of trials where that parameter combination was optimal. The optimal parameter values highly cluster around the linear regression line shown in Figure 1 (left).
The default parameter combination for CoFold is  . This parameter set maximizes
  for the combined data set. The default parameter combination is marked with an ‘X’ in Figure 1 (left), which shows that it lies directly on the linear regression line.
Calculation of free-energy differences
We define  as the difference between the free energy (
 ) of a given prediction and the corresponding RNAfold prediction. We calculate these values for RNAfold-A, CoFold and CoFold-A. Because the Andronescu 2007 parameters use modified free-energy values, we use RNAeval from the ViennaRNA package (35,36) to calculate the free energy of each predicted structure on equal footing. Unlike RNAfold, which predicts an MFE structure from a sequence, RNAeval calculates the free energy for an input RNA structure according to the provided thermodynamic parameters. For consistency, we use the Turner 1999 thermodynamic model (5) for all
  calculations. For a prediction program X, which corresponds to RNAfold-A, CoFold or CoFold-A, we define absolute free-energy difference as
  and the relative free-energy difference as
 .
.
RESULTS
Folding long RNA sequences
We evaluate the prediction accuracy of CoFold by comparing the secondary structure predicted by CoFold with the known reference secondary structures for a test set of 61 sequences that consists of 16S rRNA and 23S rRNA sequences from archaea, bacteria, eukaryotes and chloroplasts. The sequences of this long data set have an average length of 2397 nt (min 1245 nt, max 3578 nt). Our goals in compiling this data set were to identify sequences that are long ( 1000 nt), correspond to biological sequences and have reference structures that are supported by phylogenetic evidence (Table 1 and Supplementary Tables S1 and S2).
Compared with RNAfold, which is the state-of-the-art thermodynamic RNA structure prediction method, CoFold predicts 7% more known base pairs at 6% higher specificity than RNAfold, thereby increasing the MCC by 6% [MCC (RNAfold) = 42.81%, MCC (CoFold) = 49.10%] (Table 2). This improvement in overall performance accuracy can be attributed to a simultaneous increase of the positive predictive value (PPV) and the true positive rate (TPR) for almost all individual sequences (Figure 2 left) and a simultaneous slight decrease of the false positive rate (FPR) (Figure 2 right). Both RNAfold and CoFold use the default Turner 1999 free-energy parameters (5). Combining CoFold with the Andronescu 2007 free-energy parameters (6) (CoFold-A) increases the sensitivity and specificity by a further 4% [MCC (CoFold-A) = 53.70%]. Doing the same with RNAfold (RNAfold-A) also increases the sensitivity and specificity with respect to RNAfold, but it results in a smaller performance increase than for CoFold [MCC (RNAfold-A) = 48.17%, MCC (CoFold) = 49.10%]. Although CoFold only depends on two free parameters, the Andronescu 2007 free-energy model (6) comprises 363 free parameters that were trained using machine-learning techniques.
Table 2.
Prediction accuracy of CoFold for base pairs
| Method | TPR (%) | FPR (%) | PPV (%) | MCC (%) |
|---|---|---|---|---|
| RNAfold | 46.30 | 0.0176 | 39.74 | 42.81 |
| RNAfold-A | 52.02 | 0.0160 | 44.76 | 48.17 |
| CoFold | 52.83 | 0.0159 | 45.79 | 49.10 |
| CoFold-A | 57.80 | 0.0145 | 50.06 | 53.70 |
The performance accuracy of CoFold, CoFold-A, RNAfold and RNAfold-A for the long data set in terms of true positive rate ( ), false positive rate (
 ), PPV (
 ) and MCC (
 ), where TP denotes the numbers of true positives, TN the true negatives, FP the false positives and FN the false negatives.
Figure 2.

Changes in prediction accuracy for the structures predicted by CoFold for individual sequences. We report the prediction accuracy for base pairs of the long data set in terms of absolute changes by comparing the prediction accuracy of the structures predicted by CoFold with those predicted by RNAfold. The left plot shows change of the true positive rate ( ) and PPV (
 ). The right plot shows changes in true positive rate (
 ) and false positive rate (
 ). TP denotes the numbers of true positives, TN the true negatives, FP the false positives and FN the false negatives.
Capturing effects of co-transcriptional folding
To capture effects of co-transcriptional folding in CoFold, we introduce a scaling function  . This function scales the nominal energy contribution of any base pair-like interaction depending on the distance d of the interaction partners along the sequence (Supplementary Figure S1). It thereby captures that during co-transcriptional folding, potential pairing partners in close proximity are easier to identify than more distant ones. This scaling amounts to a re-weighing of the structure search space that the structure prediction algorithm explores. Rather than guiding the structure prediction solely based on thermodynamic considerations as the state-of-the-art methods RNAfold and Mfold (4) do, CoFold thus combines kinetic and thermodynamic considerations.
The scaling function of CoFold depends on two free parameters,  and
and  , which have a straightforward interpretation (Supplementary Figure S1). Our goal in training the two parameters was to ensure that CoFold can be applied across a wide range of sequence lengths and to confirm that parameter training is robust.
To this end, we compiled an extended data set of 248 sequences that comprises the 61 long sequences of the long data set and, in addition, 187 short sequences ( nt in length) that also correspond to biological sequences whose reference structures are supported by phylogenetic evidence (Table 1 and Supplementary Tables S1 and S2). The sequences in this combined data set have an average length of 776 nt (min 110 nt, max 3578 nt). Using 20 trials of 5-fold cross-validation for parameter training, we find that the optimal prediction accuracy in terms of average MCC is obtained by a combination of
  and
and  values whose strong correlation can be described by a linear function
  , where
  is the slope and
  the intercept (
 %) [Figure 1 (left)]. Our cross-validation experiments yield optimal parameter combinations that fall within or near the 95% confidence interval around the linear fit, thus confirming the robustness of parameter training [Figure 1 (right)]. We use
  and
and  in CoFold and CoFold-A for all of the following (Supplementary Figure S1).
CoFold and CoFold-A outperform RNAfold and RNAfold-A also for short sequences ( nt), although the improvement in terms of MCC is less pronounced than for long sequences (Supplementary Table S3). RNAfold shows a slight decrease in prediction accuracy when used with the Andronescu 2007 parameters. The behaviour of CoFold is in line with our expectation that the beneficial impact of modelling co-transcriptional folding decreases for short sequences.
We conclude that CoFold effectively depends only on one free parameter, and that CoFold and CoFold-A increase the prediction accuracy for all sequence lengths, in particular for long sequences ( nt).
nt).
To investigate whether the scaling function 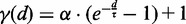 models the reachability of potential pairing partners during co-transcriptional folding rather than in thermodynamic equilibrium, we studied it for the sub-set of 25 viral sequences only which are known to be transcribed at higher speed than the other sequences of the combined data set. These 25 viral sequences derive from Rfam families RF00209 (5 sequences), RF00171 (5 sequences), RF00210 (4 sequences), RF00458 (6 sequences.) and RF01084 (5 sequences) and are all shorter than 1000 nt (Supplementary Table S1). Considering the same combinations for
  and
and  and applying the same linear fit procedure as before to this sub-set of viral sequences (index v) yields the linear regression line
  with
with  and
and  compared with
  with
with  and
and  for the entire combined data set. Setting
  allows us to express
  as function of
  . We thereby obtain
  for
for  , which is the optimal value for the combined data set. The
  function for the viral sub-sequences thus has a stronger decrease of reachability with increasing distance d of the pairing partners. This is in line with the increased transcription speed for the viral sequences, which gives emerging nucleotides less time to identify potential pairing partners.
We conclude that the scaling function captures information on the co-transcriptional folding kinetics, but that it would require a larger data set to investigate the dependency on the transcription speed in greater detail.
In all of the following, we use  and
and  in CoFold and CoFold-A, i.e. the optimal parameter combination for the combined data set (Supplementary Figure S1).
Capturing co-transcriptional folding yields improved structures of similar free energies
To examine whether capturing the effects of co-transcriptional folding significantly changes the free energies of the predicted structures, we calculated the free energies of the structures predicted by CoFold, CoFold-A and RNAfold-A and compared them to the free energies of the corresponding structures predicted by RNAfold. To ensure consistency, we used the Turner 1999 energy parameters to calculate the energies of all predicted RNA structures.
The structures predicted by CoFold for the long data set differ on average by 2% from the respective free energies of the corresponding structures predicted by RNAfold and the distribution of relative energy differences is comparatively tight (SD = 1.0%, min = 0.2%, max = 4.4%) (Figure 3, Supplementary Figure S4 and Supplementary Table S4). Combining CoFold and RNAfold with the Andronescu 2007 energy parameters significantly increases the average free-energy difference [5% (RNAfold-A), 7% (CoFold-A)], broadens the distributions [SD(RNAfold-A) = 1.9%, SD(CoFold-A) = 2.4%] and leads to higher maximum energy differences [max(RNAfold-A) = 11.1%, max(CoFold-A) = 13.1%]. For short and viral sequences, these differences are even more pronounced (Supplementary Table S4).
Figure 3.

Relative free-energy differences of the predicted structures w.r.t. the MFE structures predicted by RNAfold. Summary of three distributions for the long data set showing the relative free-energy differences of the RNA structures predicted by RNAfold-A w.r.t. the MFE structures predicted by RNAfold for the same sequence (left), of the RNA structures predicted by CoFold w.r.t. the MFE structures predicted by RNAfold (middle) and of the RNA structures predicted by CoFold-A w.r.t the MFE structures predicted by RNAfold-A (right). The free energies of all structures are calculated using the Turner 1999 energy parameters. For each of the three distributions, the dark horizontal line indicates the average, the box indicates the first to the third quartile and the dotted lines indicate minimum and maximum values. Circles indicate outliers which are not included in the calculation of the average value.
Most importantly, a large energy difference with respect to the free energy of the structure predicted by RNAfold does not imply an increased prediction accuracy, neither for short nor long sequences, and for none of the prediction programs (Supplementary Figure S5 and Supplementary Table S5).
To summarize, CoFold significantly increases the prediction accuracy without significantly altering the free energies of the structures that RNAfold would predict for the same input sequences.
Folding rRNAs
The 23S rRNAs are the longest sequences of our data set with an average length of 3069 nt (min 2882 nt, max 3578 nt) and are thus some of the most challenging RNA structures to predict. Using CoFold and CoFold-A, we increase their prediction accuracy in terms of MCC w.r.t. RNAfold on average by 8 and 12%, respectively. Figure 4 shows, for the 23S rRNA of the γ-proteobacteria Pseudomonas aeruginosa, how the RNA structure predicted by CoFold-A compares with that predicted by RNAfold. The most apparent differences are that RNAfold predicts many incorrect mid- and long-range base pairs (red arcs spanning >100 nt), and that almost all of these disappear with CoFold-A. In addition, CoFold-A adds many correct mid- and long-range base pairs (blue arcs), see in particular those spanning almost the entire sequence. Overall, CoFold-A increases the MCC of RNAfold from 43 to 58%. This 15% rise in performance accuracy is due to a significant increase of the true positive rate ( ) and an equally significant increase of the positive predictive value (
 ). This is in line with is the typical behaviour seen for CoFold (Figure 2). The false positive rate for both prediction methods remains low at 0.01%.
Figure 4.

RNA secondary structures predicted by CoFold-A and RNAfold for the 23S rRNA of the γ-proteobacteria P. aeruginosa. The horizontal line corresponds to the RNA sequence of 2893-nt length. The structure predicted by RNAfold is shown above the horizontal line, and the one predicted by CoFold-A is shown below. Each arc corresponds to a base pair between the two corresponding positions along the sequence. Blue arcs correspond to correctly predicted base pairs (true positives), red arcs to incorrectly predicted base pairs (false positives) and black arcs to base pairs that are part of the reference structure, but missing from the prediction (false negatives). Orange arcs indicate base pairs of the reference structure that render it pseudo-knotted. Figure made with R-chie (37).
We also investigated the performance for the 16S rRNAs in greater detail. With an average length of 1550 nt (min 1245 nt, max 1799 nt), these are significantly shorter than the 23S rRNAs, but still considerably longer than the average test sequence on which thermodynamic prediction methods are typically benchmarked. Figure 5 shows the improvements in prediction accuracy for the 16S rRNA of the freshwater algae Cryptomonas sp. (species unknown). This ribosomal sequence is 1493-nt long. CoFold-A improves the prediction accuracy of RNAfold from an MCC of 32–73%. This 41% improvement in performance accuracy is achieved by significantly reducing the number of erroneously predicted mid- to long-range base pairs (red arcs spanning >100 nt) while simultaneously increasing the number of correctly predicted base pairs in wide distance range (blue arcs). This is reflected by the simultaneous increase of the true positive rate  and the positive predictive value
  , which, in this example, is also accompanied by a slight reduction of the false positive rate
  .
.
Figure 5.

RNA secondary structures predicted by CoFold-A and RNAfold for the 16S rRNA of the freshwater algae Cryptomonas sp. The horizontal line corresponds to the RNA sequence of 1493-nt length. The structure predicted by RNAfold is shown above the horizontal line, and the one predicted by CoFold-A is shown below. Each arc corresponds to a base pair between the two corresponding positions along the sequence. Blue arcs correspond to correctly predicted base pairs (true positives), red arcs to incorrectly predicted base pairs (false positives) and black arcs to base pairs that are part of the reference structure, but missing from the prediction (false negatives). Orange arcs indicate base pairs of the reference structure that render it pseudo-knotted. Figure made with R-chie (37).
As neither CoFold nor RNAfold are technically capable of predicting pseudo-knotted features, the pseudo-knotted reference structures of the 23S rRNA and the 16S rRNA cannot be predicted with perfect accuracy (see orange arcs in Figures 4 and 5).
DISCUSSION AND CONCLUSION
Our results show that the state-of-the-art in non-comparative RNA secondary structure prediction can be significantly improved by capturing information on the structure formation process. To this end, we introduce a conceptually new RNA secondary structure prediction method called CoFold, which judges the reachability of potential pairing partners during co-transcriptional structure formation via a scaling function. We show that this scaling function effectively depends on only one free parameter that has a straightforward interpretation, as it determines how the reachability declines as function of the nucleotide distance during co-transcriptional folding.
By investigating a sub-set of 25 viral sequences, we show that the scaling function captures information on the speed of transcription, i.e. the folding kinetics. It would, however, require a larger data set to investigate this dependency in greater detail.
Without altering the free-energy parameters of the underlying thermodynamic model, CoFold, therefore, guides the structure prediction process by a combination of thermodynamic and kinetic considerations. It thereby arrives at significantly more accurate structure predictions, in particular for long sequences ( 1000 nt). This improvement in prediction accuracy is gained without significantly shifting the free energies of the predicted RNA structures. We thereby confirm Morgan and Higgs (20) who hypothesized in 1996 that discrepancies between the evolutionarily conserved, functional RNA secondary structure and the corresponding MFE structures predicted by thermodynamic methods, such as RNAfold, are not because of errors of the underlying free-energy parameters but are because of a lack of modelling the effects of kinetic structure formation.
Using CoFold, we can improve the prediction accuracy for rRNAs. As these sequences are known to be bound and stabilized by proteins early on, e.g. (38), and as CoFold does not explicitly model any trans-interactions with other molecules, we did not necessarily expect this significant improvement in prediction accuracy.
Many sophisticated experiments paint a dauntingly complex picture of co-transcriptional structure formation in vivo, which can depend on a multitude of extrinsic and intrinsic factors ranging from the speed of transcription and the variation thereof to a range of carefully orchestrated trans and cis interactions. Several sophisticated computational methods have already been devised that aim to mimic the co-transcriptional structure formation in vivo (22–28,30). These folding pathway prediction methods need to make a range of simplifying assumptions to approximate the complex in vivo environment and have so far been evaluated only on a few select and typically short ( 1000 nt) sequences. Yet, these methods have already allowed us to gain valuable and detailed insight into co-transcriptional folding pathways (26,39).
By proposing a conceptually new approach to RNA secondary structure prediction that combines the benefits of deterministic, thermodynamic methods with models that take the structure formation process explicitly into account, we show that we can significantly increase the prediction accuracy. Although CoFold only constitutes the first attempt at explicitly capturing the effects of co-transcriptional folding, we hope that our results will inspire a new generation of RNA secondary structure prediction programs that capture additional effects of co-transcriptional folding in vivo.
The CoFold web server is available at http://www.e-rna.org/cofold where individual queries can be submitted online, and the source code of CoFold is available for download.
One aspect that we hope to capture next is to explicitly model the influence that transient RNA structure features may have on the formation of the final RNA structure. We know from an earlier theoretical study (21) that structured RNAs not only encode their final functional RNA structure but also information on transient structural features of their co-transcriptional folding pathway in vivo. It should be conceptually possible to capture the impact of these potential transient features on the formation on the final RNA structure. This will, however, require a significant modification of the current prediction algorithm underlying CoFold.
Another important aspect of co-transcriptional RNA structure formation that will probably prove harder to capture is trans-interactions with other molecules, such as other RNAs or proteins. To take these into account in a predictive model, such as CoFold, one would need to already know the binding site and timing of these interactions with respect to the transcription of the RNA. Right now, however, this experimentally derived information is only available for a few select RNAs.
SUPPLEMENTARY DATA
Supplementary Data are available at NAR Online: Supplementary Tables 1–5 and Supplementary Figures 1–5.
FUNDING
Funding for open access charge: Natural Sciences and Engineering Research Council (NSERC. www.nserc-crsng.gc.ca) of Canada and Canada Foundation for Innovation (CFI, www.innovation.ca/) (to I.M.M); Alexander Graham Bell Canada Graduate Scholarship from NSERC with CIHR/MSFHR Bioinformatics Training Program at the University of British Columbia (www.bioinformatics.ubc.ca) (to J.R.P.). CIHR is the Canadian Institutes of Health Research (www.cihr-irsc.gc.ca) and MSFHR is the Michael Smith Foundation for Health Research in Canada (www.msfhr.org). The funders had no role in study design, data collection and analysis, decision to publish or preparation of the manuscript.
Conflict of interest statement. None declared.
Supplementary Material
REFERENCES
- 1.Mattick JS, Makunin IV. Non-coding RNA. Hum. Mol. Genet. 2006;15:R17–R29. doi: 10.1093/hmg/ddl046. [DOI] [PubMed] [Google Scholar]
- 2.FANTOM Consortium and RIKEN Genome Exploration Research Group and Genome Science Group (Genome Network Project Core Group) The transcriptional landscape of the mammalian genome. Science. 2005;309:1559–63. doi: 10.1126/science.1112014. [DOI] [PubMed] [Google Scholar]
- 3.Zuker M, Stiegler P. Optimal computer folding of large RNA sequences using thermodynamic and auxiliary information. Nucleic Acids Res. 1981;9:133–148. doi: 10.1093/nar/9.1.133. [DOI] [PMC free article] [PubMed] [Google Scholar]
- 4.Zuker M. Mfold web server for nucleic acid folding and hybridization prediction. Nucleic Acids Res. 2003;31:3406–3415. doi: 10.1093/nar/gkg595. [DOI] [PMC free article] [PubMed] [Google Scholar]
- 5.Mathews DH, Sabina J, Zuker M, Turner DH. Expanded sequence dependence of thermodynamic parameters improves prediction of RNA secondary structure. J. Mol. Biol. 1999;288:911–940. doi: 10.1006/jmbi.1999.2700. [DOI] [PubMed] [Google Scholar]
- 6.Andronescu M, Condon A, Hoos HH, Mathews DH, Murphy KP. Efficient parameter estimation for RNA secondary structure prediction. Bioinformatics. 2007;23:I19–I28. doi: 10.1093/bioinformatics/btm223. 15th Conference on Intelligent Systems for Molecular Biology/6th European Conference on Computational Biology, 21–25 July 2007. Vienna, Austria. [DOI] [PubMed] [Google Scholar]
- 7.Rivas E, Lang R, Eddy SE. A range of complex probabilistic models for RNA secondary structure prediction that includes the nearest-neighbor model and more. RNA. 2012;18:193–212. doi: 10.1261/rna.030049.111. [DOI] [PMC free article] [PubMed] [Google Scholar]
- 8.Boyle J, Robillard G, Kim S. Sequential folding of transfer RNA. A nuclear magnetic resonance study of successively longer tRNA fragments with a common 5′ end. J. Mol. Biol. 1980;139:601–625. doi: 10.1016/0022-2836(80)90051-0. [DOI] [PubMed] [Google Scholar]
- 9.Kramer F, Mills D. Secondary structure formation during RNA-synthesis. Nucleic Acids Res. 1981;9:5109–5124. doi: 10.1093/nar/9.19.5109. [DOI] [PMC free article] [PubMed] [Google Scholar]
- 10.Brehm S, Cech T. Fate of an intevening sequence ribonucleic-acid—excision and cyclization of the Tetrahymena ribosomal ribonucleic-acid intervening sequence in vivo. Biochemistry. 1983;22:2390–2397. doi: 10.1021/bi00279a014. [DOI] [PubMed] [Google Scholar]
- 11.Lewicki B, Margus T, Remme J, Nierhaus K. Coupling of rRNA transcription and ribosomal assembly in vivo—formation of active ribosomal-subunits in Escherichia coli requires transcription of RNA genes by host RNA polymerase which cannot be replaced by T7 RNA polymerase. J. Mol. Biol. 1993;231:581–593. doi: 10.1006/jmbi.1993.1311. [DOI] [PubMed] [Google Scholar]
- 12.Chao MY, Kan M, Lin-Chao S. RNAII transcribed by IPTG-induced T7 RNA polymerase is non-functional as a replication primer for ColE1-type plasmids in Escherichia coli. Nucleic Acids Res. 1995;23:1691–1695. doi: 10.1093/nar/23.10.1691. [DOI] [PMC free article] [PubMed] [Google Scholar]
- 13.Pan T, Fang X, Sosnick T. Pathway modulation, circular permutation and rapid RNA folding under kinetic control. J. Mol. Biol. 1999;286:721–731. doi: 10.1006/jmbi.1998.2516. [DOI] [PubMed] [Google Scholar]
- 14.Heilman-Miller S, Woodson S. Effect of transcription on folding of the Tetrahymena ribozyme. RNA. 2003;9:722–733. doi: 10.1261/rna.5200903. [DOI] [PMC free article] [PubMed] [Google Scholar]
- 15.Heilman-Miller S, Woodson S. Perturbed folding kinetics of circularly permuted RNAs with altered topology. J. Mol. Biol. 2003;328:385–394. doi: 10.1016/s0022-2836(03)00304-8. [DOI] [PubMed] [Google Scholar]
- 16.Mahen E, Harger J, Calderon E, Fedor M. Kinetics and thermodynamics make different contributions to RNA folding in vitro and in yeast. Mol. Cell. 2005;19:27–37. doi: 10.1016/j.molcel.2005.05.025. [DOI] [PubMed] [Google Scholar]
- 17.Adilakshmi T, Soper S, Woodson S. Structural analysis of RNA in living cells by in vivo synchrotron x-ray footprinting. Methods Enzymol. 2009;468:239–259. doi: 10.1016/S0076-6879(09)68012-5. [DOI] [PMC free article] [PubMed] [Google Scholar]
- 18.Mahen E, Watson P, Cottrell J, Fedor M. mRNA secondary structures fold sequentially but exchange rapidly in vivo. PLoS Biol. 2010;8:e1000307. doi: 10.1371/journal.pbio.1000307. [DOI] [PMC free article] [PubMed] [Google Scholar]
- 19.Woodson SA. Compact Intermediates in RNA folding. Annu. Rev. Biophys. 2010;39:61–77. doi: 10.1146/annurev.biophys.093008.131334. [DOI] [PMC free article] [PubMed] [Google Scholar]
- 20.Morgan S, Higgs P. Evidence for kinetic effects in the folding of large RNA molecules. J. Chem. Phys. 1996;105:7152–7157. [Google Scholar]
- 21.Meyer IM, Miklós I. Co-transcriptional folding is encoded within RNA genes. BMC Mol. Biol. 2004;10:5. doi: 10.1186/1471-2199-5-10. [DOI] [PMC free article] [PubMed] [Google Scholar]
- 22.Mironov A, Dyakonova L, Kister A. A kinetic approach to the prediction of RNA secondary structures. J. Biomol. Struct. Dyn. 1985;2:953–962. doi: 10.1080/07391102.1985.10507611. [DOI] [PubMed] [Google Scholar]
- 23.Mironov A, Lebedev V. A kinetic model of RNA folding. Biosystems. 1993;30:49–56. doi: 10.1016/0303-2647(93)90061-g. [DOI] [PubMed] [Google Scholar]
- 24.Danilova L, Pervouchine D, Favorov A, Mironov A. RNAkinetics: a web server that models secondary structure kinetics of an elongating RNA. J. Bioinform. Comput. Biol. 2006;4:589–596. doi: 10.1142/s0219720006001904. [DOI] [PubMed] [Google Scholar]
- 25.Flamm C, Fontana W, Hofacker IL, Schuster P. RNA folding at elementary step resolution. RNA. 2000;6:325–338. doi: 10.1017/s1355838200992161. [DOI] [PMC free article] [PubMed] [Google Scholar]
- 26.Isambert H, Siggia ED. Modeling RNA folding paths with pseudoknots: application to hepatitis delta virus ribozyme. Proc. Natl Acad. Sci. USA. 2000;97:6515–6520. doi: 10.1073/pnas.110533697. [DOI] [PMC free article] [PubMed] [Google Scholar]
- 27.Xayaphoummine A, Bucher T, Thalmann F, Isambert H. Prediction and statistics of pseudoknots in RNA structures using exactly clustered stochastic simulations. Proc. Natl Acad. Sci. USA. 2003;100:15310–15315. doi: 10.1073/pnas.2536430100. [DOI] [PMC free article] [PubMed] [Google Scholar]
- 28.Xayaphoummine A, Bucher T, Isambert H. Kinefold web server for RNA/DNA folding path and structure prediction including pseudoknots and knots. Nucleic Acids Res. 2005;33:W605–W610. doi: 10.1093/nar/gki447. [DOI] [PMC free article] [PubMed] [Google Scholar]
- 29.Gultyaev A, von Batenburg F, Pleij C. The computer-simulation of RNA folding pathways using a genetic algorithm. J. Mol. Biol. 1995;250:37–51. doi: 10.1006/jmbi.1995.0356. [DOI] [PubMed] [Google Scholar]
- 30.Geis M, Flamm C, Wolfinger MT, Tanzer A, Hofacker IL, Middendorf M, Mandl C, Stadler PF, Thurner C. Folding kinetics of large RNAs. J. Mol. Biol. 2008;379:160–173. doi: 10.1016/j.jmb.2008.02.064. [DOI] [PubMed] [Google Scholar]
- 31.Cannone J, Subramanian S, Schnare M, Collett J, D’Souza L, Du Y, Feng B, Lin N, Madabusi L, Muller K, et al. The Comparative RNA Web (CRW) Site: an online database of comparative sequence and structure information for ribosomal, intron, and other RNAs. BMC Bioinformatics. 2002;3:2. doi: 10.1186/1471-2105-3-2. [DOI] [PMC free article] [PubMed] [Google Scholar]
- 32.Edgar R. MUSCLE: multiple sequence alignment with high accuracy and high throughput. Nucleic Acids Res. 2004;32:1792–1797. doi: 10.1093/nar/gkh340. [DOI] [PMC free article] [PubMed] [Google Scholar]
- 33.Griffiths-Jones S, Moxon S, Marshall M, Khanna A, Eddy SR, Bateman A. Rfam: annotating non-coding RNAs in complete genomes. Nucleic Acids Res. 2005;33:D121–D124. doi: 10.1093/nar/gki081. [DOI] [PMC free article] [PubMed] [Google Scholar]
- 34.Nussinov R, Jacobson A. Fast algorithm for predicting the secondary structure of single-stranded RNA. Proc. Natl Acad. Sci. USA. 1980;77:6309–6313. doi: 10.1073/pnas.77.11.6309. [DOI] [PMC free article] [PubMed] [Google Scholar]
- 35.Hofacker I, Fontana W, Stadler P, Bonhoeffer S, Tacker M, Schuster P. Fast folding and comparison of RNA secondary strutures. Monatshefte für Chemie. 1994;125:167–188. [Google Scholar]
- 36.Lorenz R, Bernhart SH, Zu Siederdissen C, Tafer H, Flamm C, Stadler PF, Hofacker IL. ViennaRNA package 2.0. Algorithms Mol. Biol. 2011;6:26. doi: 10.1186/1748-7188-6-26. [DOI] [PMC free article] [PubMed] [Google Scholar]
- 37.Lai D, Proctor JR, Zhu JY, Meyer IM. R-CHIE: a web server and R package for visualizing RNA secondary structures. Nucleic Acids Res. 2012;40:e95. doi: 10.1093/nar/gks241. [DOI] [PMC free article] [PubMed] [Google Scholar]
- 38.Swiatkowska A, Wlotzka W, Tuck A, Barrass JD, Beggs JD, Tollervey D. Kinetic analysis of pre-ribosome structure in vivo. RNA. 2012;18:2187–2200. doi: 10.1261/rna.034751.112. [DOI] [PMC free article] [PubMed] [Google Scholar]
- 39.Schoemaker RJW, Gultyaev AP. Computer simulation of chaperone effects of Archael C/D box sRNA binding on rRNA folding. Nucleic Acids Res. 2006;34:2015–2026. doi: 10.1093/nar/gkl154. [DOI] [PMC free article] [PubMed] [Google Scholar]
Associated Data
This section collects any data citations, data availability statements, or supplementary materials included in this article.