

Abstract
Forkhead box P2 (FOXP2) is a highly conserved transcription factor that has been implicated in human speech and language disorders and plays important roles in the plasticity of the developing brain. The pattern of nucleotide polymorphisms in FOXP2 in modern populations suggests that it has been the target of positive (Darwinian) selection during recent human evolution. In our study, we searched for evidence of selection that might have followed FOXP2 adaptations in modern humans. We examined whether or not putative FOXP2 targets identified by chromatin-immunoprecipitation genomic screening show evidence of positive selection. We developed an algorithm that, for any given gene list, systematically generates matched lists of control genes from the Ensembl database, collates summary statistics for three frequency-spectrum-based neutrality tests from the low-coverage resequencing data of the 1000 Genomes Project, and determines whether these statistics are significantly different between the given gene targets and the set of controls. Overall, there was strong evidence of selection of FOXP2 targets in Europeans, but not in the Han Chinese, Japanese, or Yoruba populations. Significant outliers included several genes linked to cellular movement, reproduction, development, and immune cell trafficking, and 13 of these constituted a significant network associated with cardiac arteriopathy. Strong signals of selection were observed for CNTNAP2 and RBFOX1, key neurally expressed genes that have been consistently identified as direct FOXP2 targets in multiple studies and that have themselves been associated with neurodevelopmental disorders involving language dysfunction.
Introduction
Humans have adapted in many ways since the split from chimpanzees around six to seven million years ago, and some of these adaptations have involved classic selective sweeps, which leave recognizable signatures in the pattern of genetic variation surrounding the selected locus.1 There has been considerable interest in identifying such sweeps, either by testing individual loci that are considered candidates on the basis of biological insights or by performing genome scans for identifying selected loci in the absence of prior knowledge. One complication is that the signatures of positive selection can also arise under neutral conditions, so findings of apparent selection have substantial but poorly understood false-positive rates.2 As a consequence, evidence of a relevant functional difference between selected and nonselected alleles is necessary for high confidence in selection, but such functional evidence is seldom available.
One gene that has been extensively investigated, both for genomic patterns indicative of selective sweeps and in functional studies, is forkhead box P2 (FOXP2 [MIM 605317]) (see Fisher and Scharff3 for a review). This gene was originally identified from mutations that led to a dominant Mendelian speech and language disorder in a three-generation family and in an independent chromosomal translocation case.4 Mutations of FOXP2 are rare but have since been identified in several additional families affected by speech and language problems.5–7 After human FOXP2 was discovered, its evolutionary interest was demonstrated in two ways. First, despite the fact that it encodes one of the most highly conserved of all vertebrate proteins (e.g., it is in the top 5% in sequence comparisons of human-rodent orthologs), two amino acid substitutions in the region encoded by exon 7 have been fixed on the human lineage after the split from chimpanzees; this is significantly more than expected by chance. Second, resequencing of the FOXP2 genomic locus in a region adjacent to exon 7 demonstrated a skewed allele frequency spectrum, suggesting that positive selection most likely occurred within the last 200,000 years.8 In subsequent modeling of the human-specific amino acids in mice, alterations in synaptic plasticity and neurite outgrowth9 were shown to be distinct from those observed in loss-of-function mouse models,10,11 supporting the idea that these evolutionary changes might have affected brain development. However, analyses of ancient DNA samples have revealed that the selection detected by the allele-frequency-spectrum tests was not associated with the amino acid changes: the amino acid differences were shared with Neandertals,12 who split from modern humans 300,000–400,000 years ago, and the haplotypes extended across the amino acid changes.13
The simplest interpretation of these findings is that subsequent to the human-chimpanzee split, there have been at least two successive evolutionary events affecting the FOXP2 locus. In this view, the first event—the mutations in exon 7—occurred more than ∼400,000 years ago, prior to the human-Neandertal split, and impacted FOXP2 function. The second event, beginning within the last 200,000 years, did not involve further FOXP2 amino acid changes (because the Neandertal and human FOXP2 are identical) but might have instead affected FOXP2 noncoding sequences relevant for its expression and/or splicing, such as the recently described intronic variation that affects a binding site of pou domain, class 3, transcription factor 2 (POU3F2 [MIM 600494]).14 These types of cis regulatory changes could, for example, have altered regulation of FOXP2 in a cell type in which it was already expressed or yielded expression in novel cell types or at developmental time points when it was previously absent.
FOXP2 is a transcription factor, which directly binds to DNA and is likely to regulate hundreds of target genes.3 In the present study, we hypothesized that the selective sweep at FOXP2 within the last 200,000 years might have been followed by positive selection at some of these directly regulated targets. The rationale behind this hypothesis is that FOXP2 function or expression changes that spread through a population as a result of positive selection might have exposed its downstream networks to altered functional landscapes (e.g., different cellular contexts or developmental time points) and thereby subjected these targets to novel selective pressures.
We developed a pipeline to search for such a pattern of positive selection downstream of FOXP2 by focusing on the best candidate-gene targets identified by previous chromatin-immunoprecipitation (ChIP) genomic screens (ChIP-chip screens). We have previously calculated neutrality statistics in 10 kb windows across the genome from whole-genome sequence data in 179 individuals from three continental regions.15 These statistics can be used for assessing the evidence of positive selection at any locus or group of loci. To do this in a robust fashion, we developed an algorithm that, for any given gene list of interest, (1) generates unmatched and matched lists (n = 1,000) of control genes from the Ensembl database, (2) collates summary statistics for positive selection from the 1000 Genomes data, (3) determines whether or not these summary statistics are significantly different between the target genes and controls, and (4) identifies outliers from the gene list as specific candidates for signals of positive selection. We applied this pipeline to each of the three sets of putative FOXP2 ChIP targets11,16,17 in each population.
Material and Methods
Data Sets
We calculated genome-wide statistics informative about selection from low-coverage sequence data in 179 individuals from the pilot phase of the 1000 Genomes Project: 60 Utah residents with ancestry from northern and western Europe from the CEPH collection (CEU), 30 Han Chinese from Beijing (CHB), 30 Japanese in Tokyo, Japan (JPT; combined with CHB as CHB + JPT), and 59 Yoruba from Ibadan, Nigeria (YRI).15 These statistics were based on 10 kb windows and incorporated Tajima's D,18 Fay and Wu's H,19 and Nielsen et al.'s composite likelihood ratio (CLR);20 as before, the p values from the individual tests were also summarized as a combined p value15 with Fisher’s method for combining probabilities.21
The gene sets used in the analyses were extracted from the Ensembl Archives database (Ensembl 54: NCBI Genome browser build 36), which contains 21,416 protein-coding genes. Removing X chromosome, Y chromosome, and mitochondrial genes and those for which there was no recombination data gave a list of 18,486 genes from which the target and control sets were selected.
Three sets of FOXP2 target genes were identified from published sources11,16,17 and used as input data (Figure S1, available online). They had been obtained by ChIP-chip screens in a human neuroblastoma (SH-SY5Y) cell line,17 embryonic mouse brain,11 and human fetal brain.16 The initial ChIP-chip efforts for isolating FOXP2 targets involved partial genomic screens across ∼5,000 well-characterized promoters in human fetal brain tissue16 and in a human neuronal cell line.17 In each case, the authors reported ∼300 putative targets enriched by FOXP2 ChIP, and there was significant overlap between these lists, despite the use of distinct tissues and different FOXP2 antibodies (Figure S1). Recently, a systematic large-scale screen of mouse embryonic brain tissue was carried out; it coupled FOXP2 ChIP to high-density oligonucleotide arrays spanning >17,000 promoters11 and has been the most comprehensive screen thus far for direct targets of this transcription factor. Notably, the study design (which included a null mouse as a control) allowed for more robust identification of targets by using rigorous false-discovery rates (FDRs) and yielded a shortlist of 264 high-confidence targets, as well as a longer list of 1,164 candidate targets at a lower stringency.
Ensembl gene IDs were obtained for these gene sets and used as input files. Genes with no Ensembl ID were excluded. A total of 275/302 FOXP2 targets from the neuronal cell, 263/367 targets from the human fetal brain, and 207/264 high-confidence genes from the embryonic mouse brain were used. The mouse brain target set also excluded 28 genes with no human orthologs and 10 with two or more human-specific paralogs. One study16 also identified targets in lung tissue, but these were not used. CNTNAP2 (MIM 604569), a FOXP2 target implicated in speech and language impairment and identified in another ChIP study,22 was added to the target lists for human neuronal cells and the embryonic mouse brain because it has been clearly validated in both model systems.
Of the 664 FOXP2 targets that were in our gene lists, none were commonly identified by all three studies. This might be partly explained by the fact that the earlier studies produced low-stringency sets of ∼300 genes from limited screens of defined sections of 5,000 promoters, whereas the high-confidence gene set from the embryonic mouse brain came from a much more comprehensive screen (Figure S1). In addition, even when the same gene is commonly represented on screening arrays of different studies, the different arrays used do not always survey equivalent regions of that gene, which means that a true binding event identified in one study might still be spuriously missed in another. Here, it is also important to note that ChIP screening studies are quantitative experiments, in which it is necessary to apply some level of threshold to select for fragments of DNA that are most likely to be bound by the transcription factor of interest. The two earlier FOXP2 ChIP studies might have had higher false-positive and false-negative rates than more recent efforts, but they nevertheless uncovered a substantial number of real binding events that have biological validity. Moreover, it is worth emphasizing again the use of distinct cell types and species in the various studies. Finally, given the use of large fragments on the arrays of the early FOXP2 ChIP studies (as opposed to tiled oligonucleotides in the more recent work), we often lack a clear specification of where FOXP2 binds for the targets from those earlier studies.
Strategy
The analysis pipeline is described in Figure S2. For each of the three sets of FOXP2 target genes, a matched list of control genes was generated from the Ensembl Archives database (Ensembl 54: NCBI Genome browser build 36). FOXP2 targets were matched with controls in the database for gene length (the longest Ensembl transcript was taken as representative of gene length), GC content, and recombination rate (averaged across gene length) estimated from phased haplotypes in the HapMap phase II data (The International HapMap Consortium 2007; June 25, 2008, release). This was done by the calculation of Euclidean distances between each target gene and the remaining protein-coding genes in the Ensembl gene database on the basis of gene length, GC content, and average recombination rate and by the generation of a list of the 1,000 most closely matched genes, i.e., genes that exhibited the shortest distance from the targets. Subsequently, for each target set, 1,000 control lists (each containing one closely matched gene drawn from the 1,000 closest matches for each gene in the target set) were generated (Figure S2A). The matched neighbor for each target gene was picked randomly in these 1,000 control lists for the avoidance of systematic error or overrepresentation of any particular gene in the control sets. This strategy was compared with a ranking strategy in which all protein-coding genes in Ensembl 54 were ranked separately by gene size, GC content, and average recombination rate, and an average rank for each gene was obtained. For each gene in the target list, 500 genes above and 500 below its average rank were selected as its 1,000 most closely matched genes and were used in subsequent analyses.
To test whether FOXP2 target genes show evidence of positive selection as a group, we carried out statistical assessments by using the Mann-Whitney U test (on the basis of average ranking of the test statistics) and permutation tests to see whether Tajima's D, Fay and Wu's H, and Nielsen et al.'s CLR values were significantly different between the set of FOXP2 target genes and the set of control genes. For the Mann-Whitney U comparisons, each target set was compared with 1,000 sets of control genes. Each of these control sets contained one randomly selected matched Euclidean “neighbor” of each FOXP2 target gene. If the FOXP2 targets were under positive selection in any of the three populations, the expectation was that the mean rank of targets would be significantly higher for the CLR and significantly lower for Tajima’s D and Fay and Wu’s H.
Additional support was provided by permutation analyses carried out on both a single unique list of closely matched “neighbors” generated from the 1,000 control lists and an unmatched control list that included 18,486 Ensembl 54 genes minus the target set (Figure S2B). This was a sampled randomization test in which we computed our statistic, determined a distribution of this statistic on the basis of 10,000 permutations, and decided on the significance of our statistic.23
To further gauge the strength of our conclusions about positive selection in FOXP2 targets, we looked at the distribution of the enriched genes in the ∼5,000 regions identified by genomic scans as positively selected candidates in the 1000 Genomes Pilot 1 data.15 In order to reduce random background noise, we selected these regions by a conservative criterion that included only those with at least two significant ∼10 kb windows within a 150 kb region as outliers. Simulations show that such significant clusters are indicative of positive selection.24 The significance threshold was based upon the combined p values estimated from the three neutrality tests corrected for the 5% FDR in each population (cutoff p values = 0.00292 for CEU, 0.00262 for YRI, and 0.00216 for CHB + JPT). We compared 150 kb regions encompassing each gene and treated regions with at least two significant 10 kb windows as indicative of positive selection for genes lying within this interval. To adjust for size, we sliced genes larger than 150 kb into 150 kb regions and extended those that were smaller than 150 kb by an equal distance upstream and downstream. The number of FOXP2 target genes identified as significant outliers with the use of this conservative criterion in each population was also compared to the mean number of outliers identified in 1,000 matched sets of control genes (Figure S3). Significant differences in the number of outliers discovered from a matched data set of similar size were estimated with Fisher’s exact test for count data in R.
Sequence coverage (per base per gene per individual) was compared and found to be the same (2×–6×) across the FOXP2 targets and controls across all populations (two-sample Kolmogorov-Smirnov test, p > 0.0925). To exclude a bias from sequencing errors on site-frequency-based tests of selection, we compared our Tajima’s D statistic with the Y test specifically designed for low-coverage data25 that are expected to contain many artifacts. We generated test statistics for 10 kb nonoverlapping windows for chromosome 11, and the fact that we observed a significant positive correlation (r2 = 0.94, p value < 0.0001) between the Y and our Tajima's D estimates across all populations (Table S1) indicates that the diversity estimators were not biased as a result of sequencing errors.
Implementation
The strategy was implemented via a pipeline written with perl and R commands (available upon request) that were executed on the Wellcome Trust Sanger Institute “computer farm” with the use of the Load Sharing Facility job scheduler and the lustre file system designed to cope with the high throughput. The farm consisted of a mixture of Intel 2 × 1.6–3.0 Ghz dual or quad core Xeon EMT64 processors with 4–512 GB of memory and a 64 bit X86_64 linux operating system.
Ingenuity Pathway Analysis
Ensembl gene identifiers for selected genes were uploaded to Ingenuity Pathway Analysis (IPA). Networks of these selected genes were then algorithmically generated on the basis of their connectivity in the Ingenuity Knowledge Base (IKB), which includes manually curated data from human, mouse, and rat. The core analyses tabulate the significance of the association between the data set and the pathway by (1) estimating a ratio of the number of data-set genes meeting the expression-value cutoff and mapping to the pathway to the total number of molecules present in the pathway and (2) using Fisher’s exact test to calculate a p value determining the probability that the association between the genes in the data set and the pathway is explained by chance alone. The network functional analysis identified the biological functions and/or diseases that were most significant to the genes in the network.
Results
Establishment of a Pipeline for Detecting Positive Selection in a Chosen Set of Genes
We first tested our algorithm by using lists of known positively selected and nonselected genes identified from reports in the literature.2,15,26 For lists of positive control, we used data sets containing 166, 67, or 31 genes located in genomic regions identified as being under positive selection in ≥7, ≥8, or 9 genome-wide scans, respectively, summarized in Akey,2 and a smaller set of 11 genes shared between all the studies mentioned above (Figure 1 and Table S2A). For negative controls, we excluded 2,601 protein-coding genes for which we found any report of positive selection in the literature and randomly chose sets of equivalent size from the remaining Ensembl 54 gene set.
Figure 1.
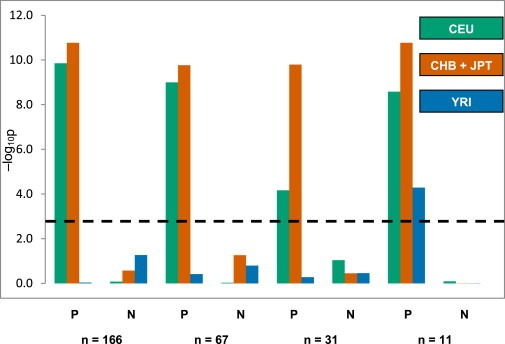
Selection Signals in Gene Sets of Positive and Negative Controls
The negative log of combined p values for the matched permutation tests is shown along the y axis. Known positively selected gene sets (P) (n = 166, 67, or 31) lie in regions identified as being under selection in ≥7, ≥8, or 9 genomic scans2 or in a smaller data set of 11 genes shared among ≥7 genomic scans,2 a composite of multiple signals,22 and the 1000 Genomes Project.15 Gene lists of negative controls (N) were generated after exclusion of reported positively selected protein-coding genes from the Ensembl database. The dashed horizontal line depicts the threshold for multiple comparisons after application of the Bonferroni correction.
The results of the Mann-Whitney U and permutation tests were in broad agreement (Figure 1 and Table S2) for these control gene sets. For the known positive-control gene sets of ≥31 genes, we observed significant evidence of selection in CEU and CHB + JPT, but not in YRI, probably reflecting the larger number of studies of positive selection outside Africa and enrichment of non-African targets. With the smallest set (11 genes), we obtained significant combined p values in all three populations. Gene sets of negative controls did not show any evidence of positive selection (Figure 1 and Table S2B). We therefore conclude that our algorithm successfully distinguishes between positively selected and nonselected groups of genes.
We estimated the proportion of genes that need to be under selection in a given target gene list in order for the target set to be seen as significantly different from the control set. Frequency-spectrum-based tests had identified a list of 199 genes that are under selection in all four populations (CEU, CHB, JPT, and YRI) sequenced at low coverage by the 1000 Genomes Project.15 Gradual removal and replacement of these genes with an equal proportion of negative controls showed that the method is sensitive if at least 10% of the genes in a list under investigation are under selection (Figure S3). The overall size of the list was then reduced. The pipeline was able to detect a selection signal in all populations in a list containing at least 50 genes, 10% of which were known positively selected genes (Figure S4).
Testing Lists of FOXP2 Target Genes for Evidence of Positive Selection
We then applied the test to the three lists of FOXP2 targets from the three separate ChIP-chip screens involving different platforms and neural tissues.11,16,17 In two out of the three lists, evidence of positive selection was found in CEU, but not in the other populations (Figure 2 and Table S3). The two gene sets showing evidence of positive selection were based on studies of fetal and embryonic brain tissue in humans and mice, respectively.11,16 Examination of the test results in more detail revealed that the support for selection in CEU came both from individual tests (in mouse brain: Tajima’s D in the Mann-Whitney U test and Fay and Wu’s H in the matched permutation test; in human brain: Tajima’s D and Fay and Wu’s H in the Mann-Whitney U test, Fay and Wu’s H in the matched permutation test, and CLR and Fay and Wu’s H in the unmatched permutation test) and from the combined p values (Table S3). In addition, the Mann-Whitney U tests showed some evidence of selection in YRI, particularly in the neuronal cell line, but the combined p value fell below the threshold for significance after multiple comparisons in the unmatched permutation results (Figure 2 and Table S3). Matching target genes by ranks gave similar results (Figure S5).
Figure 2.
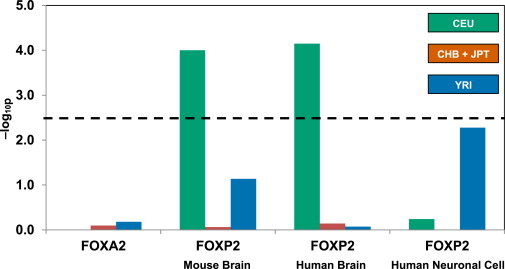
Evidence of Positive Selection in FOXP2 Targets from Three Separate ChIP-chip Screens
FOXP2 targets identified by ChIP in mouse and human brain show evidence of positive selection in CEU. The dashed horizontal line depicts the threshold of the –log10p value for multiple comparisons after application of the Bonferroni correction. FOXA2 targets identified by ChIP-Seq do not show enrichment.
In a test variation designed to consider a region of fixed size larger than individual genes, we compared the number of 150 kb regions with at least two significant ∼10 kb windows in FOXP2 targets with the number of such regions in 1,000 control lists (Figure S6). FOXP2 targets identified in embryonic mouse brain were under positive selection in CEU (p = 0.0341). However, the enrichment was not significant after correction for multiple comparisons.
FOXA2, another member of the forkhead class of DNA-binding proteins, was used as an additional negative-control transcription factor. It was selected from a range of transcription factors27 because it has not been identified as being under positive selection in any genomic selection scans2 and its number of target genes is similar to that of FOXP2. Compared with matched controls, FOXA2 targets identified by the ENCODE project28 showed no evidence of positive selection (Figure 2).
Identification of Individual Genes Showing Evidence of Positive Selection
Using the combined p values calculated from three neutrality tests corrected for 5% FDR (e.g., p = 0.00292 for CEU), we identified 67 outlier genes in embryonic mouse brain and 73 each in human fetal brain and neuronal cell lines in CEU. CNTNAP2, a key FOXP2 target that was identified in a separate ChIP study22 and added to the target lists for human neuronal cells and mouse brain, was also among these significant outliers. Few of these genes were shared between populations. The majority were specific to CEU, in keeping with the strong signal of selection only in this population (Figure S7).
A total of 139 FOXP2 target genes in human fetal and mouse embryonic brain stood out as outliers with strong signals of positive selection in CEU (Table S4). Thus, in addition to statistical support based on the permutation and Mann-Whitney U tests, there also appears to be enrichment of positive selection in CEU by this test. On closer inspection, only two of these targets—RNA binding protein, fox-1 homolog (RBFOX1 [MIM 605104]) and paraoxonase 2 (PON2 [MIM 602447])—were shared between the two ChIP-chip screens (see Discussion). Genes that were under positive selection in all four HapMap populations included CNTNAP2 and another 18 FOXP2 targets identified in the mouse and human brains (Table S4).
We also looked at whether the signature of selection in these 139 selected target genes was specifically confined to likely FOXP2 binding sites on the basis of consensus binding motifs. We identified FOXP2 (CAAATT), FOX superfamily consensus (TRTTKRY), and FOXP1 consensus (TATTTRT) binding motifs within ± 10 kb of the transcription start site (GENCODE v.2b) of 138/139 selected targets and observed variants in the FOXP2 binding motifs of 71/139 targets in CEU. Compared with the expected one-third distribution based on Fisher’s exact test for count data, a significant enrichment of variation in FOXP2 binding motifs was found in CEU (p value = 0.002). Fifty-four variants had a greater frequency in CEU than in YRI and CHB + JPT, and in 14/54 instances, the allelic frequency in CEU was >10% higher than that in YRI and CHB + JPT, indicating that these variants could possibly be responsible for the selection signal observed in this population (Table 1).
Table 1.
Population Frequencies of Variants in FOXP2 Binding Sites of Genes Selected in the CEU Population
| MIM Number | Gene | TSS | Chr | Variant Position | Reference Allele | Alternate Allele | Ancestral Allele |
Population Frequency (Coverage per Individual) |
||
|---|---|---|---|---|---|---|---|---|---|---|
| CEU | CHB + JPT | YRI | ||||||||
| 604831 | EVC | 5,763,825 | 4 | 5,766,844 | G | C | C | 0.23 (5×) | 0.11 (3×) | 0.10 (3×) |
| 604831 | EVC | 5,763,825 | 4 | 5,769,597 | G | C | C | 0.23 (5×) | 0.11 (3×) | 0.10 (3×) |
| 605035 | WASF1 | 110,536,424 | 6 | 110,531,034 | T | C | T | 0.69 (5×) | 0.56 (2×) | 0.00 (3×) |
| None | TP53TG1 | 86,812,449 | 7 | 86,802,732 | A | C | C | 0.98 (5×) | 0.00 (3×) | 0.80 (3×) |
| 613883 | KEL | 142,348,325 | 7 | 142,353,221 | T | C | C | 0.91 (5×) | 0.00 (3×) | 0.25 (4×) |
| 604569 | CNTNAP2 | 145,444,902 | 7 | 145,441,261 | T | C | T | 0.12 (3×) | 0.00 (2×) | 0.00 (1×) |
| 122560 | CRH | 67,251,191 | 8 | 67,256,780 | G | C | C | 0.93 (5×) | 0.00 (2×) | 0.33 (3×) |
| 150100 | LDHB | 21,679,543 | 12 | 21,672,448 | A | G | A | 0.28 (5×) | 0.07 (3×) | 0.06 (3×) |
| 607653 | RHOJ | 62,740,898 | 14 | 62,735,721 | A | C | A | 0.20 (4×) | 0.00 (2×) | 0.00 (2×) |
| 607781 | PAQR5 | 67,393,796 | 15 | 67,385,180 | T | A | T | 0.68 (5×) | 0.53 (3×) | 0.48 (3×) |
| 601574 | TAF15 | 31,160,596 | 17 | 31,154,164 | T | C | C | 0.87 (4×) | 0.64 (2×) | 0.59 (2×) |
| 606411 | SLC13A3 | 44,619,870 | 20 | 44,614,848 | A | G | G | 0.18 (7×) | 0.04 (4×) | 0.05 (4×) |
| 606411 | SLC13A3 | 44,647,744 | 20 | 44,653,243 | C | T | C | 0.13 (4×) | 0.00 (2×) | 0.00 (2×) |
| 146770 | IGLL1 | 22,245,312 | 22 | 22,247,949 | T | C | - | 0.97 (5×) | 0.00 (4×) | 0.70 (3×) |
Abbreviations are as follows: TSS, transcription start site; and Chr, chromosome.
Properties of Selected FOXP2 Target Genes
The selected CEU FOXP2 target genes are significantly enriched in nervous system development and function (such as cell signaling), ion-channel activity, and biological processes associated with intracellular protein transport and catabolism. To further categorize the selected CEU FOXP2 target genes in comparison with the remaining targets, we used the Database for Annotation, Visualization, and Integrated Discovery (DAVID v.6.7) but found no additional significant enrichment of any Gene Ontology (GO) term associated with any biological process, cellular compartment, or molecular function.
In another approach to understanding the biological function of selected genes in CEU, we analyzed them by using IPA (Ingenuity Systems, Redwood City, CA, USA). These genes were significantly enriched with molecular functions associated with cell-to-cell signaling and interaction (p = 1.82 × 10⁻⁶). Of the 73 human brain targets showing evidence of selection, 72 were designated as network eligible and 69 were eligible for inclusion in functional pathways, indicating that they had at least one functional or disease association in the IKB. The bulk of these were represented in networks associated with cellular movement, hematological system development, and function and immune cell trafficking (35 genes). Of the 68 mouse brain targets showing evidence of selection, one could not be mapped to human reference build GRCh37 (UCSC Genome Browser hg19), on which the IKB is based. Of the remaining targets, 65 were network eligible and 55 were eligible for inclusion in functional pathways, and the bulk were represented by four networks associated with DNA replication, recombination, and repair (20 genes), cell-to-cell signaling and interaction (18 genes), nervous system development (14 genes), and cardiovascular system development and function (12 genes). Intriguingly, for both CEU-enriched data sets, the only significant pathological network (Figure 3) consisted of 13 genes associated with cardiac arteriopathy (p = 0.009 and 0.004 for the human and mouse brain targets, respectively). RBFOX1 and CNTNAP2 are both part of this network (Figure S8), and both have been linked to brain development and function.
Figure 3.
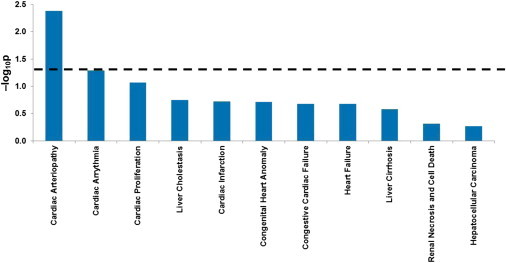
IPA of FOXP2 Targets Identified as Significant Outliers in CEU Shows Significant Association with Cardiac Arteriopathy
Discussion
We set out to explore whether recent positive selection on FOXP2 was followed by selection in any of the known target genes that it directly regulates.
We developed a general methodology to systematically scan gene lists for evidence of positive selection acting on a gene set as a whole. A key part of this method is to match candidate genes with controls for gene length, GC content, and recombination rate and compare three summary statistics—Tajima’s D,18 Fay and Wu’s H,19 and a CLR20—for each nonoverlapping ∼10 kb window across the genome by using the low-coverage resequencing data generated by the 1000 Genomes Project.15 The procedure was validated with the use of test sets of known positively selected genes identified by genome-wide scans for selection.2,15,26 It has been shown that regions identified in genotype-based (LD-based) genome scans for positive selection are also picked up by frequency-spectrum-based tests on resequencing data,24 so we would expect these to act as useful positive controls in our analysis. Although the majority of these genes do not have independent functional evidence of selection, these reduced sets represent the best candidates available for positive selection. In all, we conclude that our method is robust in distinguishing between selected and nonselected gene sets as small as 11.
Levels of overlap among the top FOXP2 targets reported by all three ChIP-chip screens were rather low (Figure S1). No targets were shared across all three gene lists used in our study, and only a minority of targets were common to two of the prior reports. The limited overlap is partly attributable to methodological and tissue differences in the three ChIP-chip studies (see Material and Methods for a more detailed explanation). The earlier surveys16,17 used microarrays containing a relatively small subset of known promoter regions, whereas Vernes et al.11 employed a much more comprehensive screen with tiled oligonucleotides across the majority of promoters of the genome. Thus, a large number of the genes and regulatory regions queried by the Vernes et al. study11 had not been examined in the earlier studies. As well as performing a screen with a larger scope, the latter investigation was able to employ more rigorous controls for assessing significance, yielding a high confidence list with a particularly low FDR (although it is clear from validation experiments that the earlier studies did include a substantial number of true positive findings). Moreover, differences in the top putative targets highlighted in each set of experiments might have resulted from differences in biological material: Vernes et al.16 used human neuron-like cell lines, Spiteri et al.15 assessed human fetal brain tissue, and Vernes et al.11 screened mouse embryonic brain. ChIP followed by next-generation sequencing (ChIP-seq) technology29 in multiple different neural tissue samples might provide a more robust set of FOXP2 targets for re-evaluation.
Overall, there is strong evidence of selection of FOXP2 targets in CEU compared with YRI and CHB + JPT. In CEU, with a matched and unmatched data set, we were able to consistently pick up significant differences between controls and human fetal brain FOXP2 targets by using a stringent Bonferroni correction cutoff. If selection had occurred in all populations and we were able to detect it in CEU, we should also have been able to detect it in Africans (YRI) because of their larger effective population size. The fact that we did not detect a signal in Africans indicates that selection was regionally specific and, among the populations examined, acted only in the Europeans (CEU). Part of the explanation might be the higher quality of the CEU data, but we did not observe any differences in the coverage between the targets and their matched controls.
Significant differences between controls and FOXP2 targets identified in mouse brain tissue were also observed, but these were less consistent. Overall, no significant differences were observed between controls and FOXP2 targets identified in the neuronal cell line in any of the populations, although there was weak evidence of selection in YRI according to the comparisons with matched controls. This cell line was established from a metastatic neuroblastoma from a 4-year-old girl whose ethnicity was unknown.30
The strongest support was for human fetal brain FOXP2 targets in CEU (Figure 2). These results were also reinforced by the presence of more outlier FOXP2 targets in CEU (n = 110) compared to CHB + JPT (n = 40) and YRI (n = 79) and by the identification of variants present in FOXP2 binding sites of 71 genes selected in CEU. Fifty-four of these variants were present at a higher frequency in CEU, and 14 had a >10% higher frequency in this population (Table 1), making them prime candidates for functional studies. However, it must be emphasized that our hypothesis of selection acting on FOXP2 targets does not assume that this must have happened specifically at the genomic sites where FOXP2 directly binds and only involved changes to DNA sequences within those binding sites. Rather, we are testing the more general idea that, after the selective sweep at FOXP2, some of the genes in networks downstream of FOXP2 became subject to further recent selection, which might have involved any parts of those genes.
To understand what this means in biological terms, we examined the brain outlier FOXP2 targets (from the data sets for the human fetal brain and mouse embryonic brain) in CEU. The majority of selected FOXP2 targets (∼52%) were specific to this population group, and few were shared between two or among all three populations, suggesting that the signal stems primarily from recent local adaptation after the divergence of the populations. CNTNAP2, a FOXP2 target that has itself been implicated in speech and language impairment and development,22,31 was the one target that also stood out as a significant outlier in all populations (Figure S9). FOXP2 binds to a regulatory sequence in intron 1 of CNTNAP2 and decreases its expression.22 Variants in this gene have also been implicated in several neurological phenotypes, including autism spectrum disorders,32,33 but the fact that the selection signal overlies a substantial portion of this large gene makes it difficult to assess the critical functional variant responsible for the selection signal. Genes showing evidence of selection in all populations are of particular interest for they provide insights into the selection pressures that have acted on all populations, and because these have been replicated in different sequence data sets, the signals are more likely to be reliable.
PON2 and RBFOX1 are two other FOXP2 targets, identified in multiple experiments and tissues (mouse and human brains), that show evidence of selection. RBFOX1 and CNTNAP2 are also among the FOXP2 target genes that belong to an IPA network involved in cardiac arteriopathy (Figure 3 and Figure S5). PON2 encodes a high-density-lipoprotein-related glycoprotein with multienzymatic and antioxidant properties.34 Variants in this gene have also been associated with the severity of coronary artery disease.35,36 RBFOX1 is predominantly expressed in muscle and brain tissue and regulates tissue-specific splicing.37 Like CNTNAP2, RBFOX1 has also been implicated in autism spectrum disorders,38 and a selection signal is apparent in all populations examined.
Genes showing evidence of selection in single populations should be interpreted with more caution because they could be false positives or show signals resembling selection as a result of genetic drift. Nevertheless, there are some interesting targets that appear to be selected solely in CEU. In this population, 65% of the selected FOXP2 targets were identified in the human and mouse brain studies. Targets that are of interest from an evolutionary perspective include BRCA1-associated RING domain 1 (BARD1 [MIM 601593]), which plays a role in apoptosis; epiphycan (EPYC [MIM 601657]), which is involved in bone and cartilage formation;39 cation channel, sperm-associated 3 (CATSPER3 [MIM 609120]), encoding a voltage-gated calcium-channel protein that is essential for successful fertilization;40 gametogenetin (GGN [MIM 609966]), which plays a role in spermatogenesis;41 and polio virus receptor (PVR [MIM 173850]) (Figure 4). The selection signal around GGN is sustained over several 10 kb windows that also encompass nearby genes SPRED3 (MIM 609293) and FAM98C, which could also be the target of selection. The dN/dS ratios for GGN comparisons between humans and chimpanzees and humans and orangutans are 1.43 and 1.32, respectively, and there is an unusual cluster of nonsynonymous coding mutations in GGN (Figure 4A); one such mutation (rs11083455) has a high frequency (0.91) in Europeans.
Figure 4.
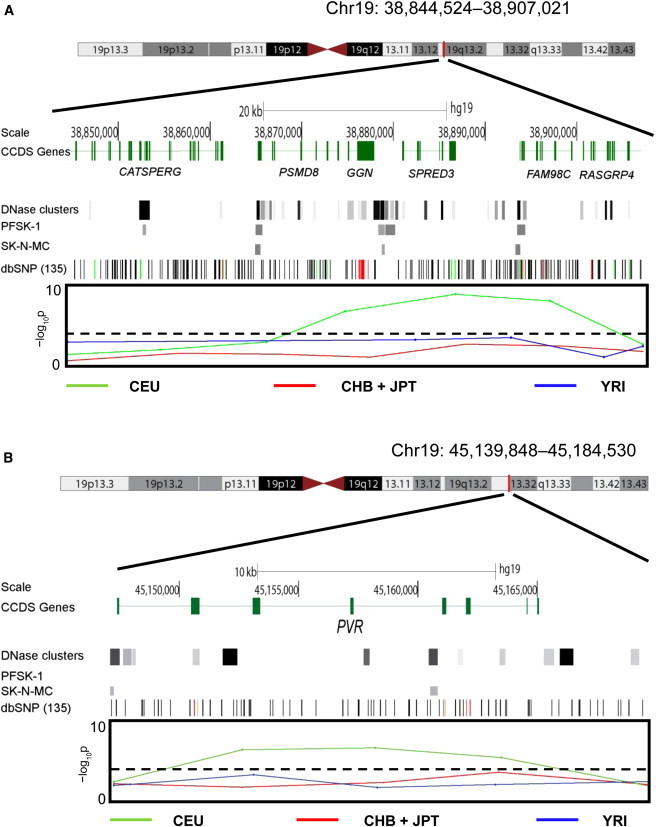
Genes under Selection in CEU
(A) A chromosome 19 gene-rich region that harbors GGN. The signal is sustained over several 10 kb windows that also encompass nearby genes SPRED3 and FAM98C, which could also be the target of selection.
(B) Another chromosome 19 region that harbors PVR. In both parts, tracks showing DNase clusters and FOXP2 binding sites determined by ChIP-Seq (ENCODE data from the HudsonAlpha Institute for Biotechnology) in two neural cell lines (PFSK-1 and SK-N-MC) provide additional support for the direct FOXP2 binding (bands) within this region. These represent enriched regions of high read density relative to total input chromatin control reads in the ChIP experiment. FOXP2 binding sites are observed in both cell lines in (A) but only in SK-N-MC in (B). The dbSNP (135) track shows variants identified in this region. The coding nonsynonymous and essential-splice-site variants are represented by vertical red lines, and coding synonymous variants are represented by vertical green lines. The –log10p of the combined p value (boxed area) was generated from the separate probabilities of Tajima’s D, Fay and Wu’s H, and CLR. The threshold represented by the dashed line incorporates the 5% FDR for each population. Peaks above the threshold in the graph represent regions under positive selection in CEU.
One advantage of this methodology is that it can be applied to any chosen set of genes or protein-interaction networks without any a priori hypothesis about the cause of selection. Kim et al.42 suggest that protein networks intuitively hold much more evolutionary information than do lists derived from GO and genome-wide association studies, which do not distinguish between constrained core and peripheral proteins that are potentially under positive selection. Such unbiased comparisons will identify genes that might be relevant for evolutionary adaptations and narrow down candidates for functional follow-up.
The availability of large-scale whole-genome human population sequences through the efforts of projects such as the 1000 Genomes Project15 will make this a practical approach for high-throughput screening of selection signals associated with local adaptations in these populations, for which the present FOXP2 study has provided a development and test opportunity. We found strong evidence of selection for some FOXP2 targets in CEU for some aspects of development, cell signaling, reproduction, or immunity. The selected genes often have multiple functions in both neural and nonneural tissues.
Acknowledgments
We thank Daniel MacArthur and Eleftheria Zeggini for helpful discussions, G. Achaz for providing the code for the Y test statistic, and two anonymous reviewers for useful comments. This work was supported by the Wellcome Trust (098051) and the Max Planck Society.
Supplemental Data
Web Resources
The URLs for data presented herein are as follows:
1000 Genomes Project, http://www.1000genomes.org
DAVID Bioinformatics Resources 6.7, http://david.abcc.ncifcrf.gov/
Ensembl, http://www.ensembl.org/index.html
HUGO Gene Nomenclature Committee, http://www.genenames.org/
Ingenuity Systems Ingenuity Pathways Analysis (IPA), http://www.ingenuity.com/products/ipa
International HapMap Project, http://hapmap.ncbi.nlm.nih.gov/
Online Mendelian Inheritance in Man (OMIM), http://omim.org
UCSC Human Genome Browser, http://genome.ucsc.edu/cgi-bin/hgGateway
References
- 1.Sabeti P.C., Schaffner S.F., Fry B., Lohmueller J., Varilly P., Shamovsky O., Palma A., Mikkelsen T.S., Altshuler D., Lander E.S. Positive natural selection in the human lineage. Science. 2006;312:1614–1620. doi: 10.1126/science.1124309. [DOI] [PubMed] [Google Scholar]
- 2.Akey J.M. Constructing genomic maps of positive selection in humans: where do we go from here? Genome Res. 2009;19:711–722. doi: 10.1101/gr.086652.108. [DOI] [PMC free article] [PubMed] [Google Scholar]
- 3.Fisher S.E., Scharff C. FOXP2 as a molecular window into speech and language. Trends Genet. 2009;25:166–177. doi: 10.1016/j.tig.2009.03.002. [DOI] [PubMed] [Google Scholar]
- 4.Lai C.S., Fisher S.E., Hurst J.A., Vargha-Khadem F., Monaco A.P. A forkhead-domain gene is mutated in a severe speech and language disorder. Nature. 2001;413:519–523. doi: 10.1038/35097076. [DOI] [PubMed] [Google Scholar]
- 5.MacDermot K.D., Bonora E., Sykes N., Coupe A.-M., Lai C.S.L., Vernes S.C., Vargha-Khadem F., McKenzie F., Smith R.L., Monaco A.P., Fisher S.E. Identification of FOXP2 truncation as a novel cause of developmental speech and language deficits. Am. J. Hum. Genet. 2005;76:1074–1080. doi: 10.1086/430841. [DOI] [PMC free article] [PubMed] [Google Scholar]
- 6.Shriberg L.D., Ballard K.J., Tomblin J.B., Duffy J.R., Odell K.H., Williams C.A. Speech, prosody, and voice characteristics of a mother and daughter with a 7;13 translocation affecting FOXP2. J. Speech Lang. Hear. Res. 2006;49:500–525. doi: 10.1044/1092-4388(2006/038). [DOI] [PubMed] [Google Scholar]
- 7.Zeesman S., Nowaczyk M.J.M., Teshima I., Roberts W., Cardy J.O., Brian J., Senman L., Feuk L., Osborne L.R., Scherer S.W. Speech and language impairment and oromotor dyspraxia due to deletion of 7q31 that involves FOXP2. Am. J. Med. Genet. A. 2006;140:509–514. doi: 10.1002/ajmg.a.31110. [DOI] [PubMed] [Google Scholar]
- 8.Enard W., Przeworski M., Fisher S.E., Lai C.S., Wiebe V., Kitano T., Monaco A.P., Pääbo S. Molecular evolution of FOXP2, a gene involved in speech and language. Nature. 2002;418:869–872. doi: 10.1038/nature01025. [DOI] [PubMed] [Google Scholar]
- 9.Enard W., Gehre S., Hammerschmidt K., Hölter S.M., Blass T., Somel M., Brückner M.K., Schreiweis C., Winter C., Sohr R. A humanized version of Foxp2 affects cortico-basal ganglia circuits in mice. Cell. 2009;137:961–971. doi: 10.1016/j.cell.2009.03.041. [DOI] [PubMed] [Google Scholar]
- 10.Groszer M., Keays D.A., Deacon R.M.J., de Bono J.P., Prasad-Mulcare S., Gaub S., Baum M.G., French C.A., Nicod J., Coventry J.A. Impaired synaptic plasticity and motor learning in mice with a point mutation implicated in human speech deficits. Curr. Biol. 2008;18:354–362. doi: 10.1016/j.cub.2008.01.060. [DOI] [PMC free article] [PubMed] [Google Scholar]
- 11.Vernes S.C., Oliver P.L., Spiteri E., Lockstone H.E., Puliyadi R., Taylor J.M., Ho J., Mombereau C., Brewer A., Lowy E. Foxp2 regulates gene networks implicated in neurite outgrowth in the developing brain. PLoS Genet. 2011;7:e1002145. doi: 10.1371/journal.pgen.1002145. [DOI] [PMC free article] [PubMed] [Google Scholar]
- 12.Krause J., Lalueza-Fox C., Orlando L., Enard W., Green R.E., Burbano H.A., Hublin J.J., Hänni C., Fortea J., de la Rasilla M. The derived FOXP2 variant of modern humans was shared with Neandertals. Curr. Biol. 2007;17:1908–1912. doi: 10.1016/j.cub.2007.10.008. [DOI] [PubMed] [Google Scholar]
- 13.Ptak S.E., Enard W., Wiebe V., Hellmann I., Krause J., Lachmann M., Pääbo S. Linkage disequilibrium extends across putative selected sites in FOXP2. Mol. Biol. Evol. 2009;26:2181–2184. doi: 10.1093/molbev/msp143. [DOI] [PubMed] [Google Scholar]
- 14.Maricic T., Günther V., Georgiev O., Gehre S., Curlin M., Schreiweis C., Naumann R., Burbano H.A., Meyer M., Lalueza-Fox C. A recent evolutionary change affects a regulatory element in the human FOXP2 gene. Mol. Biol. Evol. 2013;30:844–852. doi: 10.1093/molbev/mss271. [DOI] [PubMed] [Google Scholar]
- 15.Abecasis G.R., Altshuler D., Auton A., Brooks L.D., Durbin R.M., Gibbs R.A., Hurles M.E., McVean G.A., 1000 Genomes Project Consortium A map of human genome variation from population-scale sequencing. Nature. 2010;467:1061–1073. doi: 10.1038/nature09534. [DOI] [PMC free article] [PubMed] [Google Scholar]
- 16.Spiteri E., Konopka G., Coppola G., Bomar J., Oldham M., Ou J., Vernes S.C., Fisher S.E., Ren B., Geschwind D.H. Identification of the transcriptional targets of FOXP2, a gene linked to speech and language, in developing human brain. Am. J. Hum. Genet. 2007;81:1144–1157. doi: 10.1086/522237. [DOI] [PMC free article] [PubMed] [Google Scholar]
- 17.Vernes S.C., Spiteri E., Nicod J., Groszer M., Taylor J.M., Davies K.E., Geschwind D.H., Fisher S.E. High-throughput analysis of promoter occupancy reveals direct neural targets of FOXP2, a gene mutated in speech and language disorders. Am. J. Hum. Genet. 2007;81:1232–1250. doi: 10.1086/522238. [DOI] [PMC free article] [PubMed] [Google Scholar]
- 18.Tajima F. Statistical method for testing the neutral mutation hypothesis by DNA polymorphism. Genetics. 1989;123:585–595. doi: 10.1093/genetics/123.3.585. [DOI] [PMC free article] [PubMed] [Google Scholar]
- 19.Fay J.C., Wu C.-I. Hitchhiking under positive Darwinian selection. Genetics. 2000;155:1405–1413. doi: 10.1093/genetics/155.3.1405. [DOI] [PMC free article] [PubMed] [Google Scholar]
- 20.Nielsen R., Williamson S., Kim Y., Hubisz M.J., Clark A.G., Bustamante C. Genomic scans for selective sweeps using SNP data. Genome Res. 2005;15:1566–1575. doi: 10.1101/gr.4252305. [DOI] [PMC free article] [PubMed] [Google Scholar]
- 21.Fisher R.A. Oliver and Boyd; Edinburgh: 1954. Statistical Methods for Research Workers. [Google Scholar]
- 22.Vernes S.C., Newbury D.F., Abrahams B.S., Winchester L., Nicod J., Groszer M., Alarcón M., Oliver P.L., Davies K.E., Geschwind D.H. A functional genetic link between distinct developmental language disorders. N. Engl. J. Med. 2008;359:2337–2345. doi: 10.1056/NEJMoa0802828. [DOI] [PMC free article] [PubMed] [Google Scholar]
- 23.Sokal R.R., Rohlf F.J. W. H. Freeman and Company; New York: 2012. Biometry. [Google Scholar]
- 24.Hu M., Ayub Q., Guerra-Assunção J.A., Long Q., Ning Z., Huang N., Romero I.G., Mamanova L., Akan P., Liu X. Exploration of signals of positive selection derived from genotype-based human genome scans using re-sequencing data. Hum. Genet. 2012;131:665–674. doi: 10.1007/s00439-011-1111-9. [DOI] [PMC free article] [PubMed] [Google Scholar]
- 25.Achaz G. Testing for neutrality in samples with sequencing errors. Genetics. 2008;179:1409–1424. doi: 10.1534/genetics.107.082198. [DOI] [PMC free article] [PubMed] [Google Scholar]
- 26.Grossman S.R., Shlyakhter I., Karlsson E.K., Byrne E.H., Morales S., Frieden G., Hostetter E., Angelino E., Garber M., Zuk O. A composite of multiple signals distinguishes causal variants in regions of positive selection. Science. 2010;327:883–886. doi: 10.1126/science.1183863. [DOI] [PubMed] [Google Scholar]
- 27.Vaquerizas J.M., Kummerfeld S.K., Teichmann S.A., Luscombe N.M. A census of human transcription factors: function, expression and evolution. Nat. Rev. Genet. 2009;10:252–263. doi: 10.1038/nrg2538. [DOI] [PubMed] [Google Scholar]
- 28.Gerstein M.B., Kundaje A., Hariharan M., Landt S.G., Yan K.-K., Cheng C., Mu X.J., Khurana E., Rozowsky J., Alexander R. Architecture of the human regulatory network derived from ENCODE data. Nature. 2012;489:91–100. doi: 10.1038/nature11245. [DOI] [PMC free article] [PubMed] [Google Scholar]
- 29.Park P.J. ChIP-seq: advantages and challenges of a maturing technology. Nat. Rev. Genet. 2009;10:669–680. doi: 10.1038/nrg2641. [DOI] [PMC free article] [PubMed] [Google Scholar]
- 30.Biedler J.L., Helson L., Spengler B.A. Morphology and growth, tumorigenicity, and cytogenetics of human neuroblastoma cells in continuous culture. Cancer Res. 1973;33:2643–2652. [PubMed] [Google Scholar]
- 31.Whitehouse A.J.O., Bishop D.V.M., Ang Q.W., Pennell C.E., Fisher S.E. CNTNAP2 variants affect early language development in the general population. Genes Brain Behav. 2011;10:451–456. doi: 10.1111/j.1601-183X.2011.00684.x. [DOI] [PMC free article] [PubMed] [Google Scholar]
- 32.Peñagarikano O., Abrahams B.S., Herman E.I., Winden K.D., Gdalyahu A., Dong H., Sonnenblick L.I., Gruver R., Almajano J., Bragin A. Absence of CNTNAP2 leads to epilepsy, neuronal migration abnormalities, and core autism-related deficits. Cell. 2011;147:235–246. doi: 10.1016/j.cell.2011.08.040. [DOI] [PMC free article] [PubMed] [Google Scholar]
- 33.Alarcón M., Abrahams B.S., Stone J.L., Duvall J.A., Perederiy J.V., Bomar J.M., Sebat J., Wigler M., Martin C.L., Ledbetter D.H. Linkage, association, and gene-expression analyses identify CNTNAP2 as an autism-susceptibility gene. Am. J. Hum. Genet. 2008;82:150–159. doi: 10.1016/j.ajhg.2007.09.005. [DOI] [PMC free article] [PubMed] [Google Scholar]
- 34.Lu H., Zhu J., Zang Y., Ze Y., Qin J. Cloning, purification, and refolding of human paraoxonase-3 expressed in Escherichia coli and its characterization. Protein Expr. Purif. 2006;46:92–99. doi: 10.1016/j.pep.2005.07.021. [DOI] [PubMed] [Google Scholar]
- 35.Chen Q., Reis S.E., Kammerer C.M., McNamara D.M., Holubkov R., Sharaf B.L., Sopko G., Pauly D.F., Merz C.N.B., Kamboh M.I., WISE Study Group Association between the severity of angiographic coronary artery disease and paraoxonase gene polymorphisms in the National Heart, Lung, and Blood Institute-sponsored Women’s Ischemia Syndrome Evaluation (WISE) study. Am. J. Hum. Genet. 2003;72:13–22. doi: 10.1086/345312. [DOI] [PMC free article] [PubMed] [Google Scholar]
- 36.Sanghera D.K., Aston C.E., Saha N., Kamboh M.I. DNA polymorphisms in two paraoxonase genes (PON1 and PON2) are associated with the risk of coronary heart disease. Am. J. Hum. Genet. 1998;62:36–44. doi: 10.1086/301669. [DOI] [PMC free article] [PubMed] [Google Scholar]
- 37.Fukumura K., Kato A., Jin Y., Ideue T., Hirose T., Kataoka N., Fujiwara T., Sakamoto H., Inoue K. Tissue-specific splicing regulator Fox-1 induces exon skipping by interfering E complex formation on the downstream intron of human F1gamma gene. Nucleic Acids Res. 2007;35:5303–5311. doi: 10.1093/nar/gkm569. [DOI] [PMC free article] [PubMed] [Google Scholar]
- 38.Voineagu I., Wang X., Johnston P., Lowe J.K., Tian Y., Horvath S., Mill J., Cantor R.M., Blencowe B.J., Geschwind D.H. Transcriptomic analysis of autistic brain reveals convergent molecular pathology. Nature. 2011;474:380–384. doi: 10.1038/nature10110. [DOI] [PMC free article] [PubMed] [Google Scholar]
- 39.Wilson R., Norris E.L., Brachvogel B., Angelucci C., Zivkovic S., Gordon L., Bernardo B.C., Stermann J., Sekiguchi K., Gorman J.J., Bateman J.F. Changes in the chondrocyte and extracellular matrix proteome during post-natal mouse cartilage development. Mol. Cell. Proteomics. 2012;11 doi: 10.1074/mcp.M111.014159. M111, 014159. [DOI] [PMC free article] [PubMed] [Google Scholar]
- 40.Lobley A., Pierron V., Reynolds L., Allen L., Michalovich D. Identification of human and mouse CatSper3 and CatSper4 genes: characterisation of a common interaction domain and evidence for expression in testis. Reprod. Biol. Endocrinol. 2003;1:53. doi: 10.1186/1477-7827-1-53. [DOI] [PMC free article] [PubMed] [Google Scholar]
- 41.Lu B., Bishop C.E. Mouse GGN1 and GGN3, two germ cell-specific proteins from the single gene Ggn, interact with mouse POG and play a role in spermatogenesis. J. Biol. Chem. 2003;278:16289–16296. doi: 10.1074/jbc.M211023200. [DOI] [PubMed] [Google Scholar]
- 42.Kim P.M., Korbel J.O., Gerstein M.B. Positive selection at the protein network periphery: evaluation in terms of structural constraints and cellular context. Proc. Natl. Acad. Sci. USA. 2007;104:20274–20279. doi: 10.1073/pnas.0710183104. [DOI] [PMC free article] [PubMed] [Google Scholar]
Associated Data
This section collects any data citations, data availability statements, or supplementary materials included in this article.