

Abstract
Top-down analyses in systems biology can automatically find correlations among genes and proteins in large-scale datasets. However, it is often difficult to design experiments from these results. In contrast, bottom-up approaches painstakingly craft detailed models that can be simulated computationally to suggest wet lab experiments. However, developing the models is a manual process that can take many years. These approaches have largely been developed independently.
We present Linker, an efficient and automated data-driven method that can analyze molecular interactomes to propose extensions to models that can be simulated. Linker combines teleporting random walks and k-shortest path computations to discover connections from a source protein to a set of proteins collectively involved in a particular cellular process.
We evaluate the efficacy of Linker by applying it to a well-known dynamic model of the cell division cycle in Saccharomyces cerevisiae. Compared to other state-of-the-art methods, subnetworks computed by Linker are heavily enriched in Gene Ontology (GO) terms relevant to the cell cycle. Finally, we highlight how networks computed by Linker elucidate the role of a protein kinase (Cdc5) in the mitotic exit network of a dynamic model of the cell cycle.
Key words: algorithms, biochemical networks, biology, computational molecular biology, gene expression, graphs and networks, graph theory, pathways
1. Introduction
A major goal of molecular systems biology is to understand how complex networks of interacting genes and proteins control basic aspects of cell physiology. Computational cell biologists have succeeded in constructing detailed, mechanistic, and predictive models of fundamental physiological processes including the yeast cell cycle (Arkin et al., 1998; Alon et al., 1999; Covert et al., 2004; Chen et al., 2004). At the other end of the spectrum, computational analyses of high-throughput information about molecular interactions have been used to construct high-level maps of cellular process, e.g., sets of genes that display concerted activity across a diverse set of cellular conditions (Joyce and Palsson, 2006; Barabasi et al., 2011). While both of these approaches have identified interesting and useful patterns of molecular activity, they have intrinsic and complementary limitations. Specifically, the construction of mechanistic models is a painstaking, multiyear undertaking that involves careful study of the literature and incremental improvements to existing models, whereas top-down models, by and large, do not make quantitative predictions about the dynamical properties of regulatory networks.
We are developing a principled methodology that links high-level, network topologies with detailed dynamic models of cellular control systems. Connections found by the top-down data-analysis approach can suggest novel mechanistic hypotheses. Bottom-up dynamic modeling can predict the phenotypes of new designer mutants that could be used to discriminate between alternative network hypotheses, thereby providing a path toward experimental validation. In this work, we address the first step, that is analyzing molecular interactomes to suggest extensions to dynamic models.
We use the cell division cycle in S. cerevisiae as our motivating example. Chen et al. (2004) proposed a well-known dynamic model of this process; we refer to this model as Chen2004 henceforth. Chen2004 is a collection of biochemical reactions, modeled as ordinary differential equations, that describe protein synthesis and degradation, complex formation, and regulatory activity for 27 genes known to be involved in regulating the yeast cell cycle. Chen2004 faithfully reproduces the phenotypes of 120 mutant strains of budding yeast.
Despite its success, the Chen2004 model is incomplete. Several proteins that are widely recognized as influential in cell cycle progression were not included as species in the model. We developed Linker to address this issue: given a set of “source” proteins, a set of “target” proteins involved in cell cycle regulation (from Chen2004), and a yeast interactome, we sought highly relevant and interpretable paths that connect the sources to the target proteins through edges in the interactome. Before developing our methods, we articulate the following important requirements:
(i) Many of the interactions in Chen2004 are regulatory, that is, transcription factors govern the synthesis of proteins, and kinases phosphorylate their targets. Therefore, the method should be applicable to a directed network.
(ii) We sought formulations of the problem that are computationally tractable (e.g., not NP-complete), to avoid the need for approximation algorithms (Yosef et al., 2009) or heuristics (Bailly-Bechet et al., 2011). Ideally, we desired problems that are amenable to polynomial-time algorithms.
(iii) Analysis of the interactome may generate not only potential pathways that are novel and worth pursuing but also networks that are trivial or implausible for reasons not evident from the databases. Therefore, modelers and molecular biologists may want to ask the methods to expand the computed subnetworks. Accordingly, we wanted methods that support an easy-to-interpret parameter, upon whose increase the computed subnetworks would expand smoothly.
We summarize related research in Section 2. Then, we present Linker in Section 3, starting with a discussion of how we used these requirements to design our approach. In Section 4, we describe our input datasets. In Section 5, we evaluate Linker and compare it to related algorithms.
2. Related Research
Linker addresses a problem that belongs to the following class. We are given a weighted, directed interaction network G = (V, E), where V is a set of vertices, E is a set of directed edges, and each edge (u, v) is assigned a weight wuv. Let S be a set of source nodes, and let T be a set of target nodes in the network. The goal is to identify a connected, low weight subnetwork of G that connects the source set to the target set. Several variations of this problem and related algorithms have emerged recently in systems biology.
ANAT seeks a subnetwork connecting S (which contains a single node in their approach) to T that simultaneously addresses both a local and a global minimization criterion (Yosef et al., 2009) and accepts as input a parameter that controls the relative importance given to each criterion. ANAT computes a solution that has a provable approximation guarantee.
ResponseNet is a flow-based approach that connects sources to target proteins through edges in G (Yeger-Lotem et al., 2009). ResponseNet solves a linear program that maximizes the total flow from the source nodes to the target nodes, subject to an additive penalty for allowing positive flow along edges of low weight.
The NP-hard prize-collecting Steiner tree (PCST) problem is another relevant formulation. Given a weighted, undirected interaction network G = (V, E) and a positive prize bv associated with each node  , the PCST is a connected subtree G′ of G that minimizes the sum of the costs of the edges in G′ and the prizes of the nodes that are not in G′ over all possible connected subgraphs of G. This formulation allows some nodes to be left out of G′ if the cost of including them is large. Systems biologists have used an exact mathematical programming solution to PCST (Ljubić et al., 2006) to compute cellular response networks (Dittrich et al., 2008), interpret metabolomic data (Deo et al., 2010), and recover signaling pathways (Huang and Fraenkel, 2009). Since PCST is an NP-hard problem, MsgSteiner offers a heuristic approach that computes a quasi-optimal subtree with a depth that is at most d, a user-defined parameter (Bailly-Bechet et al., 2011). Additionally, MsgSteiner expects as an input a node r as a root for the subtree; thus, r is guaranteed to be a node in the solution, and the subtree can be directed from the root to the target nodes.
In Section 5.3, we describe how we adapt ResponseNet and MsgSteiner to our application, and we compare Linker to these state-of-the-art algorithms.
3. Algorithms
In our application, the modelers preferred to augment Chen2004 one source at a time; hence, S contained one node. Moreover, it was sufficient for our application to find paths connecting the node in S to any node in T. The principles outlined at the end of Section 1 guided our development of Linker. Rather than directly compute a low-cost subgraph that connects the source S to the targets in T, we solve the problem in two stages. First, we used a teleporting random walk popularly known as PageRank (Page et al., 1999) to rank nodes in G with respect to the node in S. We took inspiration from a number of applications of random-walk–like ideas in systems biology (Komurov et al., 2010; Navlakha and Kingsford, 2010; Vanunu et al., 2010; Murali et al., 2011; Winter et al., 2012). Second, we used the node visitation probabilities to compute the k most-probable paths from S to T. Both steps can take directed graphs as input, satisfying the first requirement. Both steps can be executed efficiently in polynomial time, satisfying the second requirement. Finally, our approach meets the third desideratum as follows: By increasing k, we have the flexibility to return additional paths, if so requested by the user. By construction, the k best paths are a subset of the k+1 best paths, thereby ensuring that the results vary smoothly with k.
The PageRank Algorithm. Although PageRank is well known, we describe it for the sake of completeness. In general, PageRank can accept multiple nodes in S. We set the starting probability sv for each node v as follows: sv = 1/|S| for  and sv = 0 otherwise. Let wuv be the weight of the directed edge (u, v). We normalize the edge weights such that
  , where Nu is the set of out-neighbors of node u, that is
  . We start the process by placing the walker on node u with probability su for each node
  . Now, the walker moves in the network according to the following rules, where 0 ≤ q ≤ 1 is a parameter:
Teleport: With probability qsx, she teleports to any node  , including her current node and its neighbors; the total probability of teleporting from u is q.
Walk: She can move from her current node u to any of u's out-neighbors  with probability proportional to (1 − q)wuv; thus, the total probability of walking to some neighbor of u is 1−q.
The parameter q provides control over how often the walker teleports back to one of the start nodes in S.
Visitation probabilities. PageRank naturally defines a transition matrix  among the nodes in G. Each entry
  indicates the probability that a walker at node u will transition to node v; thus,
  is right stochastic. Let U be the weighted, directed graph defined by the adjacency matrix
  . If U is strongly connected and aperiodic, that is the greatest common divisor of the cycle lengths of U is 1, then PageRank converges to a unique stationary distribution. In this case, we can compute the stationary visitation probability pv for each node
  by solving the following linear system:
 |
We can solve the system by inverting an appropriate matrix. In practice, we used the well-known iterative power method to compute the stationary probabilities. We found that this linear system had a unique solution for all our source nodes.
Discovering highly probable paths. Ultimately, we seek interpretable paths that connect the source node to the target nodes. Accordingly, we search for paths from the node in S to any node in T such that the product of the probabilities of the nodes in the path is maximized. We identify the top k most probable paths, where k is a user-defined parameter, by modifying the network and solving the following problem. Given a network G and two nodes s and t, we identify the top k shortest paths from s to t. We modify the network by adding an artificial sink node t with a directed edge (v, t) for each node  . We assign a cost to each edge (u, v) in the resulting network as follows:
 |
We define the cost of a path as the sum of the costs of the edges in the path; thus, the path with lowest cost is equivalent to the most probable path. We search for the k shortest loopless paths from the node in S to t using Yen's algorithm (Yen, 1971). This algorithm runs in  time, where n = |V | and m = |E|.
4. Datasets
Interactome. We represented the yeast interactome as a directed network G(V, E), where V is the set of yeast genes or their corresponding products and E is the set of edges, in which each edge (u, v) represents an interaction from u to v. The interactome integrated physical protein–protein interactions from BioGRID (Stark et al., 2011), transcription factor–target interactions from YEASTRACT (Abdulrehman et al., 2011), and kinase- and phosphatase-target interactions from KID (Sharifpoor et al., 2011) and Bodenmiller et al. (Bodenmiller 2010). We represented BioGRID interactions as bidirectional edges. We directed each YEASTRACT interaction from the transcription factor to its target gene. We manually partitioned the phosphoproteomic interactions from KID into directed or bidirectional based on the experimental evidence codes, with a directed interaction pointing from the kinase or phosphatase to its target protein. We directed all interactions from Bodenmiller et al. (2010) similarly. We removed all edges connecting pairs of genes in Chen2004, and we removed nodes with an unweighted in- or out-degree greater than 1000. The network contained 6556 nodes and 151,993 directed edges.
Edge weights. We assigned a confidence  to each directed edge
  using a probabilistic approach (Yeger-Lotem et al. 2009). Given a collection of experimental evidence codes supporting each interaction, this method estimates the probability that the pair of proteins interact. The approach assigns higher confidence to pairs of interacting proteins that participate in the same biological processes. A detailed explanation of this method is available in the Supplementary Material (available online at www.liebertonline.com/cmb).
Source proteins and targets. For our initial test of Linker, we chose 12 source proteins (Cdc5, Cdc55, Far1, Hsl1, Hsl7, Msn5, Nrm1, Sln1, Ssa1, Stb1, Tpk2, and Ydj1) that were not included in Chen2004 but that are currently being incorporated into extensions of the model, led by coauthors of this work Chen and Tyson. Hence, we have some expectations about how these proteins should be connected to the Chen2004 model. We wanted to determine whether Linker could reproduce our own expert knowledge about the control system and if it could suggest new interactions of which we may have been unaware. We included all 27 proteins in Chen2004 as targets.
5. Results
We divide our results into four parts: i) an evaluation of how similar PageRank node visitation probabilities are for different queries, ii) how PageRank ranks genes whose deletions modify cell size, iii) a comparison of Linker to ResponseNet and MsgSteiner, and iv) a case study of the network computed by Linker for the protein kinase Cdc5. We note that Linker takes less than 20 seconds to preprocess the inputs, execute PageRank, and compute the 50 most probable paths.
5.1. Similarity of PageRank results between queries
One concern with PageRank is that the structure of the network may dominate the influence of the source when we compute the visitation probabilities; that is the most visited nodes may be independent of the source, especially for small values of the input parameter q. To assess the tradeoff between network effects and source selection, we ran Linker using each of the 12 individual source proteins for three values of the input parameter q, namely, 0.1, 0.5, and 0.9.
After each application of PageRank, we ranked the nodes in the network in decreasing order of their visitation probabilities. For each value of q, we measured the Jaccard index of the top-ranking k nodes for each pair of source proteins, where k ranged from 20 to 100; we did not evaluate larger values of k since they were likely to be uninteresting for the purpose of expanding Chen2004. Figure 1 illustrates boxplots of the distribution of Jaccard indices of the top-ranking genes over the  pairs of sources. Note that we expect the Jaccard index between the rankings for any pair of proteins to increase as we increase k, since the Jaccard index must reach 1 for a sufficiently large value of k. We observed that the similarity between the top-ranking proteins for different sources decreased as we increase the parameter q. For large values of q, the random walker frequently restarts her walk at the source protein, and she is biased toward visiting proteins that can be reached in just a few steps from the source. Since the median Jaccard index with q = 0.5 was small (less than 0.1) for the top 100 nodes, we used this value of q for all subsequent analyses.
FIG. 1.

The Jaccard index between the top-ranking nodes for each pair of queries.
5.2. Ranks of cell-size modifiers
Jorgensen et al. (2002) performed a comprehensive genome-wide analysis of the effect of approximately 6000 single-gene deletions on cell growth. They systematically measured the cell-size distribution in each deletion strain and compared it to the size distribution of wild-type cells. Jorgensen et al. identified 228 and 215 deletion mutants whose cell size distribution is drastically increased or decreased, respectively, compared to wild-type.
The cell cycle controls the rate at which the cell grows, including its size at division. Since the source genes that we supplied to PageRank are key players in the cell cycle, we anticipated that PageRank would favor visiting these cell-size modifiers during the random walk process. We tested this hypothesis by computing the cumulative distributions of cell-size increasers, decreasers, and modifiers (i.e., the union of increasers and decreasers) in the top 100 nodes ranked by PageRank visitation probability. We compared this distribution to the uniform distribution of cell-size changers using the Kolmogorov-Smirnov test. Table 1 indicates that we observed a statistically significant number of cell-size increasers to lie in the 100 most visited nodes. Similarly, for all but one source protein (Sln1), we observed a statistically significant number of cell-size modifiers. For 7 of 12 proteins, we observed a significant number of cell-size decreasers in the top 100 nodes.
Table 1.
p-Values of the Kolmogorov-Smirnov Test Comparing the Observed Distribution of Cell Size Increasers, Decreasers, or Modifiers (i.e., Increasers and Decreasers) in the Top 100 Nodes Ranked by PageRank Visitation Probabilities to the Uniform Distribution
| Source | Size increasers | Size decreasers | Size modifiers |
|---|---|---|---|
| CDC5 | 1.57 × 10⁻²² | — | 6.66 × 10⁻¹⁹ |
| CDC55 | 1.57 × 10⁻²² | 5.96 × 10−06 | 1.21 × 10−l07 |
| FAR1 | 8.24 × 10⁻²⁴ | 6.67 × 10⁻²² | 8.24 × 10⁻²⁴ |
| HSL1 | 9.30 × 10⁻³¹ | — | 3.97 × 10⁻²⁵ |
| HSL7 | 1.12 × 10⁻²⁰ | — | 4.52 × 10⁻¹⁴ |
| MSN5 | 2.17 × 10⁻¹⁰ | 8.08 × 10⁻¹¹ | 8.08 × 10⁻¹¹ |
| NRM1 | 1.75 × 10⁻¹⁹ | 6.67 × 10⁻²² | 4.48 × 10⁻²⁰ |
| SLN1 | 4.52 × 10⁻¹⁴ | — | — |
| SSA1 | 5.06 × 10⁻³⁰ | 1.31 × 10−02 | 3.64 × 10⁻²³ |
| STB1 | 3.70 × 10⁻¹² | 8.44 × 10⁻²⁶ | 4.48 × 10⁻²⁰ |
| TPK2 | 8.44 × 10⁻²⁶ | — | 8.44 × 10⁻²⁶ |
| YDJ1 | 8.66 × 10⁻³⁴ | 8.08 × 10⁻¹¹ | 3.28 × 10⁻¹⁷ |
Dashes indicate that fewer increasers, decreasers, or modifiers were observed than expected.
5.3. Comparing Linker to ResponseNet, MsgSteiner, and KSP
We compared Linker to ResponseNet (Yeger-Lotem et al. 2009) and MsgSteiner (Bailly-Bechet et al. 2011), two state-of-the-art algorithms that compute connections between source and target proteins. We also compared Linker to KSP, an approach that directly identifies the k most confident paths from the source to any target (i.e., without initially applying PageRank). While we do not directly compare Linker to Anat, we note that MsgSteiner and KSP represent the global (Steiner tree) and local (shortest path) extremes of the Anat approach.
We provided the interactome, each of the 12 source proteins, and the set of target cell cycle proteins as inputs to ResponseNet. Ten of the computed subnetworks consisted of only direct interactions between the source and a subset of the target proteins. The number of targets directly connected to the source varied between two and eight, depending on the source. To address our third requirement (where the modeler requests more links from the source to target), we varied ResponseNet's parameter γ that controls the size of the output network. We tested a range of values for γ, where  , as suggested by the authors. However, modifying this parameter had no effect on the output networks for a specific source. While ResponseNet discovered potentially relevant connections from the source to a subset of the target proteins, we were unable to elicit larger networks from the method.
We applied MsgSteiner to the same inputs, seeking for each query a low-cost connected tree that includes at least one of the target proteins and is rooted at the source. We set the prize of each target protein to 1 and all other nodes to 0. MsgSteiner accepts two input parameters: d specifies the maximum depth of the tree, and λ scales the value of the prizes on each node. We tested values of d ranging from 3 to 6, and three values of λ, namely, 0.125, 0.1875, and 0.25. Increasing either d or λ yielded increasingly larger trees in most, but not in all, cases. However, this variation did not fully address our third requirement: determining reasonable values for d and λ was tedious, as these values depended on the distribution of edge weights. Moreover, gradually increasing d or λ did not grow the computed networks smoothly. Many nodes and edges that were present in the solution for one value of λ disappeared when we increased λ. Thus, we found that the parameters are difficult to interpret in the context of our application and that MsgSteiner does not readily facilitate a modeler's potential request to expand computed subnetworks.
Lastly, we applied KSP, a naïve version of Linker that excludes the random walk and seeks the k most highly confident paths from the source to any target, where k is an input parameter and the confidence of a path is the product of weights of the edges in the path. The parameter k clearly offers the same advantages for KSP as it does for Linker; increasing k by one identifies the single most probable path from source to target that has not yet been computed.
We assessed the functional coherence of the subnetworks computed by each algorithm through functional enrichment. We applied Model-based Gene Set Analysis (MGSA) (Bauer et al., 2010) to the union of the set of internal nodes (i.e., nonsource and nontarget) in the subnetworks discovered by each algorithm for the 12 source proteins; see the Supplementary Material for our rationale for selecting MGSA. We computed the enrichment of Gene Ontology biological processes in each set of internal nodes, where we defined significantly enriched functions as those with an estimated posterior probability greater than 0.5. Table 2 lists the enriched functions identified for each invocation of the algorithms. Note that the table only reports an algorithm and its corresponding parameters if they yielded at least one enriched functions. We used all combinations of parameters mentioned previously for each algorithm. MGSA identified zero enriched functions in the internal nodes from ResponseNet for all parameter choices. We only observed one enriched function for MsgSteiner for four parameter combinations; all other combinations of parameters yielded no enriched functions. Note that we tested twelve total parameter combinations for MsgSteiner (four values for d and three values for λ). MGSA identified one, four, and four significantly enriched functions in the internal nodes of KSP, for k equal to 10, 20, and 30, respectively. We discovered enriched functions for all parameter values given to Linker: four, four, and two enriched functions for the top 10, 20, and 30 most probable paths, respectively. The processes enriched in Linker networks included cell-shape checkpoint (the presence of this term supports our earlier results on cell-size modifiers), regulation of cytokinesis, and cell-shape checkpoint.
Table 2.
GO Biological Processes Enriched in the Internal Nodes Returned by Each Algorithm
| Algorithm | Parameters | Enriched function | Score |
|---|---|---|---|
| Linker | k = 10 | Single recognition particle (SNP)-dependent cotranslational protein targeting to membrane, translocation | 0.972156 |
| Cell-shape checkpoint | 0.9186824 | ||
| Activation of mitogen-activated protein kinase kinase (MAPKK) activity | 0.6717416 | ||
| Regulation of cytokinesis | 0.5640634 | ||
| k = 20 | SRP-dependent cotranslational protein-targeting to membrane, translocation | 0.9863416 | |
| Cell-shape checkpoint | 0.8668016 | ||
| Regulation of cytokinesis | 0.5174146 | ||
| Activation of MAPKK activity | 0.507788 | ||
| k = 30 | Cell-shape checkpoint | 0.7922704 | |
| Regulation of exit from mitosis | 0.5509068 | ||
| KSP | k = 10 | Cell-shape checkpoint | 0.9843462 |
| k = 20 | Regulation of exit from mitosis | 0.7266564 | |
| SRP-dependent cotranslational protein targeting to membrane, translocation | 0.6884412 | ||
| Regulation of spindle pole body separation | 0.5822936 | ||
| Regulation of fungal-type Cell wall organization | 0.509839 | ||
| k = 30 | SRP-dependent cotranslational protein-targeting to membrane, translocation | 0.9721356 | |
| Regulation of exit from mitosis | 0.7075808 | ||
| Negative regulation of autophagy | 0.5566982 | ||
| Positive regulation of RNA polymerase II transcriptional preinitiation complex assembly | 0.5038384 | ||
| MsgSteiner | λ = 0.1875, d = 4 | Regulation of spindle pole body separation | 0.8683294 |
| λ = 0.25, d = 3 | Cell-shape checkpoint | 0.8484602 | |
| λ = 0.25, d = 5 | Regulation of sequence-specific DNA-binding transcription factor activity | 0.8618764 | |
| λ = 0.25, d = 5 | Regulation of sequence-specific DNA-binding transcription factor activity | 0.8493982 |
The table reports algorithm and parameter combinations for which at least one function was enriched (i.e., the MGSA posterior probability was at least 0.5).
5.4. Interpreting Linker subnetworks
In Chen2004, the representation of the mitotic exit network (MEN) was incomplete, neglecting the role of Cdc5 (an essential kinase) in the release of Cdc14 (an essential phosphatase) from its association with Net1 in the nucleolus. Since 2004, we have revised the model to include Cdc5 and its targets of phosphorylation (such as Net1, Cdh1, and Bub2/Bfa1). Hence, Cdc5 serves as a useful test case for Linker. Asking for the 10 shortest paths, we obtained the graph shown by solid nodes and edges in Figure 2.
FIG. 2.

The k = 15 shortest paths connecting Cdc5 to the cell cycle proteins. Solid nodes and edges indicate those used in the top 10 paths, while dashed nodes and edges denote those used only by the 11th to 15th shortest paths.
Linker succeeded in discovering the major connections between Cdc5 and cell cycle regulatory proteins. The connections to Bub2, Lte1, Cdc14, and Cdc15 capture the role of Cdc5 in the MEN pathway for Cdc14 release. The links Esp1 and Net1 recover Cdc5's known role in the pathway called FEAR (“Cdc14 early-anaphase release”). The interaction between Cdc5 and Cdh1 plays a well-known role in mitotic exit and reestablishing cells in the G1 phase of the cell cycle.
The interaction between Cdc5 and Tem1 was unexpected and particularly useful to the modelers. Looking at the experimental evidence supporting this link, we found evidence for a role for Cdc5 in bringing Cdc15 to the spindle pole body where it is needed to activate Dbf2 (the endpoint of the MEN pathway) (Ro et al., 2002). This role of Cdc5, of which we were unaware until Linker brought it to our attention, resolves a long-standing problem with versions of the model developed since Chen2004 in simulating the activity of Dbf2 in bub2Δ cdc5Δ cells. Figure 3 illustrates two regulatory control mechanisms of Dbf2 by Cdc5. In our present model, Cdc5 exercises control over Dbf2 only through the Bub2-Bfa1 complex: Cdc5 ⊣ Bub2-Bfa1 ⊣ Tem1 →Dbf2. Hence, the model suggests Dbf2 should be active in bub2Δ cdc5Δ cells, but experiments suggest that it is not (Lee et al., 2001). However, if Cdc5 has a second role, Cdc5 ⊣ Bfa1 ⊣ Tem1, then the model explains the inhibition of Dbf2 in the double-deletion mutant. In the Supplementary Material, we provide hypothetical extensions to Chen2004 that incorporate this alternative regulatory mechanism.
FIG. 3.
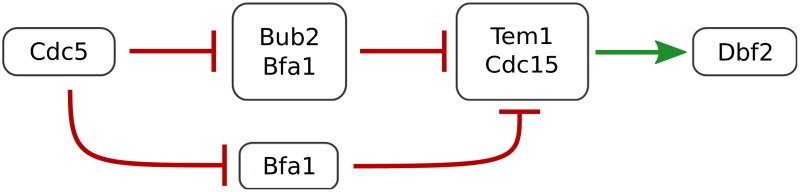
Two regulatory control mechanisms of Dbf2 by Cdc5.
Cdc5 plays additional roles in the DNA damage checkpoint, the morphogenesis checkpoint, and cytokinesis that did not appear in the 10-path graph. The 15-path graph, shown using solid and dashed nodes and edges in Figure 2, includes a link between Cdc5 and Hsl1, which is indicative of Cdc5's role in the morphogenesis checkpoint. This part of the network is further elaborated in the 10-path graphs associated with Hsl1 and Hsl7 as source proteins (see Supplementary Material). Looking deeper into the Cdc5 graph, we expect to find its connections to the DNA damage checkpoint and to cytokinesis.
6. Conclusions
In this article, we have presented Linker, a method that can identify connections from a given source protein to a set of proteins collectively involved in a particular cellular process. We used Linker to suggest extensions to Chen2004, a well-studied dynamic model of the yeast cell cycle. Linker succeeded in discovering critical connections between Cdc5 and cell cycle regulatory proteins that have been included in the model since 2004. Moreover, Linker suggested a link between Cdc5 and Tem1 that resolved a long-standing problem with the model's ability in simulating the activity of Dbf2 in bub2Δ cdc5Δ cells.
We anticipate that this network-based analysis of the yeast cell cycle will continue to provide useful suggestions of the biological mechanisms by which a query protein affects other proteins in the model. We plan to use this information to guide further development of the existing model and to base subsequent experiments on the improved model. In this manner, we aim to create an integrated framework for hypothesis generation, testing, and validation, in order to construct predictive models of complex macromolecular regulatory systems.
Supplementary Material
Acknowledgments
This work was supported by a National Science Foundation (NSF) Graduate Research Fellowship (CLP), NSF grant DBI-1062380 (TMM), National Institute of General Medical Sciences of the National Institutes of Health grant R01GM095955 (TMM and JJT), and the Computational Tissue Engineering Interdisciplinary Graduate Education Program at Virginia Tech (TMM). We thank Alfredo Braunstein and Riccardo Zecchina for providing us the version of the MsgSteiner software that supports directed graphs.
Author Disclosure Statement
No competing financial interests exist.
References
- Abdulrehman D. Monteiro P.T. Teixeira M.C., et al. YEASTRACT: providing a programmatic access to curated transcriptional regulatory associations in Saccharomyces cerevisiae through a web services interface. Nucleic Acids Research. 2011;39:D136–D140. doi: 10.1093/nar/gkq964. [DOI] [PMC free article] [PubMed] [Google Scholar]
- Alon U. Surette M.G. Barkai N. Leibler S. Robustness in bacterial chemotaxis. Nature. 1999;397:168–171. doi: 10.1038/16483. [DOI] [PubMed] [Google Scholar]
- Arkin A. Ross J. McAdams H.H. Stochastic kinetic analysis of developmental pathway bifurcation in phage lambda-infected escherichia coli cells. Genetics. 1998;149:1633–1648. doi: 10.1093/genetics/149.4.1633. [DOI] [PMC free article] [PubMed] [Google Scholar]
- Bailly-Bechet M. Borgs C. Braunstein A. Finding undetected protein associations in cell signaling by belief propagation. Proceedings of the National Academy of Sciences. 2011;108:882–887. doi: 10.1073/pnas.1004751108. [DOI] [PMC free article] [PubMed] [Google Scholar]
- Barabasi A.-L. Gulbahce N. Loscalzo J. Network medicine: a network-based approach to human disease. Nature Reviews Genetics. 2011;12:56–68. doi: 10.1038/nrg2918. [DOI] [PMC free article] [PubMed] [Google Scholar]
- Bauer S. Gagneur J. Robinson P.N. GOing Bayesian: model-based gene set analysis of genome-scale data. Nucleic Acids Research. 2010;38:3523–3532. doi: 10.1093/nar/gkq045. [DOI] [PMC free article] [PubMed] [Google Scholar]
- Bodenmiller B. Wanka S. Kraft C., et al. Phosphoproteomic analysis reveals interconnected system-wide responses to perturbations of kinases and phosphatases in yeast. Sci. Signal. 2010;3:rs4+. doi: 10.1126/scisignal.2001182. [DOI] [PMC free article] [PubMed] [Google Scholar]
- Chen K.C. Calzone L. Csikasz-Nagy A., et al. Integrative analysis of cell cycle control in budding yeast. Molecular Biology of the Cell. 2004;15:3841–3862. doi: 10.1091/mbc.E03-11-0794. [DOI] [PMC free article] [PubMed] [Google Scholar]
- Covert M.W. Knight E.M. Reed J.L., et al. Integrating high-throughput and computational data elucidates bacterial networks. Nature. 2004;429:92–96. doi: 10.1038/nature02456. [DOI] [PubMed] [Google Scholar]
- Deo R.C. Hunter L. Lewis G.D., et al. Interpreting metabolomic profiles using unbiased pathway models. PLoS Comput Biol. 2010;6:e1000692+. doi: 10.1371/journal.pcbi.1000692. [DOI] [PMC free article] [PubMed] [Google Scholar]
- Dittrich M.T. Klau G.W. Rosenwald A., et al. Identifying functional modules in protein-protein interaction networks: an integrated exact approach. Bioinformatics. 2008;24:i223–231. doi: 10.1093/bioinformatics/btn161. [DOI] [PMC free article] [PubMed] [Google Scholar]
- Huang S.C. Fraenkel E. Integrating proteomic, transcriptional, and interactome data reveals hidden components of signaling and regulatory networks. Sci. Signal. 2009;2:ra40+. doi: 10.1126/scisignal.2000350. [DOI] [PMC free article] [PubMed] [Google Scholar]
- Jorgensen P. Nishikawa J.L. Breitkreutz B.-J. Tyers M. Systematic identification of pathways that couple cell growth and division in yeast. Science. 2002;297:395–400. doi: 10.1126/science.1070850. [DOI] [PubMed] [Google Scholar]
- Joyce A.R. Palsson B.O. The model organism as a system: integrating ‘omics’ data sets. Nat Rev Mol Cell Biol. 2006;7:198–210. doi: 10.1038/nrm1857. [DOI] [PubMed] [Google Scholar]
- Komurov K. White M.A. Ram P.T. Use of data-biased random walks on graphs for the retrieval of context-specific networks from genomic data. PLoS Comput Biol. 2010;6 doi: 10.1371/journal.pcbi.1000889. [DOI] [PMC free article] [PubMed] [Google Scholar]
- Lee S. Frenz L. Wells N., et al. Order of function of the budding-yeast mitotic exit-network proteins Tem1, Cdc15, Mob1, Dbf2, and Cdc5. Current Biology. 2001;11:784–788. doi: 10.1016/s0960-9822(01)00228-7. [DOI] [PubMed] [Google Scholar]
- Ljubić I. Weiskircher R. Pferschy U. An algorithmic framework for the exact solution of the prize-collecting Steiner tree problem. Mathematical Programming. 2006;105:427–449. [Google Scholar]
- Murali T.M. Dyer M.D. Badger D., et al. Network-Based prediction and analysis of HIV dependency factors. PLoS Comput Biol. 2011;7:e1002164+. doi: 10.1371/journal.pcbi.1002164. [DOI] [PMC free article] [PubMed] [Google Scholar]
- Navlakha S. Kingsford C. The power of protein interaction networks for associating genes with diseases. Bioinformatics (Oxford, England) 2010;26:1057–1063. doi: 10.1093/bioinformatics/btq076. [DOI] [PMC free article] [PubMed] [Google Scholar]
- Page L. Brin S. Motwani R. Winograd T. Stanford InfoLab; 1999. The PageRank citation ranking: Bringing order to the web. Technical Report 1999-66. [Google Scholar]
- Ro H.-S.S. Song S. Lee K.S. Bfa1 can regulate Tem1 function independently of Bub2 in the mitotic exit network of Saccharomyces cerevisiae. Proceedings of the National Academy of Sciences of the United States of America. 2002;99:5436–5441. doi: 10.1073/pnas.062059999. [DOI] [PMC free article] [PubMed] [Google Scholar]
- Sharifpoor S. Ba A.N. Young J.Y., et al. A quantitative literature-curated gold standard for kinase-substrate pairs. Genome Biology. 2011;12:R39+. doi: 10.1186/gb-2011-12-4-r39. [DOI] [PMC free article] [PubMed] [Google Scholar]
- Stark C. Breitkreutz B.-J.J. Chatr-Aryamontri A., et al. The BioGRID interaction database: 2011 update. Nucleic Acids Research. 2011;39:D698–D704. doi: 10.1093/nar/gkq1116. [DOI] [PMC free article] [PubMed] [Google Scholar]
- Vanunu O. Magger O. Ruppin E., et al. Associating genes and protein complexes with disease via network propagation. PLoS Comput Biol. 2010;6:e1000641+. doi: 10.1371/journal.pcbi.1000641. [DOI] [PMC free article] [PubMed] [Google Scholar]
- Winter C. Kristiansen G. Kersting S. Google goes cancer: Improving outcome prediction for cancer patients by network-based ranking of marker genes. PLoS Comput Biol. 2012;8:e1002511+. doi: 10.1371/journal.pcbi.1002511. [DOI] [PMC free article] [PubMed] [Google Scholar]
- Yeger-Lotem E. Riva L. Su L.J.J. Bridging high-throughput genetic and transcriptional data reveals cellular responses to alpha-synuclein toxicity. Nature Genetics. 2009;41:316–323. doi: 10.1038/ng.337. [DOI] [PMC free article] [PubMed] [Google Scholar]
- Yen J.Y. Finding the k shortest loopless paths in a network. Management Science. 1971;17:712–716. [Google Scholar]
- Yosef N. Ungar L. Zalckvar E., et al. Toward accurate reconstruction of functional protein networks. Molecular Systems Biology. 2009;5 doi: 10.1038/msb.2009.3. [DOI] [PMC free article] [PubMed] [Google Scholar]
Associated Data
This section collects any data citations, data availability statements, or supplementary materials included in this article.