Abstract
The therapeutic efficiency of combined chemotherapy and gene therapy on human hepatocellular carcinoma HepG2 cells was investigated using double-walled microspheres that consisted of a poly(D,L-lactic-co-glycolic acid) (PLGA) core surrounded by a poly(L-lactic acid) (PLLA) shell layer and fabricated via the precision particle fabrication (PPF) technique. Here, double-walled microspheres were used to deliver doxorubicin (Dox) and/or chitosan-DNA nanoparticles containing the gene encoding the p53 tumor suppressor protein (chi-p53), loaded in the core and shell phases, respectively. Preliminary studies on chi-DNA nanoparticles were performed to optimize gene transfer to HepG2 cells. The transfection efficiency of chi-DNA nanoparticles was optimal at an N/P ratio of 7. In comparison to the 25-kDa branched polyethylenimine (PEI), chitosan showed no inherent toxicity towards the cells. Next, the therapeutic efficiencies of Dox and/or chi-p53 in microsphere formulations were compared to free drug(s) and evaluated in terms of growth inhibition, and cellular expression of tumor suppressor p53 and apoptotic caspase 3 proteins. Overall, the combined Dox and chi-p53 treatment exhibited enhanced cytotoxicity as compared to either Dox or chi-p53 treatments alone. Moreover, the antiproliferative effect was more substantial when cells were treated with microspheres than those treated with free drugs. High p53 expression was maintained during a five-day period, and was largely due to the controlled and sustained release of the microspheres. Moreover, increased activation of caspase 3 was observed, and was likely to have been facilitated by high levels of p53 expression. Overall, double-walled microspheres present a promising dual anticancer delivery system for combined chemotherapy and gene therapy.
Keywords: Double-walled microspheres, PLGA, PLLA, chitosan, p53, doxorubicin, gene therapy, chemotherapy
1. Introduction
Aberrations of the p53 pathway are a well-known feature of many human tumors [1, 2]. It is estimated that about 50% of the human tumors contain mutations in the p53 gene, of which 80% are missense mutations found 97% of the time within the DNA-binding domain [3]. Recent attempts in correcting malfunctioning p53 gene through anticancer gene delivery have been reported to sensitize cancer cells towards anticancer drugs [4–6]. This could potentially overcome the poor tumor response in many cancer patients when cytotoxic drugs are given as the sole form of treatment [7]. In one study, the simultaneous delivery of p53 gene and doxorubicin using an oligopeptide amphiphile carrier resulted in a synergistic cytotoxic effect towards a human hepatocarcinoma cell line [5]. Similarly, the co-delivery of p53 gene and doxorubicin using a cationic β-cyclodextrin-polyethylenimine carrier promoted the inhibition of breast tumor growth in vivo and prolonged the survival time of tumor-bearing mice [6]. Thus, the combination of gene therapy and chemotherapy may increase the therapeutic efficacy in the treatment of cancer patients.
The development of biodegradable polymeric microspheres for codelivery of drugs and genes may offer new opportunities in cancer therapy. Polymeric microspheres could allow predictable release of drug/gene over time, prolong contact time of drug/gene with cancer cells and achieve effective synergies. Here, double-walled microspheres with a polymer core surrounded by a shell layer were introduced for combined chemotherapy and gene therapy. These double-walled microspheres could encapsulate small molecules and gene carriers in the core or shell phase, and allow their release in various stages, thereby achieving synergistic therapeutic effects [8–10].
In our previous work, we reported the production of monodisperse double-walled microspheres loaded with doxorubicin (Dox) and chitosan-p53 (chi-p53) nanoparticles in the poly(D,L-lactic-co-glycolic acid) (PLGA) core and poly(L-lactic acid) (PLA) shell phases, respectively [11]. The microspheres released chi-p53 nanoparticles first, followed by simultaneous release of Dox and chi-p53 nanoparticles at a near zero-order rate. In this study, the aim is to evaluate the therapeutic efficiency of these microspheres in human hepatocellular carcinoma (HCC) HepG2 cells, which express wild-type p53. First, chi-DNA nanoparticles were characterized in terms of their particle size, zeta potential and degree of DNA condensation as well as transfection efficiency and cytotoxicity in HepG2 cells. Next, the therapeutic efficiencies of delivering Dox and/or chi-p53 as free drug or microsphere formulations were compared and evaluated in terms of growth inhibition, and cellular expression of tumor suppressor p53 and apoptotic caspase 3 proteins. Growth inhibition was determined by cell viability assay, while expressions of p53 and caspase 3 were analyzed by enzyme-linked immunosorbent assay (ELISA) and immunofluorescence staining of treated cells.
2. Materials and methods
2.1. Materials
Poly(D,L-lactic-co-glycolic acid) (PLGA) copolymer (50:50 lactic acid:glycolic acid; inherent viscosity (i.v.) = 0.61 dL/g in hexafluoroisopropanol) and poly(L-lactic acid) (PLLA) (i.v. = 1.05 dL/g in chloroform) were purchased from Lactel Absorbable Polymers (Pelham, AL). Poly(vinyl alcohol) (PVA) (Mw = 25,000 Da), 88 mol% hydrolyzed, was purchased from Polysciences, Inc. (Warrington, PA). Doxorubicin, in the form of hydrochloride salt with more than 99% purity, was purchased from LC Laboratories (Woburn, MA). Medium molecular weight chitosan (Mw = 190,000 – 310,000 Da) with degree of deacetylation of 75 – 85% and polyethylenimine (PEI, branched, Mw = 25,000 Da) were purchased from Sigma-Aldrich Corp. (St. Louis, MO). Plasmid DNA (pCMV-pRL) of 4.1 kb size encoding Renilla luciferase protein driven by CMV promoter was obtained from Promega Corp. (Madison, WI). Plasmid DNA (pCMV-p53) of 5.2 kb size encoding tumor suppressor wild-type p53 protein driven by CMV promoter was obtained from Clontech Laboratories, Inc. (Mountain View, CA). Plasmid DNA of 2.7 kb size labeled with Cy™3 (pCy3) was obtained from Mirus Bio LLC (Madison, WI). Dichloromethane (DCM), HFIP, sodium acetate and sodium sulfate were acquired from Sigma-Aldrich Corp. Phosphate-buffered saline (PBS) with a pH of 7.4 was acquired from Mediatech, Inc. (Manassas, VA).
2.2. Synthesis and characterization of chi-DNA nanoparticles
2.2.1. Preparation of plasmid DNA
The pCMV-pRL and pCMV-p53 plasmid DNA were amplified in Escherichia coli DH5α cells and purified using the HiSpeed Plasmid Maxi Kit (Qiagen, Inc.; Valencia, CA). The DNA concentration was quantified by using the Quant-iT PicoGreen dsDNA Kit (Molecular Probes, Inc.; Eugene, OR).
2.2.2. Preparation of chi-DNA nanoparticles
Chi-DNA nanoparticles were formed according to a previously reported technique [12]. A chitosan solution in 5 mM sodium acetate buffer, pH 5.5, and a DNA solution (5 mM sodium sulfate solution, pH 7.0) were preheated to 50 – 55°C separately. Equal volumes of both solutions were quickly mixed and vortexed for 30 s. The final volume of the mixture in each preparation was limited to less than 500 μl in order to yield uniform nanoparticles. Chi-DNA nanoparticles with different N/P ratios were prepared by varying the amount of polymer added to a constant amount of plasmid DNA.
2.2.3. Particle size of chi-DNA nanoparticles
Particle size measurements of chi-DNA nanoparticles were performed by dynamic light scattering (DLS), using a 90Plus particle size analyzer (Brookhaven Instruments Corp.; Holtsville, NY), at 25°C with a scattering angle of 90°. The nanoparticles were diluted in equal volume of 5 mM sodium acetate buffer and 5 mM sodium sulfate solution before measurement. Each sample was analyzed in ten cycles (30 s for each cycle). The data were expressed as mean and standard deviation of three replicate samples.
2.2.4. Zeta potential of chi-DNA nanoparticles
Zeta potential measurements of chi-DNA nanoparticles were performed with dilution in equal volume of 5 mM sodium acetate buffer and 5 mM sodium sulfate solution, using a Nicomp 380 ZLS (Particle Sizing Systems; Santa Barbara, CA). The measurements were performed at 25°C with a scattering angle of 14.7° and electric field strength of 2.5 V/cm. Each sample was analyzed in five cycles (60 s for each cycle). The data were expressed as mean and standard deviation of three replicate samples.
2.2.5. Morphology of chi-DNA nanoparticles
The morphological examination of chi-DNA nanoparticles was performed using a JEOL 2100 Cryo transmission electron microscope (TEM) (JEOL Ltd.; Tokyo, Japan) operated at 200 kV to achieve a high image resolution. All images were recorded digitally using a Gatan UltraScan 2k × 2k CCD (Gatan, Inc.; Warrendale, PA).
2.2.6. Gel retardation assay of chi-DNA nanoparticles
The binding efficiency of chitosan with DNA was determined by agarose gel electrophoresis. A series of chi-DNA nanoparticles of various N/P ratios, prepared as described above, were loaded into the wells of a 1% agarose gel in Tris-acetate-EDTA (TAE) buffer. A 1:6 dilution of loading dye was added to each well and electrophoresis was carried out at a constant voltage in TAE buffer. The agarose gel was later soaked in ethidium bromide solution before visualizing the DNA bands under an ultraviolet transilluminator. Images were acquired using a gel-doc system (Bio-Rad Laboratories, Inc.; Hercules, CA).
2.3. Synthesis and characterization of Dox and/or chi-p53 loaded double-walled microspheres
2.3.1. Preparation of Dox and/or chi-p53 loaded double-walled microspheres
Double-walled PLLA(PLGA) microspheres loaded with Dox and/or chi-p53 were produced from our previous work [11]. Briefly, Dox solution was emulsified in 30% (w/v) PLGA/DCM at a 2% (Dox/PLGA, w/w) loading, while chi-p53 nanoparticle solution was emulsified in 5% (w/v) PLLA/DCM solution at a 0.04% (DNA/PLLA, w/w) loading. The emulsified solutions were then passed through a coaxial nozzle of the precision particle fabrication (PPF) apparatus to produce a jet of core PLGA surrounded by an annular stream containing PLLA, protected by a 0.5% (w/v) PVA carrier stream, and disrupted into uniform double-walled droplets by an ultrasonic transducer controlled by a frequency generator. The droplets were collected in 0.5% (w/v) PVA, stirred continuously for ~2 h, filtered, and rinsed with distilled water. The microspheres were freeze-dried and sterilized using ethylene oxide before performing in vitro cell culture experiments.
2.3.2. Laser scanning confocal microscopy
The intraparticle distributions of Dox and/or chi-pCy3 were examined using a TCS SP2 laser scanning confocal microscope (Leica Microsystems GmbH; Wetzlar, Germany). Microspheres were imaged using a 40× oil-immersion objective with 1.25 numerical aperture. Dox was excited with an argon laser at 488 nm, and the fluorescence emission was collected at 500 to 545 nm. The pCy3 plasmid DNA was excited with a helium-neon laser at 543 nm, and the fluorescence emission was collected at 545 to 600 nm. Optical cross-sections were taken at various depths for each sample in order to determine drug distribution at the centerline of the microspheres. Images were captured using Leica confocal software.
2.3.3. In vitro drug release
Approximately 150 mg of microspheres was suspended in 5 ml PBS in centrifuge tubes. The tubes were maintained at 37°C with shaking at 240 rpm. At selected time points, the tubes were centrifuged at 10,000 rpm for 10 min before 1 ml of supernatant was collected and 1 ml of fresh PBS was replaced. The Dox concentration was measured at excitation and emission wavelengths of 480 and 590 nm, respectively. The DNA concentration was measured using the Quant-iT PicoGreen dsDNA Kit, at excitation and emission wavelengths of 480 and 520 nm, respectively, after digestion with chitosanase and lysozyme.
2.4. Cell culture and maintenance
The cell line used was HepG2 cells (ATCC Number: HB-8065™) and was derived from the liver tissue of a 15 year old Caucasian American male with a well differentiated hepatocellular carcinoma. The cells were cultured in growth medium consisting of Dulbecco’s modified Eagle’s medium (DMEM) (Gibco; Life Technologies Corp.; Carlsbad, CA) supplemented with 10% fetal bovine serum (FBS) (HyClone; Thermo Fisher Scientific, Inc.; Logan, UT) and 1% penicillin-streptomycin (PAN-Biotech GmbH; Aidenbach, Germany) in a humidified incubator under the conditions of 37°C and 5% CO2. After reaching confluence, the cells were prepared by washing with PBS and detached from the flask with trypsin-EDTA (PAA Laboratories GmbH; Pasching, Austria).
2.5. In vitro gene expression
To determine the efficiency of chitosan to induce gene expression in HepG2 cells, the Renilla luciferase reporter gene (pCMV-pRL) was used to form chi-pRL nanoparticles at various N/P ratios. Briefly, cells were seeded onto 96-well plates at a density of 12,000 cells per well, and cultivated in 100 μl of DMEM supplemented with 10% FBS and 1% penicillin-streptomycin. After 48 h, the culture medium was replaced with 50 μl of either fresh DMEM without FBS or DMEM with 10% FBS, and 50 μl of nanoparticle solution containing 0.2 μg of pCMV-pRL plasmid DNA added to each well. Cells transfected with naked DNA were used as negative control while cells transfected with PEI-pRL nanoparticles formed at an N/P ratio of 10, the optimum N/P ratio at which PEI induced the highest gene expression in the absence of FBS, were employed as positive control. After 6 h of incubation, the cells were washed once with PBS, replaced with growth medium, and grown for another 42 h. The gene expression was then determined using a Renilla Luciferase Assay System (Promega Corp.; Madison, WI). The culture medium was removed, and the cells were washed once with PBS, before 50 μl of lysis buffer was added to each well to lyse the cells. After 15 min, 20 μl of cell lysate was mixed with 100 μl of luciferase substrate. The relative light units (RLU) were measured using a luminometer (Lumat LB9507; Berthold Technologies GmbH & Co. KG; Bad Wildbad, Germany) and normalized to protein content measured using a Coomassie Plus (Bradford) Protein Assay (Thermo Fisher Scientific, Inc.; Rockford, IL). The data were expressed as mean and standard deviation of nine replicates.
2.6. Cytotoxicity of polymeric gene carriers
The cytotoxic effects of chitosan and PEI on HepG2 cells were determined using a MTT cell viability assay. Briefly, cells were seeded onto 96-well plates at a density of 12,000 cells per well. After 48 h, the culture medium was replaced with 50 μl of fresh DMEM with 10% FBS and 50 μl of either chitosan or PEI solutions of various concentrations that correspond to N/P ratios of 1, 3, 5, 7, 10, 13, 15 and 20 (based on 0.2 μg of plasmid DNA) added to each well. For chitosan, the corresponding concentration was 2.4, 7.3, 12.2, 17.1, 24.4, 31.7, 36.6 and 48.8 μg/ml at each N/P ratio. For PEI, the corresponding concentration was 3.1, 9.4, 15.6, 21.9, 31.3, 40.7, 46.9 and 62.5 μg/ml at each N/P ratio. The untreated cells were used as control. After 6 h of incubation, the cells were washed once with PBS, replaced with growth medium, and grown for another 42 h. The cell viability was then determined using a CellTiter 96® Non-Radioactive Cell Proliferation Assay (Promega Corp.; Madison, WI). The culture medium was removed, and the cells were washed once with PBS. After that, 100 μl of growth medium and 15 μl of dye solution were added to each well, and the cells were further incubated for 4 h. During the 4 h incubation, the living cells would convert the tetrazolium component of the dye solution into a formazan product. Following that, 100 μl of solubilization solution was added to each well, and the plate was incubated at 37°C overnight to completely solubilize the formazan product. The absorbance was measured at 570 nm with a reference wavelength of 650 nm. The cell viability was calculated as [([Abs570]sample − [Abs650]sample)/([Abs570]control − [Abs650]control)] × 100%. The data were expressed as mean and standard deviation of nine replicates.
2.7. Delivery of drug and/or gene
2.7.1. Cytotoxicity of Dox and/or chi-p53
To examine the viability of HepG2 cells resulting from short-term exposure to Dox and/or chi-p53, cells were seeded onto 96-well plates at a density of 12,000 cells per well and grown for 48 h. For Dox treatment, the cells were treated with 100 μl of Dox (1, 5 and 10 μg/ml) for 3 h. For chi-p53 treatment, the cells were treated with 100 μl of chi-p53 (N/P ratio of 7; 50 μl of DMEM with 10% FBS and 50 μl of nanoparticle solution containing 0.2 μg of plasmid DNA) for 6 h. The N/P ratio of 7 was chosen based on the optimal N/P ratio to induce the highest luciferase expression. For combined Dox and chi-p53 treatment, the cells were first treated with 100 μl of chi-p53 (N/P ratio of 7; 50 μl of DMEM with 10% FBS and 50 μl of nanoparticle solution containing 0.2 μg of plasmid DNA) for 3 h, before 100 μl of Dox was added to form a final drug concentration of 2, 4, 8 and 10 μg/ml. The cells with the Dox and chi-p53 mixture were then incubated for another 3 h. The untreated cells were used as control. After the respective treatments, the cells were washed once with PBS, replaced with growth medium, and grown for a total of 48 h, before the cell viability was determined. The data were expressed as mean and standard deviation of nine replicates.
To examine the long-term cytotoxic effect of Dox and/or chi-p53 loaded double-walled microspheres, cells were seeded onto 24-well plates at a density of 75,000 cells per well. After 48 h, the culture medium was replaced with 0.5 ml of fresh growth medium containing various microspheres. The microsphere groups included a control group (blank microspheres), a drug treated group (Dox microspheres), a gene treated group (chi-p53 microspheres), and a combined drug and gene treated group (Dox and chi-p53 microspheres). The Dox microspheres were first suspended in PBS, incubated at 37°C with shaking at 240 rpm for 26 days, before they were centrifuged, washed using PBS and resuspended in growth medium for cytotoxicity study. Equivalent amounts of free Dox and/or chi-p53 corresponding to their amounts released from the microspheres after five days from in vitro release profiles were administered as free drug groups. In particular, for Dox treatment, the cells were treated with 0.5 ml of Dox (0.9 μg/ml) for 3 h. For chi-p53 treatment, the cells were treated with 0.5 ml of chi-p53 (N/P ratio of 7; 0.25 ml of DMEM with 10% FBS and 0.25 ml of nanoparticle solution containing 1 μg of plasmid DNA) for 6 h. For combined Dox and chi-p53 treatment, the cells were first treated with 0.5 ml of chi-p53 (N/P ratio of 7; 0.25 ml of DMEM with 10% FBS and 0.25 ml of nanoparticle solution containing 1 μg of plasmid DNA) for 3 h, before 0.5 ml of Dox was added to form a final drug concentration of 0.9 μg/ml. The cells with the Dox and chi-p53 mixture were then incubated for another 3 h. The untreated cells were used as control. After the respective treatments in the free drug groups, the cells were washed once with PBS, replaced with growth medium, and further incubated. The cell viability for all the groups was determined one, three and five days after the commencement of treatment. The data were expressed as mean and standard deviation of four replicates.
2.7.2. In vitro expression of p53 and caspase 3
After the short-term or long-term treatments described in Section 2.7.1, the cellular expression of p53 and caspase 3 were evaluated by using a Pierce® Colorimetric In-Cell ELISA Kit (Thermo Fisher Scientific, Inc.; Rockford, IL). Briefly, the cells were fixed for 15 min using 4% methanol-free formaldehyde, permeabilized for 15 min using 0.1% Triton X-100, quenched for endogenous peroxidase for 20 min using 1% hydrogen peroxide, and blocked for non-specific sites for 1 h using blocking buffer. The cells were incubated with either anti-p53 or anti-cleaved caspase 3 antibody overnight, washed and detected using a horseradish peroxidase (HRP)-conjugated reagent. Subsequently, the cells were washed after 1 h of incubation, before color reaction was achieved using tetramethylbenzidine (TMB substrate) and stopped using acid solution (TMB stop solution). The absorbance was measured at 450 nm. Cells treated with all reagents except the primary antibody were used as control to account for non-specific signals. Whole-cell staining of the cells was also performed using Janus Green solution to control for differences in cell plating, and the absorbance was measured at 615 nm. The expression levels were calculated as ([Abs450]sample − [Abs450]control)/[Abs615]sample and normalized to the respective control groups. The data were expressed as mean and standard deviation of three replicates.
2.7.3. Immunofluorescence staining of p53 and caspase 3
To examine the cellular expression of p53 and caspase 3 using laser scanning confocal microscope, cells were seeded onto 24-well plates with glass cover slips (75,000 cells per well) and grown for 48 h, before receiving the respective treatments described in Section 2.7.1. The immunofluorescence staining of p53 and caspase 3 in the cells was performed by using Cellomics® p53 Detection Kit (Thermo Fisher Scientific, Inc.; Rockford, IL) and Caspase 3 Activation Kit (Thermo Fisher Scientific, Inc.; Rockford, IL), respectively. Briefly, the cells were fixed for 15 min using 4% methanol-free formaldehyde, permeabilized for 15 min using 0.1% Triton X-100, and blocked for non-specific sites for 15 min using blocking buffer. The cells were incubated with either p53 or caspase 3 primary antibody, washed, and stained with Hoechst dye and DyLight™ 549 conjugated goat anti-rabbit IgG secondary antibody. The cells were washed before the cover slips were mounted onto microscope slides and visualized using a Fluoview FV1000 laser scanning confocal microscope (Olympus Corp.; Tokyo, Japan) equipped with diode and helium-neon lasers tuned to 405 and 543 nm, respectively. Briefly, cells were visualized using a 60x water-immersion objective with 1.00 numerical aperture and under the following calibrations: 4.0 μs/pixel sampling speed, line Kalman integration, 405 nm laser (Hoechst) at 449 V with transmissivity of 1.0%, and 543 nm laser (DyLight™ 549) at 807 V with transmissivity of 20.0% for p53 and at 686 V with transmissivity of 20.0% for caspase 3. The fluorescence emission of the Hoechst dye was collected at 430 to 470 nm. The fluorescence emission of the DyLight™ 549 dye was collected at above 560 nm. The parameters were used for all the samples to ensure consistency. Confocal images were captured using Olympus Fluoview software.
2.8. Statistical analysis
The comparison of means of multiple groups was done by one-way ANOVA followed by Tukey post hoc test, whereas two groups were compared by Student’s t-test. Differences were considered statistically significant when p < 0.05.
3. Results
3.1. Synthesis and characterization of chi-DNA nanoparticles
Chitosan is a linear polysaccharide which consists of randomly distributed 2-N-acetyl-2-deoxy-glucose (N-acetyl-glucosamine) and 2-amino-2-deoxy-glucose (glucosamine) residues with β-1,4-linkage. The primary amine of chitosan has a pKa value of ~6.5 [13]. Thus, at pH 5.5, most of the amino groups will be protonated, and hence solubilizing chitosan in acidic solution, while at physiological pH, most of the positive charges will be neutralized, and the hydrophobic chitosan becomes insoluble. This unique property ensures that nanoparticles formed at low pH can remain physically stable at physiological pH [12]. Furthermore, the hydrophobic nature of the nanoparticles at neutral pH suggests that chi-DNA nanoparticles may offer an effective protection to the encapsulated DNA from nuclease attack [12].
The N/P, amine-to-phosphate, ratio describes the molar quantities of positively-charged polymer and negatively-charged DNA in the formation of nanoparticle complex. This parameter affects the complex size and overall charge which are critical factors in the cellular uptake of nanoparticles. The size of chi-pRL nanoparticles was ~160 nm, and decreased slightly with increasing N/P ratio from 1 to 13 (Supplementary Data, Fig. S1a). The zeta potential of chi-pRL nanoparticles was slightly positive, which increased gradually from ~1.8 to 9.2 mV with increasing N/P ratio from 1 to 13 (Supplementary Data, Fig. S1a). The TEM image further confirmed the presence of chi-pRL nanoparticles (Supplementary Data, Fig. S1b). The degree of DNA condensation by chitosan was verified by gel retardation assay (Supplementary Data, Fig. S2). The electrophoretic mobility of DNA was completely retarded and condensed by chitosan at N/P ratios 3 and above. This indicates that chitosan could bind with DNA effectively. Overall, the small size and net positive charge of the chi-DNA nanoparticles may provide desirable properties for cellular uptake and gene delivery.
In determining the optimal N/P ratio for gene delivery, the transfection efficiency of chi-pRL nanoparticles was evaluated in HepG2 cells. As shown in Fig. 1, chitosan mediated the highest transfection efficiency of ~1.4 × 10⁴ RLU/μg protein at an N/P ratio of 7. The luciferase expression was enhanced by ~19-fold in the presence of serum than without serum. The luciferase expression induced by chitosan was not comparable to that mediated by 25-kDa branched PEI, which was higher by ~34-fold. However, with ~220-fold higher luciferase expression than naked DNA, the results validate the applicability of chitosan as an effective carrier for gene delivery.
Figure 1.
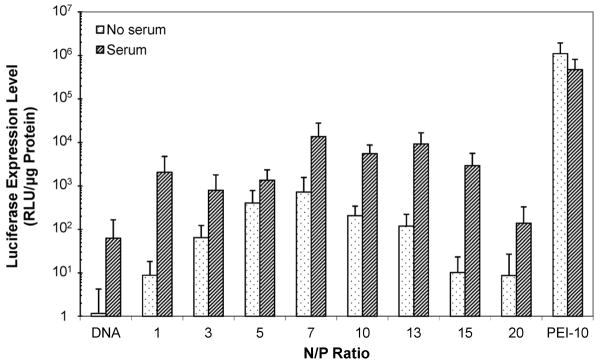
Expression of luciferase in HepG2 cells after transfection with chi-pRL nanoparticles in the absence and presence of serum at various N/P ratios from 1 to 20. The relative light units (RLU) were normalized to protein content. Data represent mean ± standard deviation, n = 9.
The cytotoxicity effects of chitosan and PEI of various concentrations that correspond to N/P ratios from 1 to 20 were evaluated in HepG2 cells. As shown in Fig. 2, chitosan remained non-toxic even at high concentrations, and results were consistent with other reported studies [12]. In contrast, PEI showed an inverse relationship between polymer concentration and cell viability. Thus, despite its high transfection efficiency, the inherent toxicity of PEI limits its clinical applications [14, 15].
Figure 2.
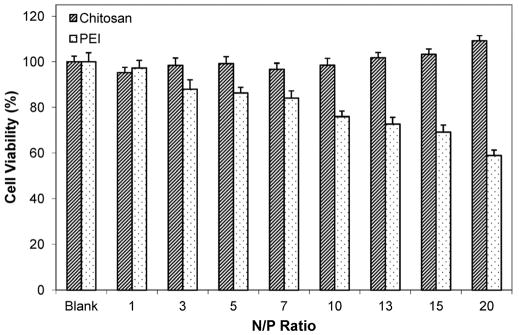
Viability of HepG2 cells after incubation with chitosan or PEI polymer solutions of various concentrations that correspond to various N/P ratios from 1 to 20. Data represent mean ± standard deviation, n = 9.
In comparison to chitosan, PEI could induce high gene expression. This has been attributed to its high buffering capacity, especially at the acidic pH found in the endosomal vesicles, which leads to trapping of positive ions by the amines (proton sponge effect), followed by subsequent endosomal rupture and escape into the cytoplasm [16]. While positive charges can facilitate cellular uptake by electrostatic interaction with negatively-charged cell membrane, PEI’s positive charge density is one critical factor that is thought to contribute to cytotoxicity [17]. Though the mechanism is not fully understood, it has been demonstrated that polycations can cause significant membrane damage [18]. The minimal cytotoxicity effect of chitosan shows its suitability for repeated or long-term administration of chi-DNA nanoparticles for gene delivery.
3.2. Free drug (FD) formulations
3.2.1. Cytotoxicity of Dox and/or chi-p53
Fig. 3 shows the growth inhibition of HepG2 cells from combined Dox and chi-p53 FD treatment in comparison to that from Dox FD or chi-p53 FD treatment. The IC50 of Dox, inhibitory concentration at which 50% of the cells are killed, was found to decrease from ~4.5 μg/ml upon Dox FD treatment to ~1.6 μg/ml upon combined Dox and chi-p53 FD treatment. In the presence of chi-p53, the IC50 of Dox could potentially be lowered by ~3-fold to achieve a comparable growth inhibition of cells.
Figure 3.
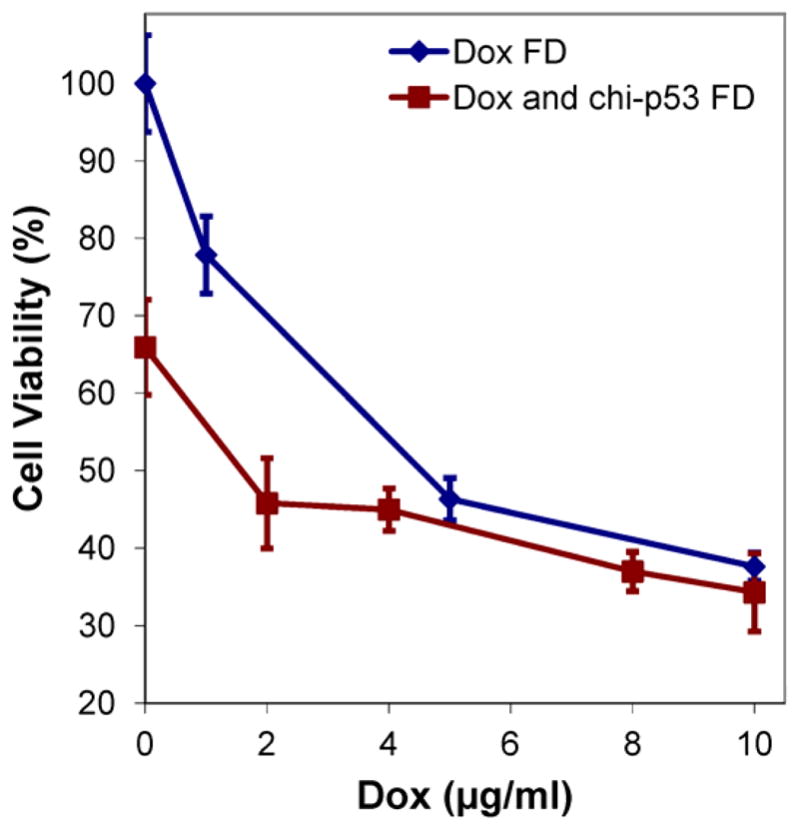
Comparison of combined Dox and chi-p53 FD treatment with Dox FD or chi-p53 FD treatment on growth inhibition of HepG2 cells. Data represent mean ± standard deviation, n = 9.
3.2.2. Expression of p53 from free drug treatments
Fig. 4a shows the expression of tumor suppressor p53 protein at 6, 24 and 48 h after the start of free drug treatments. HepG2 cells are known to express wild-type p53 gene, and the changes in expression level resulting from the treatments were reported with reference to the basal level by normalizing to the control group. For each treatment, elevated p53 expression was observed at 24 h. By 48 h, cells treated with combined Dox and chi-p53 FD resulted in a higher p53 expression than those treated with Dox FD or chi-p53 FD. The expression level of p53 from combined Dox and chi-p53 FD treatment was significantly higher than that from Dox FD treatment (p = 0.006), chi-p53 FD treatment (p = 0.005) or untreated cells (p = 0.002). Immunofluorescence staining of p53 was also performed at 48 h (Fig. 4b). Minimal p53 was expressed by untreated cells. The p53 was expressed in all treated cells, and lowest number of cells was showed by Dox FD, and combined Dox and chi-p53 FD treatments.
Figure 4.
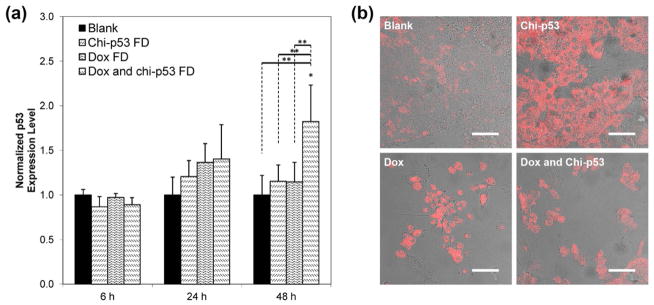
(a) Expression of p53 in HepG2 cells at 6, 24 and 48 h after commencement of treatment. The cells were either untreated or treated with Dox FD (IC50, 2 μg/ml) and/or chi-p53 FD (0.2 μg DNA). The absorbance values were normalized to cell number, followed by normalizing to the control group. Data represent mean ± standard deviation, n = 5. Statistical significance (*p < 0.05) was determined by one-way ANOVA analysis as compared to the control, while (**p < 0.05) was determined by Student’s t-test comparison between the two samples. (b) Immunofluorescence staining of p53 in HepG2 cells at 48 h after commencement of treatment. Scale bar = 50 μm.
3.2.3. Expression of caspase 3 from free drug treatments
Fig. 5a shows the expression of apoptotic caspase 3 protein at 6, 24 and 48 h after the start of free drug treatments. Since cleavage of caspase 3 occurs during apoptosis, the expression of cleaved caspase 3 is expected to be indicative of cells prepared for imminent apoptosis and reflective of cellular cytotoxicity. The changes in expression level resulted from the treatments were reported with reference to the basal level by normalizing to the control group. Caspase 3 was expressed at 6 h shortly after each treatment, with the highest shown by combined Dox and chi-p53 FD-treated cells. The expression level of caspase 3 from combined Dox and chi-p53 FD treatment was significantly higher than that from untreated cells (p = 0.025). Immunofluorescence staining of caspase 3 was also performed at 6 h (Fig. 5b). No caspase 3 was expressed in untreated cells. Significant caspase 3 was expressed in combined Dox and chi-p53 FD-treated cells.
Figure 5.
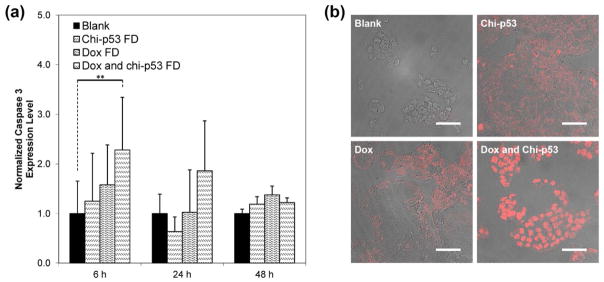
(a) Expression of caspase 3 in HepG2 cells at 6, 24 and 48 h after commencement of treatment. The cells were either untreated or treated with Dox FD (IC50, 2 μg/ml) and/or chi-p53 FD (0.2 μg DNA). The absorbance values were normalized to cell number, followed by normalizing to the control group. Data represent mean ± standard deviation, n = 5. Statistical significance (**p < 0.05) was determined by Student’s t-test comparison between the two samples. (b) Immunofluorescence staining of caspase 3 in HepG2 cells at 6 h after commencement of treatment. Scale bar = 50 μm.
3.3. Microsphere (MS) formulations
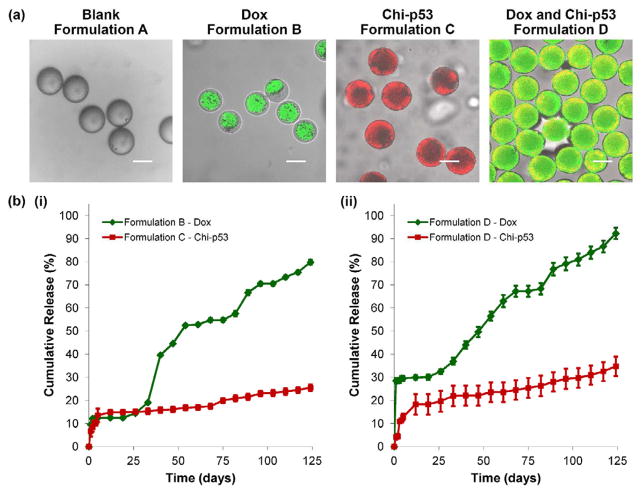
Results indicated that combined Dox and chi-p53 FD treatment achieved greater therapeutic efficiency than either Dox FD or chi-p53 FD treatment. Due to the short and acute exposure of free drugs, expression of p53 and caspase 3 occurred over a limited time period. Thus, the combined treatment could greatly benefit from the controlled and sustained release of microspheres. Based on our previous work [11], therapeutic agents could be preferentially loaded in the core phase (Dox, formulation B), or the shell phase (chi-p53, formulation C), or both core and shell phases (Dox and chi-p53, formulation D) of double-walled PLLA(PLGA) microspheres as shown in Fig. 6a. The microspheres allowed the release of chi-p53 nanoparticles first, followed by simultaneous release of Dox and chi-p53 at a near zero-order rate (Fig. 6b). In this study, formulation D microspheres were used to examine their cytotoxicity effect, and the expression of p53 and caspase 3 in HepG2 cells. The Dox MS were first suspended in PBS for 26 days to bypass the lag phase so that in combination with the chi-p53 MS, they could deliver Dox (0.9 μg/ml) and chi-p53 (1.0 μg DNA) simultaneously over a five-day period of study. Free drugs delivering equivalent amounts of Dox and chi-p53 were used as controls for comparison.
Figure 6.
(a) Transmitted light and laser scanning confocal (overlay) micrographs depicting blank and drug loaded double-walled PLLA(PLGA) microspheres. The distribution of Dox in formulations B and D microspheres is indicated in green. The distribution of chi-p53 nanoparticles in formulations C and D microspheres is indicated in red and yellow (colocalization of red and green), respectively. Scale bar = 50 μm. (b) In vitro Dox and chi-p53 release from double-walled PLLA(PLGA) microspheres.
3.3.1. Cytotoxicity of Dox and/or chi-p53 loaded microspheres
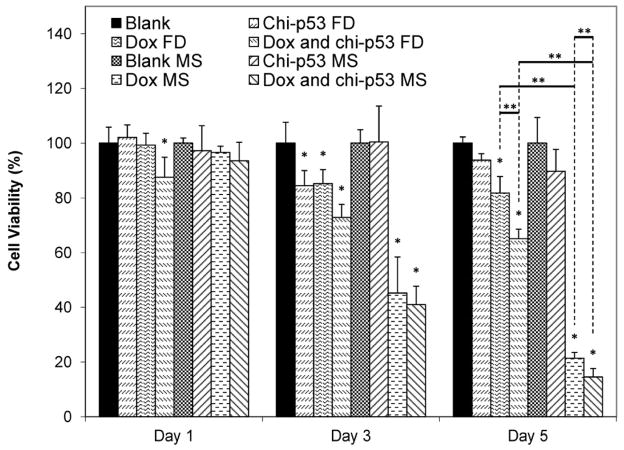
Fig. 7 shows the viability of HepG2 cells at one, three and five days after the treatment with Dox and/or chi-p53 either as free drug or microsphere formulations. For chi-p53 groups, cells treated with chi-p53 FD showed ~100% viability the day after treatment. Although cell viability decreased to ~84% after three days, cellular recovery was observed after five days. On the other hand, no significant change in cell viability was observed in cells treated with chi-p53 MS. The cell viability decreased to ~90% after five days. For Dox groups, there was greater cytotoxicity effect than chi-p53 groups. While Dox FD-treated cells showed a decrease in viability to ~85% three days post treatment, the Dox MS-treated cells displayed a more drastic drop to ~45%. Further antiproliferative effects resulted in ~82 and 21% viability after five days for Dox FD-treated and Dox MS-treated cells, respectively. For combined Dox and chi-p53 groups, cell viability immediately declined to ~88% one day after combined Dox and chi-p53 FD treatment. The decline continued to ~73%, and then to ~65% after three and five days, respectively. In contrast, cells treated with combined Dox and chi-p53 MS showed a decrease in viability from ~94, to 41, and then to only 15% after one, three and five days, respectively.
Figure 7.
Viability of HepG2 cells at one, three and five days after commencement of treatment. The groups include blank and free drug (FD) groups (blank, chi-p53 FD, Dox FD, and combined Dox and chi-p53 FD) as well as blank and drug loaded microsphere (MS) groups (blank MS, chi-p53 MS, Dox MS, and combined Dox and chi-p53 MS). The free drug groups represent equivalent amount(s) of Dox (0.9 μg/ml) and/or chi-p53 (1 μg DNA) released from the drug loaded microsphere groups after five days determined from in vitro release profiles. Data represent mean ± standard deviation, n = 4. Statistical significance (*p < 0.05) was determined by one-way ANOVA analysis as compared to the control group, while (**p < 0.05) was determined by Student’s t-test comparison between the two samples.
Overall, the antiproliferative effect was more substantial in cells treated with microspheres than those treated with free drugs. The difference in cell viability between microsphere and free drug treatments was most significant after five days when the equivalent doses were achieved in microsphere groups. Regardless of whether the cells were treated with free drugs or microspheres, the combination of Dox and chi-p53 produced greater cytotoxicity than either of the treatments alone. This implies that there is an apparent advantage of combined Dox and chi-p53 treatment. Taken together, the combined Dox and chi-p53 treatment by means of microspheres produced the greatest antiproliferative effect.
3.3.2. Expression of p53 from microsphere treatments
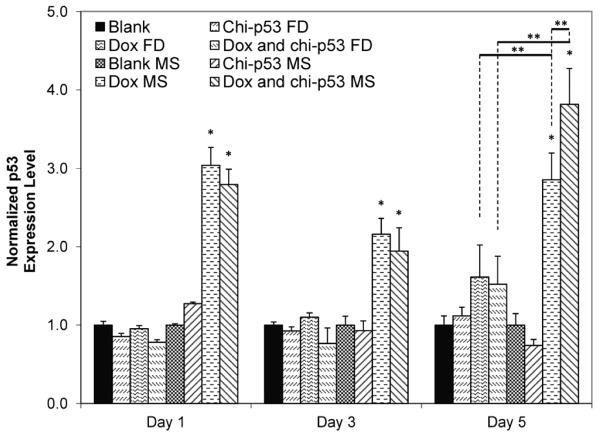
Fig. 8 shows the expression level of p53 in HepG2 cells at one, three and five days after the treatment with Dox and/or chi-p53 either as free drug or microsphere formulations. Cells treated with chi-p53 FD or chi-p53 MS did not show any significant increase in p53 expression. Only slight elevation in p53 expression was detected in chi-p53 MS-treated cells the day after treatment. For treatments with Dox or in combination with chi-p53, the free drug groups likewise had no appreciable increase in p53 expression. On the other hand, immediate up-regulation of p53 by ~3-fold could be observed one day after treatment with either Dox MS or combined Dox and chi-p53 MS. While a slight dip was observed on the third day, p53 expression levels remained high at ~2-fold greater than that of the control group. On the fifth day, p53 expression level in combined Dox and chi-p53 MS-treated cells was higher than that in Dox MS-treated cells, resulting in ~3.8-fold and 2.9-fold higher than that of the control group, respectively.
Figure 8.
Expression of p53 in HepG2 cells at one, three and five days after commencement of treatment. The groups include blank and free drug (FD) groups (blank, chi-p53 FD, Dox FD, and combined Dox and chi-p53 FD) as well as blank and drug loaded microsphere (MS) groups (blank MS, chi-p53 MS, Dox MS, and combined Dox and chi-p53 MS). The free drug groups represent equivalent amount(s) of Dox (0.9 μg/ml) and/or chi-p53 (1 μg DNA) released from the drug loaded microsphere groups after five days determined from in vitro release profiles. The absorbance values were normalized to cell number, followed by normalizing to the respective control groups. Data represent mean ± standard deviation, n = 3. Statistical significance (*p < 0.05) was determined by one-way ANOVA analysis as compared to the control group, while (**p < 0.05) was determined by Student’s t-test comparison between the two samples.
For free drug groups, p53 expression was observed one day after treatment, particularly for Dox FD-treated, and combined Dox and chi-p53 FD-treated cells as shown in Fig. 4, but it was not reflected in Fig. 8. The p53 expression in Dox FD-treated, and combined Dox and chi-p53 FD-treated cells may be dependent on the dose of Dox used. On the other hand, the continual cellular exposure to Dox contributed by the sustained release of microspheres was able to stabilize high levels of p53 expression over the five-day period. In addition, combined Dox and chi-p53 MS-treated cells demonstrated significantly higher p53 expression than Dox MS-treated cells, suggesting that the enhanced expression was contributed by the chitosan-mediated delivery of p53 plasmid DNA into the cells.
3.3.3. Expression of caspase 3 from microsphere treatments
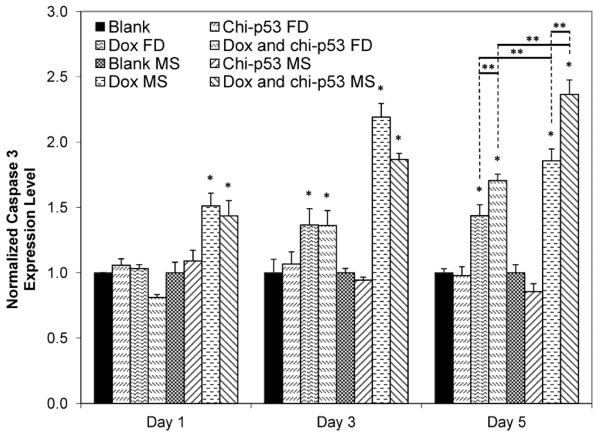
Fig. 9 shows the expression level of caspase 3 in HepG2 cells at one, three and five days after the treatment with Dox and/or chi-p53 either as free drug or microsphere formulations. Cells treated with chi-p53 FD or chi-p53 MS did not show any significant increase in caspase 3 expression. Conversely, elevated levels were detected in cells treated with Dox. Dox FD-treated cells showed at most ~1.4-fold higher caspase 3 expression than the control group by the fifth day, while combined Dox and chi-p53 FD-treated cells showed a further increase from ~1.4-fold on the third day to ~1.7-fold on the fifth day. In contrast, cells treated with microspheres demonstrated faster and greater caspase 3 activation. An immediate ~1.5-fold higher caspase 3 expression than the control group was first observed the day after treatment, after which the level continued to increase to ~2.2-fold and 1.9-fold for Dox MS-treated, and combined Dox and chi-p53 MS-treated cells, respectively. Though there was a slight decline in caspase 3 expression on the fifth day for Dox MS-treated cells, the level remained relatively high at ~1.9-fold. On the other hand, caspase 3 expression continued to increase to ~2.4-fold for combined Dox and chi-p53 MS-treated cells.
Figure 9.
Expression of caspase 3 in HepG2 cells at one, three and five days after commencement of treatment. The groups include blank and free drug (FD) groups (blank, chi-p53 FD, Dox FD, and combined Dox and chi-p53 FD) as well as blank and drug loaded microsphere (MS) groups (blank MS, chi-p53 MS, Dox MS, and combined Dox and chi-p53 MS). The free drug groups represent equivalent amount(s) of Dox (0.9 μg/ml) and/or chi-p53 (1 μg DNA) released from the drug loaded microsphere groups after five days determined from in vitro release profiles. The absorbance values were normalized to cell number, followed by normalizing to the respective control groups. Data represent mean ± standard deviation, n = 3. Statistical significance (*p < 0.05) was determined by one-way ANOVA analysis as compared to the control group, while (**p < 0.05) was determined by Student’s t-test comparison between the two samples.
Unlike the caspase 3 expression profiles exhibited by the free drug groups shown in Fig. 5, the delayed expression in Dox-treated cells in Fig. 9 may be due to the lower cellular accumulation of Dox, and hence, slow induction of apoptosis. Similar to the p53 expression profiles, further enhancement in caspase 3 expression was achieved in combined Dox and chi-p53 MS-treated cells as compared to that in Dox MS-treated cells. This indicates that the combined Dox and chi-p53 MS treatment induces greater apoptotic activation, which is likely to be facilitated by the correspondingly high p53 expression. Furthermore, the caspase 3 expression profiles are in agreement with the cytotoxicity analysis.
3.3.4. Immunofluorescence staining of p53 from microsphere treatments
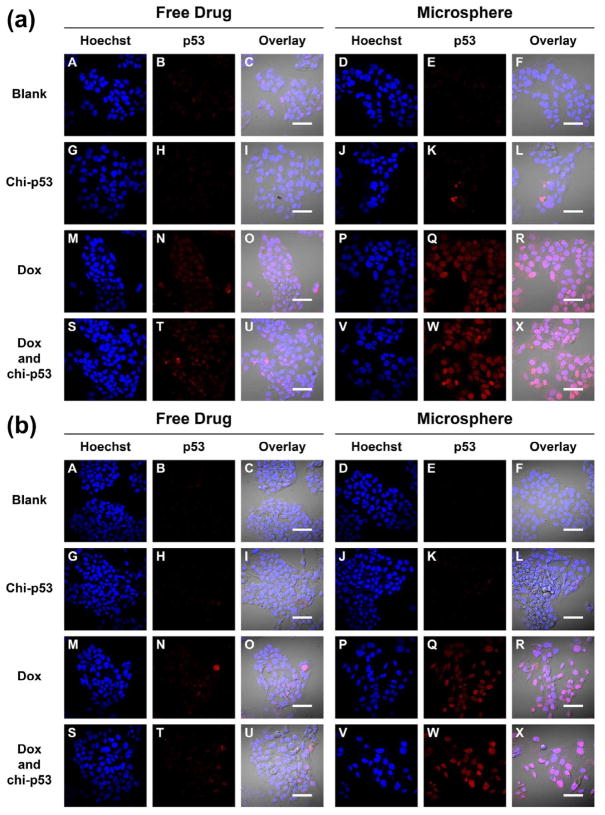
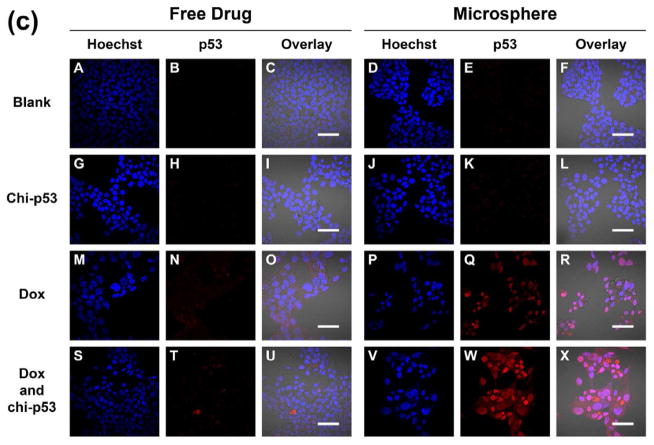
Fig. 10 shows the immunofluorescence staining of p53 in HepG2 cells one, three and five days after free drug and microsphere treatments. Apart from the occasional fluorescent spots, the intensity of p53 expression in Dox FD-treated or combined Dox and chi-p53 FD-treated cells was generally low (Fig. 10a to 10c, Panel N and T). On the other hand, the corresponding intensity in Dox MS-treated or combined Dox and chi-p53 MS-treated cells was brighter and more uniform across the cluster of cells (Fig. 10a to 10c, Panel Q and W), with the highest exhibited by combined Dox and chi-p53 MS-treated cells on the fifth day (Fig. 10c, Panel W). The results were consistent with the p53 expression profiles in Fig. 8.
Figure 10.
Immunofluorescence staining of p53 in HepG2 cells at (a) one day, (b) three days, and (c) five days after commencement of treatment. The groups include blank and free drug groups as well as blank and drug loaded microsphere groups. The cell nuclei were stained by Hoechst dye and indicated in blue. The p53 was stained by DyLight™ 549 dye and indicated in red. Scale bar = 50 μm.
During DNA damage, p53 gets imported into the nucleus, undergoes tetramerization [19], and binds and activates DNA damage-response genes [20]. It was found that the type of treatment influenced the cellular localization of p53. For Dox FD-treated cells, nuclear localization of p53 was observed on the first day, but by the fifth day, the protein was found mainly in the cytoplasm rather than in the nuclei (Fig. 10a to 10c, Panel O and U). In contrast, for Dox MS-treated, and combined Dox and chi-p53 MS-treated cells, nuclear localization of p53 was observed during the five-day period (Fig. 10a to 10c, Panel R and X). Since active p53 functions in the nuclei during DNA damage, this explains the higher p53-mediated apoptotic signaling, and hence, higher cytotoxicity for the microsphere groups (Fig. 7).
3.3.5. Immunofluorescence staining of caspase 3 from microsphere treatments
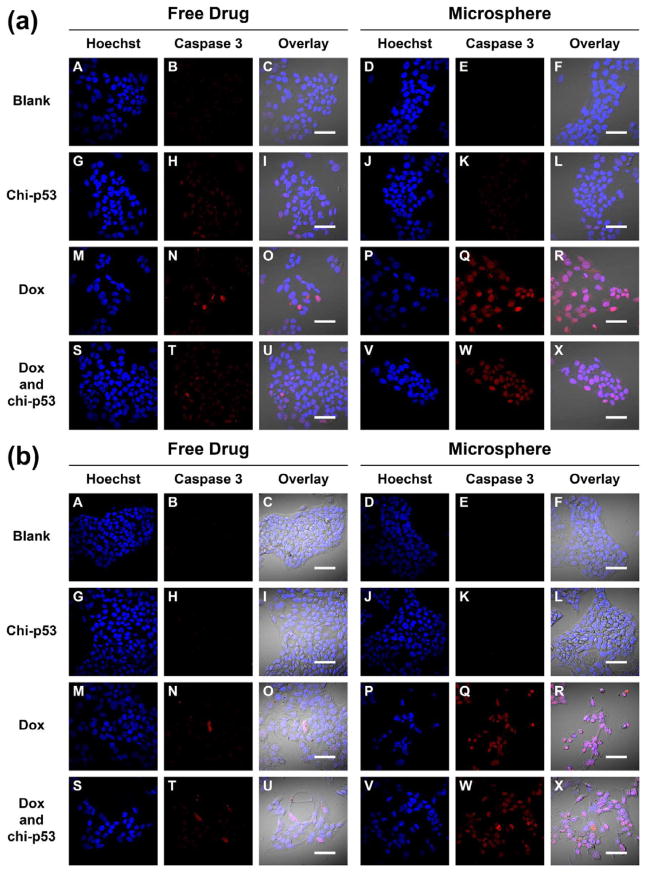
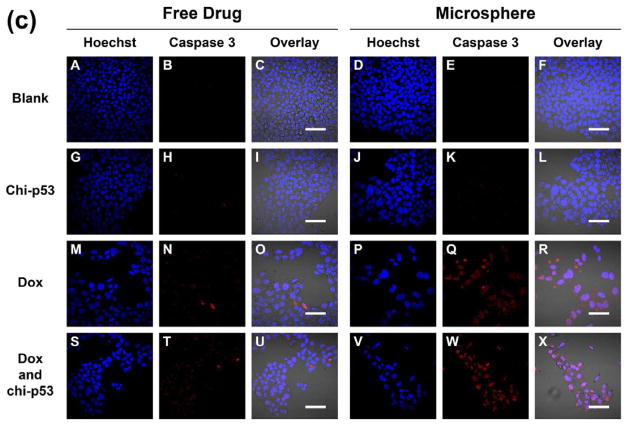
Fig. 11 shows the immunofluorescence staining of caspase 3 in HepG2 cells one, three and five days after free drug and microsphere treatments. Similar to the p53 staining, the intensity of caspase 3 expression in cells treated with free drugs was generally low with only sporadic spots of high intensity (Fig. 11a to 11c, Panel N and T). In contrast, the intensity in Dox MS-treated or combined Dox and chi-p53 MS-treated cells was brighter and more widespread (Fig. 11a to 11c, Panel Q and W), with the highest exhibited by combined Dox and chi-p53 MS-treated cells on the fifth day (Fig. 11c, Panel W). The results were consistent with the caspase 3 expression profiles in Fig. 9.
Figure 11.
Immunofluorescence staining of caspase 3 in HepG2 cells at (a) one day, (b) three days, and (c) five days after commencement of treatment. The groups include blank and free drug groups as well as blank and drug loaded microsphere groups. The cell nuclei were stained by Hoechst dye and indicated in blue. The caspase 3 was stained by DyLight™ 549 dye and indicated in red. Scale bar = 50 μm.
As a critical apoptosis executioner, caspase 3 becomes activated and then enters into the nucleus to cleave its nuclear substrates [21, 22], resulting in characteristic apoptotic nuclear changes such as DNA fragmentation, chromatin condensation and nuclear disruption [23–25]. Particularly, for the combined Dox and chi-p53 treatment, a majority of the cells were abnormally-shaped, and had shrunken and strongly-stained nuclei (Fig. 11c, Panel X).
4. Discussion
The use of combination therapies has been proven effective for the treatment of cancer. While chemotherapeutic drugs are usually associated with undesirable side effects, the administration of multiple agents directed at different targets and exhibiting different toxicity profiles can enhance the therapeutic index either in the form of better efficacy or in the form of comparable efficacy and reduced toxicity [26]. Among various combination therapies, studies on chemotherapy and p53 gene therapy are of particular interest [5, 6]. In this study, the aim is to evaluate the therapeutic efficiency of Dox and/or chi-p53 when released in a controlled and sustained manner from double-walled microspheres, and to compare them with those from free drugs.
It is evident that free drug administration can only provide a short and acute cytotoxic effect on the cancer cells. Cellular recovery was observed five days post treatment with free Dox, free chi-p53, or their combination (Fig. 7) while the extent of apoptosis from caspase 3 expression was relatively weak (Fig. 9). These observations are indicative of the possible limitations in systemic administration of drugs and are consistent with what is observed in clinical practice [9, 10]. The microsphere formulations, on the other hand, can potentially impose greater cytotoxicity or use lower dosage of drug to achieve a comparable cytotoxicity level in the cancer cells. Notably, on the third day before the prescribed dose of Dox was reached, there was already more than 50% decrease in cell viability after Dox MS or combined Dox and chi-p53 MS treatment (Fig. 7). By the fifth day, the viability of cells treated with Dox MS or combined Dox and chi-p53 MS was significantly lower than those treated with free drugs (Fig. 7). Similar findings were observed in other cancer cells treated with drug-loaded microspheres [27, 28].
Dox is a common drug used in the management of HCC that causes DNA damage by intercalating with the base pairs of DNA and inhibiting nucleic acid replication [29, 30], and kills cancer cells mainly by apoptosis [31]. Increased production of reactive oxygen species is also associated with Dox-treated cells [32]. These cellular stresses can activate p53 and halt cell cycle progression. Here, the continual exposure of cancer cells to Dox via microspheres could produce a long-term stressful environment and enable significantly higher and sustainable p53 expression than free Dox (Fig. 8). The upregulation of endogenous p53 in Dox-treated cells has a critical role in apoptosis because of its involvement in DNA damage-induced G1 arrest, apoptosis [33–35], and DNA repair [36]. The appearance of the G1 arrest parallels p53 nuclear accumulation [31]. The arrest is believed to allow DNA repair to maintain chromosomal fidelity for survival [37]. Although the upregulation of p53 does not always induce apoptosis [38], the corresponding trend of increasing caspase 3 expression was observed over the five-day incubation with Dox MS (Fig. 9). Similar trends of cellular apoptosis were observed for other drug-loaded microspheres [9, 10].
The p53 gene is frequently mutated in HCC, and most HCCs have defects in the p53-mediated apoptotic pathway although they carry wild-type p53 [39]. The effective restoration of the p53 function could allow reestablishment of normal cell growth control and restore appropriate response to chemotherapeutic drugs [35, 40–42]. It is proposed that Dox-mediated apoptosis may be further enhanced if p53 expression is promoted. Chi-p53 promoted growth inhibition when combined with Dox, regardless of the type of formulation (Fig. 7). Analysis of p53 expression suggests that the higher level in combined Dox and chi-p53 MS-treated cells than that in Dox MS-treated cells on the fifth day was contributed by the exogenous p53 plasmid DNA from chitosan nanoparticles (Fig. 8). The higher p53 expression also resulted in a higher caspase 3 expression in the combined Dox and chi-p53 MS-treated cells than that in the Dox MS-treated cells on the fifth day (Fig. 9).
Chitosan was shown to be effective in delivering the plasmid DNA and inducing luciferase expression in HepG2 cells (Fig. 1). However, when the luciferase gene was replaced with the p53 gene, an expected increase in p53 expression could not be detected (Fig. 8), most likely because p53 expression is tightly regulated by MDM2 (murine double minute 2) [43, 44]. In normal unstressed cells, p53 is an unstable protein with a short half-life that exists at very low cellular levels owing to continuous degradation largely mediated by MDM2. Hence, in the event of over-expression of p53 under unstressed conditions, MDM2 will facilitate its degradation back to the basal level. Conversely, the presence of Dox-induced DNA damage can lead to rapid stabilization of p53 via a block of its degradation.
Here, we make use of the advantages of double-walled microspheres to allow a simultaneous release of Dox and chi-p53 at near zero-order rates [11]. Zero-order release rates are advantageous because a constant quantity of drug is being delivered with respect to time. If drug elimination is also at the same constant rate, the drug concentration can, in theory, be maintained within the ideal therapeutic window for maximum efficacy. Overall, we demonstrated that the simultaneous delivery of Dox and chi-p53 at near zero-order rates via double-walled microspheres was able to enhance growth inhibition, provide sustained p53 expression and increase apoptosis in HepG2 cells.
5. Conclusions
In this study, the simultaneous delivery of Dox and chi-p53 through sustained release from double-walled microspheres achieved a higher therapeutic efficiency in suppressing proliferation of HepG2 cells when compared to Dox- or chi-p53-loaded microspheres, or the corresponding free drugs. Moreover, cellular expression of tumor suppressor p53 and apoptotic caspase 3 proteins were maintained at elevated levels during the treatment period. These findings suggest that double-walled microspheres can be an effective carrier to deliver drug and gene simultaneously for improved cancer therapy.
Supplementary Material
Figure S1: (a) Particle size and zeta potential of chi-pRL nanoparticles. Particle sizes for chi-pRL nanoparticles with N/P ratios from 1 to 13 were plotted as a column chart. Zeta potentials for DNA solution and chi-pRL nanoparticles with N/P ratios from 1 to 13 were plotted as a line chart. Data represent mean ± standard deviation, n = 3. (b) Transmission electron micrograph of chi-pRL nanoparticles. Scale bar = 100 nm.
Figure S2: Gel retardation assay of chi-pRL nanoparticles to determine the binding efficiency of chitosan with DNA. Lane 1 contains 1 kb DNA ladder. Lane 2 contains naked DNA. Lanes 3 to 10 contain chi-pRL nanoparticles with N/P ratios 1, 3, 5, 7, 10, 13, 15 and 20, respectively. All samples were electrophorezed on a 1% agarose gel, stained with ethidium bromide solution and visualized under a ultraviolet transilluminator.
Acknowledgments
The authors acknowledge the funding support from the National Medical Research Council (NMRC, Singapore) and National Institutes of Health (NIH, USA) under the grant numbers NMRC EDG11may084 and 1R01EB005181, respectively. Qingxing Xu acknowledges the scholarship support from Agency for Science, Technology and Research (A*STAR, Singapore) for NUS-UIUC Joint Ph.D. Program.
Footnotes
Publisher's Disclaimer: This is a PDF file of an unedited manuscript that has been accepted for publication. As a service to our customers we are providing this early version of the manuscript. The manuscript will undergo copyediting, typesetting, and review of the resulting proof before it is published in its final citable form. Please note that during the production process errors may be discovered which could affect the content, and all legal disclaimers that apply to the journal pertain.
References
- 1.Vogelstein B, Lane D, Levine AJ. Surfing the p53 network. Nature. 2000;408:307–10. doi: 10.1038/35042675. [DOI] [PubMed] [Google Scholar]
- 2.Vousden KH, Lane DP. p53 in health and disease. Nat Rev Mol Cell Biol. 2007;8:275–83. doi: 10.1038/nrm2147. [DOI] [PubMed] [Google Scholar]
- 3.Olivier M, Eeles R, Hollstein M, Khan MA, Harris CC, Hainaut P. The IARC TP53 database: new online mutation analysis and recommendations to users. Hum Mutat. 2002;19:607–14. doi: 10.1002/humu.10081. [DOI] [PubMed] [Google Scholar]
- 4.Xu L, Pirollo KF, Chang EH. Tumor-targeted p53-gene therapy enhances the efficacy of conventional chemo/radiotherapy. J Control Release. 2001;74:115–28. doi: 10.1016/s0168-3659(01)00324-8. [DOI] [PubMed] [Google Scholar]
- 5.Wiradharma N, Tong YW, Yang YY. Self-assembled oligopeptide nanostructures for co-delivery of drug and gene with synergistic therapeutic effect. Biomaterials. 2009;30:3100–9. doi: 10.1016/j.biomaterials.2009.03.006. [DOI] [PubMed] [Google Scholar]
- 6.Lu X, Wang QQ, Xu FJ, Tang GP, Yang WT. A cationic prodrug/therapeutic gene nanocomplex for the synergistic treatment of tumors. Biomaterials. 2011;32:4849–56. doi: 10.1016/j.biomaterials.2011.03.022. [DOI] [PubMed] [Google Scholar]
- 7.Thomas MB, Zhu AX. Hepatocellular carcinoma: the need for progress. J Clin Oncol. 2005;23:2892–9. doi: 10.1200/JCO.2005.03.196. [DOI] [PubMed] [Google Scholar]
- 8.Choi DH, Park CH, Kim IH, Chun HJ, Park K, Han DK. Fabrication of core-shell microcapsules using PLGA and alginate for dual growth factor delivery system. J Control Release. 2010;147:193–201. doi: 10.1016/j.jconrel.2010.07.103. [DOI] [PubMed] [Google Scholar]
- 9.Nie H, Dong Z, Arifin DY, Hu Y, Wang CH. Core/shell microspheres via coaxial electrohydrodynamic atomization for sequential and parallel release of drugs. J Biomed Mater Res A. 2010;95:709–16. doi: 10.1002/jbm.a.32867. [DOI] [PubMed] [Google Scholar]
- 10.Nie H, Fu Y, Wang CH. Paclitaxel and suramin-loaded core/shell microspheres in the treatment of brain tumors. Biomaterials. 2010;31:8732–40. doi: 10.1016/j.biomaterials.2010.07.080. [DOI] [PubMed] [Google Scholar]
- 11.Xu Q, Xia Y, Wang CH, Pack DW. Monodisperse double-walled microspheres loaded with chitosan-p53 nanoparticles and doxorubicin for combined gene therapy and chemotherapy. J Control Release. 2012;163:130–5. doi: 10.1016/j.jconrel.2012.08.032. [DOI] [PMC free article] [PubMed] [Google Scholar]
- 12.Mao HQ, Roy K, Troung-Le VL, Janes KA, Lin KY, Wang Y, et al. Chitosan-DNA nanoparticles as gene carriers: synthesis, characterization and transfection efficiency. J Control Release. 2001;70:399–421. doi: 10.1016/s0168-3659(00)00361-8. [DOI] [PubMed] [Google Scholar]
- 13.Liu W, Sun S, Cao Z, Zhang X, Yao K, Lu WW, et al. An investigation on the physicochemical properties of chitosan/DNA polyelectrolyte complexes. Biomaterials. 2005;26:2705–11. doi: 10.1016/j.biomaterials.2004.07.038. [DOI] [PubMed] [Google Scholar]
- 14.Kircheis R, Schüller S, Brunner S, Ogris M, Heider KH, Zauner W, et al. Polycation-based DNA complexes for tumor-targeted gene delivery in vivo. J Gene Med. 1999;1:111–20. doi: 10.1002/(SICI)1521-2254(199903/04)1:2<111::AID-JGM22>3.0.CO;2-Y. [DOI] [PubMed] [Google Scholar]
- 15.Ogris M, Brunner S, Schüller S, Kircheis R, Wagner E. PEGylated DNA/transferrin-PEI complexes: reduced interaction with blood components, extended circulation in blood and potential for systemic gene delivery. Gene Ther. 1999;6:595–605. doi: 10.1038/sj.gt.3300900. [DOI] [PubMed] [Google Scholar]
- 16.Köping-Höggård M, Tubulekas I, Guan H, Edwards K, Nilsson M, Vårum KM, et al. Chitosan as a nonviral gene delivery system. Structure-property relationships and characteristics compared with polyethylenimine in vitro and after lung administration in vivo. Gene Ther. 2001;8:1108–21. doi: 10.1038/sj.gt.3301492. [DOI] [PubMed] [Google Scholar]
- 17.Fischer D, Li Y, Ahlemeyer B, Krieglstein J, Kissel T. In vitro cytotoxicity testing of polycations: influence of polymer structure on cell viability and hemolysis. Biomaterials. 2003;24:1121–31. doi: 10.1016/s0142-9612(02)00445-3. [DOI] [PubMed] [Google Scholar]
- 18.Choksakulnimitr S, Masuda S, Tokuda H, Takakura Y, Hashida M. In vitro cytotoxicity of macromolecules in different cell culture systems. J Control Release. 1995;34:233–41. [Google Scholar]
- 19.el-Deiry WS, Kern SE, Pietenpol JA, Kinzler KW, Vogelstein B. Definition of a consensus binding site for p53. Nat Genet. 1992;1:45–9. doi: 10.1038/ng0492-45. [DOI] [PubMed] [Google Scholar]
- 20.Jimenez GS, Khan SH, Stommel JM, Wahl GM. p53 regulation by post-translational modification and nuclear retention in response to diverse stresses. Oncogene. 1999;18:7656–65. doi: 10.1038/sj.onc.1203013. [DOI] [PubMed] [Google Scholar]
- 21.Kamada S, Kikkawa U, Tsujimoto Y, Hunter T. Nuclear translocation of caspase-3 is dependent on its proteolytic activation and recognition of a substrate-like protein(s) J Biol Chem. 2005;280:857–60. doi: 10.1074/jbc.C400538200. [DOI] [PubMed] [Google Scholar]
- 22.Takemoto K, Nagai T, Miyawaki A, Miura M. Spatio-temporal activation of caspase revealed by indicator that is insensitive to environmental effects. J Cell Biol. 2003;160:235–43. doi: 10.1083/jcb.200207111. [DOI] [PMC free article] [PubMed] [Google Scholar]
- 23.Earnshaw WC, Martins LM, Kaufmann SH. Mammalian caspases: structure, activation, substrates, and functions during apoptosis. Annu Rev Biochem. 1999;68:383–424. doi: 10.1146/annurev.biochem.68.1.383. [DOI] [PubMed] [Google Scholar]
- 24.Fischer U, Jänicke RU, Schulze-Osthoff K. Many cuts to ruin: a comprehensive update of caspase substrates. Cell Death Differ. 2003;10:76–100. doi: 10.1038/sj.cdd.4401160. [DOI] [PMC free article] [PubMed] [Google Scholar]
- 25.Sahara S, Aoto M, Eguchi Y, Imamoto N, Yoneda Y, Tsujimoto Y. Acinus is a caspase-3-activated protein required for apoptotic chromatin condensation. Nature. 1999;401:168–73. doi: 10.1038/43678. [DOI] [PubMed] [Google Scholar]
- 26.Greco F, Vicent MJ. Combination therapy: opportunities and challenges for polymer-drug conjugates as anticancer nanomedicines. Adv Drug Deliv Rev. 2009;61:1203–13. doi: 10.1016/j.addr.2009.05.006. [DOI] [PubMed] [Google Scholar]
- 27.Muvaffak A, Gurhan I, Hasirci N. Prolonged cytotoxic effect of colchicine released from biodegradable microspheres. J Biomed Mater Res B Appl Biomater. 2004;71:295–304. doi: 10.1002/jbm.b.30092. [DOI] [PubMed] [Google Scholar]
- 28.Lin R, Ng LS, Wang CH. In vitro study of anticancer drug doxorubicin in PLGA-based microparticles. Biomaterials. 2005;26:4476–85. doi: 10.1016/j.biomaterials.2004.11.014. [DOI] [PubMed] [Google Scholar]
- 29.Momparler RL, Karon M, Siegel SE, Avila F. Effect of adriamycin on DNA, RNA, and protein synthesis in cell-free systems and intact cells. Cancer Res. 1976;36:2891–5. [PubMed] [Google Scholar]
- 30.Hortobágyi GN. Anthracyclines in the treatment of cancer. An overview Drugs. 1997;54:1–7. doi: 10.2165/00003495-199700544-00003. [DOI] [PubMed] [Google Scholar]
- 31.Lee TK, Lau TC, Ng IO. Doxorubicin-induced apoptosis and chemosensitivity in hepatoma cell lines. Cancer Chemother Pharmacol. 2002;49:78–86. doi: 10.1007/s00280-001-0376-4. [DOI] [PubMed] [Google Scholar]
- 32.Tsang WP, Chau SP, Kong SK, Fung KP, Kwok TT. Reactive oxygen species mediate doxorubicin induced p53-independent apoptosis. Life Sci. 2003;73:2047–58. doi: 10.1016/s0024-3205(03)00566-6. [DOI] [PubMed] [Google Scholar]
- 33.Clarke AR, Purdie CA, Harrison DJ, Morris RG, Bird CC, Hooper ML, et al. Thymocyte apoptosis induced by p53-dependent and independent pathways. Nature. 1993;362:849–52. doi: 10.1038/362849a0. [DOI] [PubMed] [Google Scholar]
- 34.Lotem J, Sachs L. Hematopoietic cells from mice deficient in wild-type p53 are more resistant to induction of apoptosis by some agents. Blood. 1993;82:1092–6. [PubMed] [Google Scholar]
- 35.Lowe SW, Ruley HE, Jacks T, Housman DE. p53-dependent apoptosis modulates the cytotoxicity of anticancer agents. Cell. 1993;74:957–67. doi: 10.1016/0092-8674(93)90719-7. [DOI] [PubMed] [Google Scholar]
- 36.Bakalkin G, Yakovleva T, Selivanova G, Magnusson KP, Szekely L, Kiseleva E, et al. p53 binds single-stranded DNA ends and catalyzes DNA renaturation and strand transfer. Proc Natl Acad Sci USA. 1994;91:413–7. doi: 10.1073/pnas.91.1.413. [DOI] [PMC free article] [PubMed] [Google Scholar]
- 37.Hartwell L. Defects in a cell cycle checkpoint may be responsible for the genomic instability of cancer cells. Cell. 1992;71:543–6. doi: 10.1016/0092-8674(92)90586-2. [DOI] [PubMed] [Google Scholar]
- 38.Slee EA, O’Connor DJ, Lu X. To die or not to die: how does p53 decide? Oncogene. 2004;23:2809–18. doi: 10.1038/sj.onc.1207516. [DOI] [PubMed] [Google Scholar]
- 39.Guan YS, La Z, Yang L, He Q, Li P. p53 gene in treatment of hepatic carcinoma: status quo. World J Gastroenterol. 2007;13:985–92. doi: 10.3748/wjg.v13.i7.985. [DOI] [PMC free article] [PubMed] [Google Scholar]
- 40.Lowe SW, Bodis S, McClatchey A, Remington L, Ruley HE, Fisher DE, et al. p53 status and the efficacy of cancer therapy in vivo. Science. 1994;266:807–10. doi: 10.1126/science.7973635. [DOI] [PubMed] [Google Scholar]
- 41.Galmarini CM, Falette N, Tabone E, Levrat C, Britten R, Voorzanger-Rousselot N, et al. Inactivation of wild-type p53 by a dominant negative mutant renders MCF-7 cells resistant to tubulin-binding agent cytotoxicity. Br J Cancer. 2001;85:902–8. doi: 10.1054/bjoc.2001.2017. [DOI] [PMC free article] [PubMed] [Google Scholar]
- 42.Galmarini CM, Clarke ML, Falette N, Puisieux A, Mackey JR, Dumontet C. Expression of a non-functional p53 affects the sensitivity of cancer cells to gemcitabine. Int J Cancer. 2002;97:439–45. doi: 10.1002/ijc.1628. [DOI] [PubMed] [Google Scholar]
- 43.Millau JF, Bastien N, Drouin R. P53 transcriptional activities: a general overview and some thoughts. Mutat Res. 2009;681:118–33. doi: 10.1016/j.mrrev.2008.06.002. [DOI] [PubMed] [Google Scholar]
- 44.Whibley C, Pharoah PD, Hollstein M. p53 polymorphisms: cancer implications. Nat Rev Cancer. 2009;9:95–107. doi: 10.1038/nrc2584. [DOI] [PubMed] [Google Scholar]
Associated Data
This section collects any data citations, data availability statements, or supplementary materials included in this article.
Supplementary Materials
Figure S1: (a) Particle size and zeta potential of chi-pRL nanoparticles. Particle sizes for chi-pRL nanoparticles with N/P ratios from 1 to 13 were plotted as a column chart. Zeta potentials for DNA solution and chi-pRL nanoparticles with N/P ratios from 1 to 13 were plotted as a line chart. Data represent mean ± standard deviation, n = 3. (b) Transmission electron micrograph of chi-pRL nanoparticles. Scale bar = 100 nm.
Figure S2: Gel retardation assay of chi-pRL nanoparticles to determine the binding efficiency of chitosan with DNA. Lane 1 contains 1 kb DNA ladder. Lane 2 contains naked DNA. Lanes 3 to 10 contain chi-pRL nanoparticles with N/P ratios 1, 3, 5, 7, 10, 13, 15 and 20, respectively. All samples were electrophorezed on a 1% agarose gel, stained with ethidium bromide solution and visualized under a ultraviolet transilluminator.


