

Abstract
The optimal immune response to malaria infection comprises rapid induction of inflammatory responses promptly counteracted by regulatory mechanisms to prevent immunopathology. To evaluate the role of dendritic cells (DC) in the balance of parasite-induced inflammatory/anti-inflammatory mechanisms, we studied the activity of monocyte-derived dendritic cells (MDDC), previously exposed to soluble extracts of Plasmodium falciparum-infected red blood cells (PfSE), in the differentiation of CD4 cells isolated from donors never exposed to malaria infection. We show that MDDC exposed to PfSE are extremely efficient to induce a contemporary differentiation of TH1 effector cells and T regulatory (Treg) cells in CD4 T cells even when exposed to low concentrations of parasitic extracts. Treg cells induced by MDDC infected with PfSE (MDDC-PfSE) produce transforming growth factor beta (TGF-β) and interleukin 10 (IL-10) and are endowed with strong suppressive properties. They also show phenotypical and functional peculiarities, such as the contemporary expression of markers of Treg and TH1 differentiation and higher sensitivity to TLR4 ligands both inducing an increasing production of suppressive cytokines. On the whole, our data indicate that MDDC exposed to PfSE orchestrate a well-balanced immune response with timely differentiation of TH1 and Treg cells in CD4 cells from nonimmune donors and suggest that, during the infection, the role of MDCC could be particularly relevant in low-parasitemia conditions.
INTRODUCTION
Infection with the malaria parasite Plasmodium falciparum affects ∼200 million people each year, causing 655,000 fatal cases per year (1). P. falciparum is estimated to be as old as humans (2), and it is highly probable that it coevolved with the human immune system. The coadaptation of the parasite and the human host has ensured that the human immune system does not efficiently clear the parasite, as periodic reinfections or chronic, low levels of parasitemia are needed to maintain acquired immunity to malaria (premunition) (3). Presumably, the persistence of the parasite gives some advantage to the host, perhaps by reducing the risk of severe complications (4). Immunity to infection with a blood-stage Plasmodium parasite is critically dependent on the type 1 cytokine gamma interferon (IFN-γ) and requires coordinate and timely innate and adaptive response involving dendritic cells, NK cells, and CD4+ T cells and B cells (5, 6). Therefore, the host's ability to regulate both the magnitude and the timing of antiparasitic inflammatory responses avoiding the development of life-threatening immune-mediated pathology represents the key to the successful resolution of an infection.
Dendritic cells (DC) are actively engaged in the earliest phase of infection and are endowed with a higher capacity to migrate into the T-cell area of the splenic white pulp than other major antigen-presenting cells (APCs), like monocytes/macrophages and B cells (7, 8). Although conflicting data were reported about the ability of parasites and/or parasite products to induce the full maturation process of dendritic cells (9–12), DC have been clearly involved in TH1 differentiation of CD4 cells and also in malaria pathogenesis (13).
T regulatory (Treg) cells have a key role in maintaining the balance between immune and inflammatory response in the course of malaria infection, and their potential role in modifying the outcome of infection has become increasingly recognized (reviewed in reference 14).
In spite of conflicting data reported in murine malaria whereby these cells have been associated either with increased (15) or delayed (16) parasite growth, in human malaria infections, the expansion of Treg cells correlates with high parasitemia levels and low proinflammatory responses (17). Marked seasonal variations in the number of both Treg and TH1 effector cells were found in healthy malaria-exposed individuals in regions of malaria endemicity (18), further suggesting that the ability to downregulate inflammatory responses, once parasitemia is under control, is crucial to avoid immune-mediated pathology. The molecular mechanisms underlying the expansion of the Treg cell population induced by P. falciparum-infected red blood cells (iRBC) and/or P. falciparum soluble extracts (PfSE) have been partially elucidated. Both antigen-specific activation and T-cell receptor (TCR)-independent mechanisms contribute to parasite-induced Treg cell expansion (19, 20) in a dose-dependent manner (19, 21). Previous studies approaching the origin and the mechanisms of expansion of Treg cells in healthy donors have been performed in peripheral blood mononuclear cells (PBMC) using monocytes as APCs. In order to evaluate the role of DCs in the balance of parasite-induced inflammatory/anti-inflammatory mechanisms, we studied the role of myeloid dendritic cells exposed to PfSE in the differentiation of CD4 cells obtained from donors never exposed to malaria infection. We found that, despite their semimature phenotype, monocyte-derived dendritic cells (MDDC) exposed to PfSE (MDDC-PfSE) orchestrate a well-balanced immune response with timely differentiation of TH1 and Treg cells from CD4 cells. A subset of Treg cells also express a TH1 phenotype, with contemporary expression of Tbet, Foxp3, and IFN-γ production.
MATERIALS AND METHODS
Antibodies and reagents.
Fluorescein isothiocyanate (FITC)–anti-CD25, phycoerythrin (PE)–anti-CD25, PerCP–anti-CD4, FITC–anti-CD4, FITC–anti-CD80, APC–anti-CD86, PE–anti-CD127, and PE–anti-HLA-DR antibodies were obtained from BD Biosciences Pharmingen (San Jose, CA); APC–anti-Foxp3 (FJK-16S) staining kits were from eBioscience (San Diego, CA). PerCP–anti-Tbet, PerCP–anti-IFN-γ antibodies were from eBioscience (San Diego, CA). CD4+ T cell and CD25+ cell separation kits were obtained by Miltenyi Biotech (Bergisch Gladbach, Germany). Rat anti-huTLR4 monoclonal antibody (MAb) and mouse anti-huTLR5 monoclonal antibody were obtained from Santa Cruz Biotechnology (Santa Cruz, CA). FITC secondary antibody was obtained from Sigma-Aldrich (Milano, Italy). Flagellin from S. enterica serovar Typhimurium and lipopolysaccharide (LPS) were purchased from InvivoGen (San Giuliano Milanese, Milano, Italy). RPMI 1640, antibiotics (penicillin-streptomycin), l-glutamine, and heat-inactivated fetal bovine serum were purchased from Celbio (Pero, Italy) and used for cell culture. Phorbol myristate acetate (PMA), ionomycin calcium salt, and brefeldin A (BFA) were from Sigma.
Donors.
Buffy coats from donors never exposed to malaria infection were supplied by Transfusional Center of Azienda Ospedaliera Careggi (Firenze, Italy).
P. falciparum and uninfected red blood cell (uRBC) extract preparation.
A laboratory strain (3D7) of P. falciparum was cultured in group O+ human RBCs suspended in RPMI medium 1640 (Gibco) containing 10% heat-inactivated O+ human serum. Schizont-stage parasites were purified by sedimentation through 60% Percoll. Mature schizont-infected erythrocytes were lysed through three freeze-thaw cycles (−156°C and 37°C). The schizont-soluble fraction was obtained by repeated centrifugations of the lysate at 13,000 rpm, and protein concentration was determined by Bio-Rad assay in 0.2 μ Millex-filtered supernatants. A total of 10 μg of PfSE was obtained by approximately 105 infected RBCs (iRBCs). Uninfected O+ RBCs were always obtained from the same donors in each experiment. They were treated according to the same protocol as infected O+ RBCs. PfSE were titrated with PBMC from semi-immune adults. An optimal induction of activation assessed by proliferation of PBMC and IFN-γ production was obtained with 10 μg/ml (22).
All cultures of iRBC were tested for micoplasma using the MycoAlert mycoplasma detection kit (Lonza, Milano). Only negative cultures were processed.
PfSE or uRBC lysates were also tested for the ability to activate TLR2, TLR4 by using HEK-293 cells transfected with huTLR2, the TLR4 gene (InvivoGen), and the pNiFty2-luc NF-κB-inducible reporter plasmid (InvivoGen) as a reporter gene. We did not evidence NF-κB activation by PfSE or uRBC lysates (uRBCL) in the range of concentrations used in any TLR assay.
Isolation of cellular populations. (i) PBMC.
Peripheral blood mononuclear cells (PBMC) were isolated from buffy coats of healthy donors by gradient centrifugation using Ficoll-Paque (GE Healthcare Italia, Milan, Italy), according to the manufacturer's recommendations. CD14+ cells were obtained through positive selection with anti-CD14 antibody-coupled beads (Miltenyi Biotech, Bergisch Gladbach, Germany) according to the manufacturer's recommendations.
(ii) Dendritic cells.
MDDC were obtained as described in reference 23. Briefly, CD14+ cells were cultured in the presence of 20 ng/ml of human recombinant (HR) interleukin 4 (IL-4) and 50 ng/ml of HR granulocyte-macrophage colony-stimulating factor (GM-CSF) (R&D) for 5 days at 37°C in a humidified chamber with 5% CO2. Cells were washed with cold phosphate-buffered saline (PBS), harvested, and then stimulated with PfSE or uRBCL for 16 h.
(iii) CD4+ T cells were purified from the nonadherent fraction of PBMC by using a CD4 cell isolation kit (Miltenyi Biotech, Bergisch Gladbach, Germany).
(iv) CD25high cells were affinity purified from the CD4+-enriched fraction by using anti-CD25 antibody-conjugated microbeads (Miltenyi) and 2.5 μl/107 cells (1/4 of recommended quantity). The purified population resulted in >95% CD4+ CD25+ T cells (67 to 88% Foxp3+, CD127low/−). Viability was assessed through Trypan blue exclusion and was always >95%.
Flow cytometry.
A total of 5 × 10⁵ CD4+ T cells or MDDC were stained with adequate concentrations of labeled antibodies (0.1 to 1 μg/ml) for 30 min and washed with cold PBS. For intracellular staining of IFN-γ, cells harvested on different days were restimulated for 5 h with PMA (50 ng/ml) and ionomycin (1 μM) in the presence of brefeldin A (eBioscience) for the last 4 h. Cells were washed with PBS and incubated with antibodies diluted in PBS-10% heat-inactivated fetal bovine serum (HS)-0.01% NaN3 (sodium azide) for 30 min on ice. Intracellular staining for Foxp3, Tbet, and IFN-γ was performed using the eBioscience fixation/permeabilization buffer kit by following the manufacturing recommendations. A minimum of 105 events in the lymphocyte gate were acquired using an Accuri C6 flow cytometer for 4-color analysis (BD Biosciences) and using CFlow software. Cells were gated first based on forward and side scatter to exclude dead cells and cell debris. The area of positivity was determined by using an isotype-matched control MAb. Ten thousand events for each sample were acquired.
The mixtures of antibodies used were (i) FITC–anti-CD25, PE–anti-CD127, PerCP–anti-CD4, and APC–anti-Foxp3 antibodies; (ii) FITC–anti-CD25, PE–anti-CD127, PerCP–anti-IFN-γ, and APC–anti-Foxp3 antibodies; (iii) FITC–anti-CD25, PE–anti-CD127, PerCP–anti-Tbet, and APC–anti-Foxp3 antibodies; (iv) FITC–anti-CD80, PE–anti-CD11c, and APC–anti-CD86 antibodies; (v) FITC–anti-HLA-DR and PE–anti-CD83 antibodies; (vi) FITC–anti-TLR4, PE–anti-CD25, PerCP–anti-CD4, and APC–anti-Foxp3 antibodies; (vii) and FITC–anti-TLR5, PE–anti-CD25, PerCP–anti-CD4, and APC–anti-Foxp3 antibodies.
Multiplex assay technology.
IFN-γ, IL-4, IL-10, IL12p70, and IL-17 concentrations in culture supernatants were determined by using the Milliplex kit (Millipore) and Bioplex apparatus according to the manufacturer's recommendations.
For transforming growth factor beta (TGF-β) measurement, culture supernatants were treated with 1 N HCl and neutralized with 1.2 N NaOH-0.5 M HEPES, and total TGF-β was measured through TGF-β1 immunoplex array (Invitrogen) using a Bioplex apparatus.
RNA extraction and quantitative real-time reverse transcription (RT)-PCR analysis.
Total RNA was isolated from a minimum of 105 magnetically activated cell sorted (MACS) CD4+ CD25− and CD4+ CD25high T cells using the SV total RNA isolation system from Promega (Madison, WI) according to the manufacturer's recommendation. A total of 100 ng of total RNA was retrotranscribed using a StrataScript kit (Stratagene, Santa Clara, CA) and random hexamer primers in the presence of RNase inhibitor (Promega) by following the manufacturer's recommendations (42°C for 5 min and 50°C for 60 min followed by 70°C for 15 min). Quantitative real-time PCR was performed by incubating sample cDNA or control cDNA in triplicate with Sybr green PCR master mix (SuperArray) and primers specific for genes to be tested and ACTIN as the housekeeping gene (HK) in 96-well microtiter plates. FOXP3, IL-10, TGF-β, IFN-γ, and ACTIN-specific primers were obtained by SuperArray (Qiagen, Hilden, Germany). Primer sequence references are as follows: gamma interferon, NM_000619, reference position 2191, bp 89; interleukin 10, NM_000572, reference position 168, bp 63; transforming growth factor beta 1, NM_000660, reference position 1477, bp 91;forkhead box P3, NM_014009, reference position 2191, bp 89; actin beta, NM_001101, reference position 730, bp 174.
PCR was performed on an ABI PRISM 7900 (Applied Biosystems) as follows: 50°C for 2 min, 95°C for 10 min, followed by 40 cycles of 95°C for 15 s and 60°C for 1 min. Results for target genes were normalized to ACTIN expression. A relative amount of mRNA was calculated by using the 2−ΔCT method (24).
Treg functional assay.
Autologous CD4+ CD25− cells, obtained as reported above, were cultured in triplicate in a 96-well plate (104/well) in the presence of anti-CD3/CD28 antibody-coupled beads (1 bead per 5 cells) with or without CD25high cells isolated from cocultures of CD4+ T cells and MDDC-PfSE, MDDC-uRBCL, or unstimulated (US) MDDC at the indicated Treg/Teffector ratio for 5 days. 3H-thymidine (1 μCi/ml) (GE Healthcare) was added in the last 8 h of culture, and 3H-thymidine incorporation was recorded by liquid scintillation counting.
RESULTS
Phenotypic and functional changes induced by PfSE on myeloid dendritic cells of monocytic origin (MDDC).
Human myeloid dendritic cells were obtained by differentiation of CD14+ circulating monocytes in the presence of IL-4 and GM-CSF (23) and cultured for 16 h with 0.5, 1, 10, or 100 μg/ml of PfSE (derived from 5 × 10³, 104, 105, or 106 infected red blood cells [iRBC]) or with the same amounts of lysates from uninfected erythrocytes (uRBCL). Control cultures were also set up with MDDC cultured in the absence of stimuli (US MDDC). At the end of the incubation time, cells were stained with antibodies to CD80, CD86, HLA-DR, and CD11c and analyzed by flow cytometry. Figure 1 shows the dose-response effects of PfSE on CD86 expression by MDDC: while the expression of CD80 and HLA-DR was not affected even by high concentrations of PfSE (data not shown), a weak but significant increase in the expression of CD86 by MDDC is already evident with 1 μg/ml of PfSE, and the maximum increase is reached at concentrations of 10 μg/ml (∼105 iRBC). A moderate increase in CD86 expression but not in CD80 or HLA-DR expression could be detected also when MDDC were stimulated with live iRBC in amounts corresponding to the parasitic extracts (105 to 106) (data not shown). On the whole, these data suggest that low concentrations of live parasites or parasitic extracts do not induce a complete maturation process in MDDC.
Fig 1.

Expression of costimulatory markers and cytokine production by MDDC exposed to PfSE. MDDC were cultured in RPMI containing 10% fetal bovine serum (FBS) with the indicated concentrations of PfSE or uRBCL or with LPS (20 ng/ml) for 16 h or in the absence of any stimulus (US). Cells were stained with anti-CD11c and anti-CD86 antibodies or isotype control antibodies and analyzed by flow cytometry. (A) Representative scatterplot depicting isotype control staining and specific staining for CD86 and CD11c of MDDC cultured in the absence of any stimulus (US) or exposed for 16 h to PfSE (10 μg/ml), uRBC lysates (10 μg/ml), or LPS (20 ng/ml). (B) MDDC were gated based on their expression of CD11c, and the CD86 fluorescence intensity was recorded. The histogram represents data obtained from 5 different experiments. Results are expressed as RFI, that is, the ratio between median fluorescence intensity of stimulated cultures (PfSE, black columns; uRBCL, gray columns, LPS, white column) and those of unstimulated cultures × 100. Statistical analysis was performed by Wilcoxon signed-rank test; a P value of <0.05 was considered to be statistically significant. (C) MDDC were cultured at 106 cells/ml in RPMI containing 10% FBS with 20 ng/ml LPS or with the indicated concentrations of PfSE (black columns) or uRBCL (gray columns). MDDC were cultured in the absence of any stimuli (US) as the negative control. Conditioned media were collected after 16 h of stimulation, and IL-10 and IL-12(p70) levels were measured by immunoplex array (Millipore). Data represent mean cytokine production ± standard error (SE) from 5 experiments. IL-10 and IL-12(p70) levels in unconditioned medium were always under the assay detection limits. No statistically significant differences were recorded.
In another set of experiments, we tested whether exposure to PfSE was able to inhibit the maturation process induced by a powerful stimulus such as LPS. MDDC were cultured with PfSE (1, 10, 100 μg/ml) or with similar amounts of uRBCL for 16 h and then subjected to stimulation with LPS (20 ng/ml) for an additional 24 h. Figure S1 in the supplemental material shows that no interference is exerted by the parasite extracts with the maturation induced by LPS.
Finally, we also evaluated the production of cytokines able to orientate the differentiation of CD4 lymphocytes by MDDC. In particular, we evaluated the production of IL-10 and IL-12. Figure 1C shows that no significant differences were recorded in IL-10 or IL-12 production between MDDC stimulated with parasitic extracts and those stimulated with uRBCL. In a limited set of experiments, we compared the effects of PfSE on IL-10 and IL-12 production by MDDC with those obtained by corresponding amounts of iRBC (104 to 107/ml). We could not detect any significant induction of IL-10 or IL-12 production by using either live parasites or parasitic extracts.
TH differentiation induced by MDDC-PfSE.
To assess the type of T helper response induced by MDDC pulsed with parasitic extracts in CD4 lymphocytes, we set up cultures of CD4+ T cells from 8 healthy donors with autologous MDDC previously exposed to different concentrations of PfSE (1, 10, and 100 μg/ml, corresponding to 104, 105, and 106 infected RBC) or equal amounts of uRBCL. Control cultures were set up with autologous unstimulated MDDC. Cells were cultured for different times, and the production of IFN-γ, IL-4, and IL-17 as markers of TH1, TH2, and TH17 differentiation, respectively, was evaluated in culture supernatants by immunoplex array. Figure 2A shows that IFN-γ production was significantly increased in culture supernatants of MDDC-PfSE-stimulated CD4 cells after 5 days of culture. In contrast, the production of IL-4 and IL-17 was always low and not different from those induced by uRBCL or by US MDDC (data not shown). Figure 2B shows the time-dependent production of IFN-γ by CD4 cells cultured with MDDC previously exposed to fixed concentrations of PfSE or uRBCL (10 μg/ml) or with unstimulated MDDC. As is evident, the increase in IFN-γ production in MDDC-PfSE-stimulated cultures is detectable already after 3 days of culture, suggesting the induction of TH1 response by parasitic extracts.
Fig 2.

TH1 differentiation of CD4+ T cells induced by MDDC exposed to PfSE or uRBC lysates. (A) Left, CD4+ T cells isolated from PBMC of 8 healthy donors were cultured at 106/ml with unstimulated autologous MDDC (US; white column), MDDC previously exposed to the indicated concentrations of uRBCL (gray columns), or PfSE (black columns) at a 20:1 T/DC ratio. Right, MDDC were also cultured alone at 2 × 10⁴/ml with 100 μg/ml of uRBC lysates or PfSE. IFN-γ was measured in culture supernatants collected after 5 days by immunoplex array. IFN-γ concentrations in MDDC culture medium or in unconditioned medium was always less than or equal to the detection limits of assay. (B) CD4+ T cells (n = 8) were cultured at 106/ml with autologous MDDC previously exposed to 10 μg/ml of uRBCL or PfSE at a 20:1 T/DC ratio. Supernatants were collected after 3, 5, and 7 days, and IFN-γ levels were measured by immunoplex array. (C) Purified CD4+ cells were recovered at different times from cultures with autologous MDDC previously exposed to 10 μg/ml of uRBC lysates or PfSE. Cells were activated for 5 h with PMA-ionomycin in the presence of BFA and stained with anti-CD25 antibodies; then, cells were fixed, permeabilized, and intracellular stained with antibodies to IFN-γ. The selected population was >96% CD4+. The upper panel shows a representative scatterplot of cells stained with PE–anti-CD25 and PerCP–anti-IFN-γ antibodies. The area of positivity was determined using an isotype-matched control MAb. Ten thousand events for each sample were acquired. The lower panel shows a histogram with MFI values obtained from 5 different experiments: results are reported as IFN-γ MFI ± SE of total CD4+ cell population (both CD25+ and CD25−) activated by MDDC exposed to PfSE (black column) or uRBC lysates (gray column) at different times. Statistical analysis was performed by Student's t test.
To confirm that MDDC-PfSE induce a TH1 differentiation, CD4 cells (from 5 donors) were cocultured with MDDC exposed to 10 μg/ml of PfSE or uRBCL; after 3, 5, and 7 days, cells were treated with PMA-ionomycin and intracellular stained with specific antibodies to IFN-γ and to CD25. The cytofluorometric analysis shows that IFN-γ was produced by either CD25+ or CD25− cells in a time-dependent manner and that this production was higher in cells activated with MDDC-PfSE than in cultures with MDDC-uRBCL.
Figures 2C and D show the results of the cytofluorometric analysis of CD4 cells intracellularly stained with anti-IFN-γ antibodies: the expression of IFN-γ was higher in CD4 cells from MDDC-PfSE-stimulated cultures than in cultures with MDDC-uRBCL.
These data indicate that, despite the semimature phenotypic profile, PfSE-exposed MDDC oriented TH differentiation of CD4 cells toward a TH1-type response.
Treg differentiation induced by MDDC-PfSE.
To evaluate the effect of PfSE-exposed MDDC on Treg cell differentiation, CD4 cells were first cultured with MDDC exposed to a fixed concentration of PfSE (10 μg/ml, derived from ∼105 iRBCs) known to be active in inducing IFN-γ production or to equal amounts of uRBCL. Control cultures were also set up with MDDC not exposed to any stimuli. After 3 and 5 days of culture, cells were stained with anti-CD25, anti-CD127, and anti-Foxp3 antibodies and analyzed by flow cytometry. Figure 3A shows an expanded CD4+ Foxp3+ cell population with high expression of CD25 or low/absent expression of CD127 in cultures with MDDC-PfSE compared to that of MDDC-uRBCL-stimulated cultures starting after 3 days of culture. Significant differences in the percentage of CD25high CD127low/− Foxp3+ cells were recorded in MDDC-PfSE- and MDDC-uRBCL-stimulated cultures, particularly after 5 days of culture (2.08 ± 0.56 versus 6.35 ± 0.9; P = 0.02).
Fig 3.

Treg differentiation of CD4+ T cells induced by MDDC exposed to PfSE or uRBC lysates. (A) CD4+ T cells isolated from PBMC of 12 healthy donors were cultured at 106/ml with autologous MDDC previously exposed to 10 μg/ml of uRBC lysates or PfSE at a 20:1 T/DC ratio. Cells were recovered after 3 and 5 days of culture; stained with PerCP–anti-CD4, PE–anti-CD127, FITC–anti-CD25, and APC–anti-Foxp3 antibodies; and analyzed by flow cytometry. Lymphocytes were gated, followed by CD4+ cells. Treg cells were defined as CD4+ FOXP3+ CD127low/− cells or CD4+ FOXP3+ CD25high. In order to draw FOXP3+ CD25high gate, cells were first gated on CD25+ cells, and CD25high cutoff was determined where population was clearly visible. In order to draw FOXP3+ CD127low/−, cells were first gated on CD127, and CD127low/+ cutoff was determined where two populations were clearly visible. (B) CD4+ T cells from cultures with MDDC-PfSE were fractionated in CD25+ and CD25− cells by magnetic sorting with anti-CD25 monoclonal antibodies at the indicated times. Equal amounts of RNA (100 ng) from each cellular subset were reverse transcribed and amplified in triplicate by RT-PCR by using specific primers for FOXP3 or ACTIN as the HK gene. Data were normalized to the mean value of HK, and the relative amount of mRNA was calculated by using the 2−ΔCT method. Data are expressed as mean FOXP3 relative amounts ± SE from three different experiments. (C) Box-and-whisker plots show the percentages of CD25high FOXP3+ cells recovered in CD4 cells stimulated with MDDC exposed to different concentrations of PfSE or uRBC lysates or with MDDC cultured in the absence of any stimulation (US). Data are representative of 18 different subjects. The boxes extend from the 25th percentile to the 75th percentile, with a horizontal line at the median (50th percentile). Whiskers indicate standard errors. ● indicates the mean values. Statistical analysis was performed by Student's t test.
However, based on Foxp3 expression intensity, we could not discern CD25+ cells with high or intermediate expression of Foxp3 in contrast to what is reported for the Treg cell population expanded in PBMC following iRBC or PfSE stimulation (19, 21).
The expression of the Foxp3 gene was also assessed in the purified CD25+ and CD25− cell subpopulation by quantitative RT-PCR experiments using primers specific for the Foxp3 gene. The data obtained, shown in Fig. 3B, confirm that the expression of the Foxp3 gene is predominantly restricted in the CD25+ population after 5 days of culture and confirmed the kinetics of Foxp3 protein expression as detected by fluorescence-activated cell sorting (FACS) analysis.
In human malaria infections, the number of circulating Treg cells correlates with parasitemia levels (17), and the stimulation in vitro of PBMC from healthy donors with iRBC induces a dose-dependent expansion of Treg cell populations (19, 21). We therefore evaluated the effect of MDDC exposed to increasing doses of PfSE on Treg differentiation of CD4 cells. CD4 cells were cultured with MDDC exposed to 1, 10, and 100 μg/ml of PfSE or uRBCL for 5 days. Control cultures were also set up with US MDDC. Figure 3C shows the results of the cytofluorometric analysis performed with anti-CD25 and anti-Foxp3 antibodies in 5-day cultures of CD4 cells from 18 different subjects; although a dose-response effect is evident also in these experimental conditions, the saturation of Treg cell expansion is reached with MDDC exposed to 10 μg/ml of PfSE, suggesting that MDDC could present high-affinity ligands at low-antigen density, promoting Treg cell generation as reported in different systems (25).
Overall, our data demonstrate that exposure of myeloid dendritic cells to low concentrations of parasitic extracts induces a TH1-type differentiative response of CD4 cells promptly counterbalanced by the simultaneous expansion of Treg cells.
We thus investigated the molecular mechanisms involved in Treg cell expansion in MDDC-PfSE-stimulated cultures. Culture supernatants of CD4 cells cultured with MDDC-PfSE or MDDC-uRBCL were collected at different times, and the concentrations of total TGF-β and IL-10 were measured through immunoplex array. We found increased levels of total TGF-β and IL-10 in culture media of MDDC-PfSE compared to that in MDDC-uRBCL-stimulated cultures (see Fig. S2 in the supplemental material), supporting a role of these cytokines in Treg cell expansion as reported by others (19).
Recently it was reported that the ability of Treg cells to modulate specific TH differentiative responses could depend on the expression of TH-associated transcription factors (26–28). Since our model shows a predominant TH1 differentiative response, we wanted to investigate whether Treg cells induced by MDDC-PfSE could also coexpress Tbet or produce IFN-γ. Thus, CD4+ cells were cultured with MDDC-PfSE or MDDC-uRBCL, and the expression of Tbet and IFN-γ by Treg cells was analyzed by cytofluorometric analysis at different times of culture. By gating the cells based on Foxp3 expression, we observed that, in both experimental conditions, a subset of CD25high CD127low/− Treg cells also express Tbet (Fig. 4A) and produce IFN-γ (Fig. 4B). The intensity of Tbet and of IFN-γ expression were higher in Treg cells from PfSE-MDDC-stimulated cultures than in Treg cells from cultures with MDDC-uRBCL, in particular after 7 days of coculture.
Fig 4.

Time-dependent expression of Tbet and IFN-γ by Treg cells. CD4+ T cells isolated from PBMC of 5 healthy donors were cultured at 106/ml with autologous MDDC previously exposed to 10 μg/ml of uRBC lysates or PfSE at a 20:1 T/DC ratio. Cells were recovered after 3, 5, and 7 days of culture and stained with FITC–anti-CD25, PE–anti-CD127, APC–anti-Foxp3, and PerCP–anti-Tbet antibodies and analyzed by flow cytometry. The population analyzed was more than 96% CD4+. Cells were gated based on the high expression of CD25 and low or absent expression of CD127. Within this population, Foxp3+ cells were analyzed for the expression of Tbet (A) and IFN-γ (B). (C) CD25high cells were isolated from CD4+ T cells cultured for 5 days with MDDC exposed to 10 μg/ml PfSE (black column) or uRBCL (gray column) and cultured at 106 cells/ml for two additional days without addition of any stimulus. IFN-γ was measured in culture supernatants by immunoplex array. Data are expressed as mean concentrations ± SE (n = 8). Statistical analysis was performed by Student's t test. Significance levels were fixed at P values of <0.05.
To investigate whether the expansion of Tbet+/Treg cells could be driven by the intensity of TH1 response, we correlated mean fluorescence intensity (MFI) values of IFN-γ expressed by total CD4 cell population with MFI values of Tbet expressed selectively by Treg cell population (CD25high CD127low/− Foxp3+) at different time points of culture. The results obtained with data from 5 different experiments showed a significant correlation between these parameters in MDDC-PfSE-stimulated cultures (Spearman, 0.809; P = 0.01) but not in MDDC-uRBCL-stimulated cultures (Spearman, 0.571; P = 0.1). A significant correlation was also found between MFI values of IFN-γ expressed by total CD4 cell population and MFI values of IFN-γ expressed selectively by Treg cell population in PfSE-MDDC-stimulated culture (Spearman, 0.74; P = 0.02) but not between the same values in MDDC-uRBCL-stimulated cultures (Spearman, 0.075; P = 0.8). On the whole, these data suggest that the IFN-γ produced by total CD4 cells in response to MDDC-PfSE could specifically drive the differentiation of the Treg/TH1 subset.
To confirm the results of flow cytometric analysis, we separated CD25high cells by small amounts of magnetic beads conjugated with anti-CD25 antibodies (29), obtaining a highly enriched Foxp3+ population (67 to 88% Foxp3+). These cells were incubated in medium without additional stimuli for 48 h, and IFN-γ was measured by an immunoplex array in culture supernatants. Figure 4C shows that the production of IFN-γ by CD25high cells induced in the presence of MDDC-PfSE is higher than that of CD25high cells induced in the presence of MDDC-uRBCL.
Suppressive activity of Treg cells induced by MDDC-PfSE.
To evaluate the suppressive activity of Treg cells induced by MDDC-PfSE, we purified CD25high cells from CD4+ cells cultured for 5 days with MDDC-PfSE, MDDC-uRBCL, or unstimulated (US) MDDC as reported above and used these cells in a functional assay as described previously (29). Briefly, CD25high cells were cocultured with autologous effector CD4+ CD25− cells at different Treg/Teffector ratios, and their ability to suppress the proliferation of effector cells induced by anti-CD3/CD28 antibodies was recorded. The “power of suppression” was expressed as the low Treg/Teffector ratio, leading to significant inhibition of polyclonal-induced T-cell proliferation.
Figure 5 shows that CD25high cells derived from cultures with MDDC-PfSE are able to more effectively suppress the proliferation of autologous CD4+ CD25− T cells than CD25high cells isolated from cocultures with MDDC-uRBCL. Indeed, they show higher suppressive activity at very low Treg/Teffector ratios (1:100 or 1:300).
Fig 5.

Suppressive activity of Treg cells induced by MDDC-PfSE. CD25high cells were purified from CD4+ cells cultured for 5 days with 10 μg/ml of MDDC-PfSE or -uRBCL. Control cultures were also set up with CD25high cells from coculture of CD4+ cells with unstimulated MDDC. CD4+ CD25− cells were incubated (104 cells/well) in triplicate cultures with anti-CD3/CD28 antibody-coupled beads (1 bead/5 cells) in the presence of CD4+ CD25high at the indicated Treg/Teff ratio. After 5 days of culture, cells were pulsed with 1 μCi of 3H-thymidine for 12 h. Cells were harvested and cpm incorporated were measured by liquid scintillation counting. Panel A shows the mean 3H-thymidine incorporation (cpm) of cells cultured in the presence or absence of Treg cells (n = 5). In all of the experiments, mean 3H-thymidine incorporation of Treg cells (103 to 102 cells/well) was always <100 cpm. (B) The boxplot represents the percentage of suppression of 3H-thymidine incorporation induced by CD25high expanded in the presence of MDDC-PfSE or MDDC-uRBCL calculated as follows: (cpm background − cpm suppressed)/cpm background × 100. Background = cpm of cells stimulated with anti-CD3/CD28 antibodies. Results are expressed as means ± SE from 5 different experiments. The percentage of suppression induced by Treg from unstimulated (US) MDDC coculture is shown in panel B as means ± SE from 3 different experiments. Statistical analysis was performed by Student's t test. Mann-Whitney analysis of data also shows significant differences in the suppressive activity of Treg cells (P = 0.04 for 1:100 and 1:300 Treg/Teff ratios).
Production of cytokines from Treg cells induced by MDDC-PfSE.
To analyze the mechanisms of suppressive activity in the Treg cell population, we isolated CD25high cells at various time intervals and evaluated by quantitative RT-PCR the expression of genes for cytokines involved in the suppressive activity, in particular TGF-β and IL-10. Figure 6 shows the kinetic expression of genes for two important cytokines involved in suppressive function: TGF-β and IL-10. After 3 days of stimulation, the expression of the TGF-β gene is significantly increased in CD25high isolated from cells cultured with MDDC-PfSE compared to that in CD25high from cultures with MDDC-uRBCL, and this difference further increases after 5 days, consistently with the expression of the Foxp3 gene. The expression of the IL-10 gene from CD25high cells is maximal after 3 days of culture, but after 5 days, no significant difference was detected between MDDC-PfSE- and MDDC-uRBCL-stimulated cultures.
Fig 6.
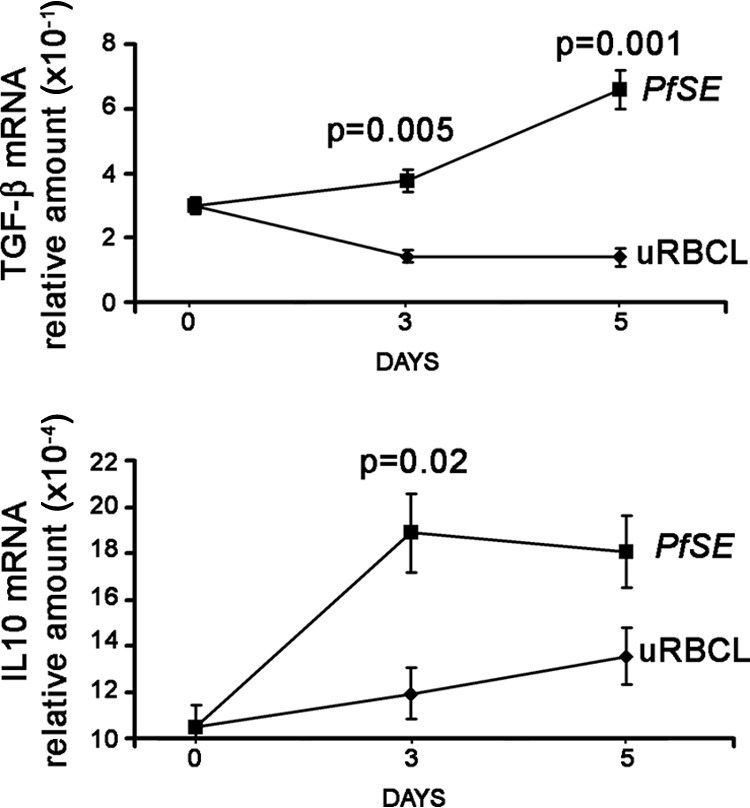
Cytokine production of Treg cells induced by MDDC-PfSE. CD25high cells were isolated from CD4+ T cells cultured for 3 and 5 days with MDDC exposed to 10 μg/ml PfSE or uRBCL. RNA was extracted and TGF-β and IL-10 gene expression was analyzed by quantitative RT-PCR with specific primers, using actin as the HK gene. Data were normalized to the mean value of the HK gene, and the relative amount of mRNA was calculated by using the 2−ΔCT method. The figure shows the results (mean TGF-β mRNA × 10−1 ± SE and mean IL-10 mRNA × 10−4 ± SE) of 3 different experiments. Statistical analysis was performed by Student's t test.
Expression of TLR by Treg cells and functional changes induced by TLR ligands.
The data obtained so far show that the presence of MDDC-PfSE induces the expansion of highly suppressive Treg cells and that a subset of them acquire a mixed Treg/Tbet phenotype likely to be dependent on IFN-γ released in culture medium. In a subsequent series of experiments, we wanted to investigate whether, beside the amplitude of TH1 response, factors external and unrelated to malaria infection could also influence the functional profile of Treg cells induced (30). In particular we analyzed the effect of TLR ligands from a microbic source. First, we analyzed the presence of differences in the TLR profile between Treg cells induced in the presence of MDDC-PfSE and those induced with MDDC-uRBCL. To this aim, CD4 cells were stained at day 5 of coculture with MDDC with monoclonal antibodies specific for those TLRs known to be more expressed on Treg cells than on effector cells (30), TLR2, TLR4, TLR5, and TLR7, as well as antibodies to CD25 and Foxp3. FACS analysis of the cells did not show differences in the expression of TLR2 and TLR7 between Treg cells induced by MDDC-PfSE and Treg cells induced by MDDC-uRBCL (data not shown). In contrast, the expression of TLR4 and TLR5 is much higher on Treg cells induced in cultures with MDDC-PfSE. Furthermore, to study the functional consequences of the increased expression of TLR4 and TLR5, we isolated CD25high cells from 5-day coculture with MDDC-PfSE or -uRBCL and cultured them with LPS and flagellin as ligands of TLR4 and TLR5, respectively. The production of IL-10 and TGF-β was measured in culture supernatants after 48 h of stimulation by immunoplex array. Figure 7B shows that the stimulation of Treg cells with LPS and flagellin increases the production of both cytokines and that, particularly after stimulation with LPS, such production is significantly higher in Treg cells derived from cultures with MDDC-PfSE than in those derived from cultures with MDDC-uRBCL. Therefore, these data suggest that other factors not related to malaria infection may also affect the functional profile of Treg cells during the course of the disease.
Fig 7.

TLR expression and TLR sensitivity of Treg cells induced by MDDC-PfSE or MDDC-uRBCL. CD4+ T cells were cultured at 106/ml with autologous MDDC previously exposed to 10 μg/ml of uRBCL (gray columns) or PfSE (black columns) at a 20:1 ratio for 5 days. (A) Cells were stained at day 5 with PE–anti-CD25 antibody, anti-TLR4 and anti-TLR5 monoclonal antibodies, FITC secondary antibody, and APC–anti-Foxp3 antibodies and analyzed by cytofluorometry. Data represent the percentage (mean ± SE) of CD25high Foxp3+ expressing TLR4 and TLR5 over the total CD25+ of 8 different subjects. Statistical analysis was performed by Student's t test. Significance levels were fixed at P values of <0.05. (B) CD25high cells were purified through magnetic sorting with anti-CD25 MAb-coupled beads from culture of CD4+ T cells with MDDC-PfSE (black columns) or MDDC-uRBCL (gray columns). Cells were then stimulated with LPS (20 ng/ml) or flagellin (100 ng/ml) for an additional 48 h, and supernatants were collected. The production of IL-10 and total TGF-β in culture supernatants was measured by immunoplex array. Data are expressed as the mean percentage increase of IL-10 and TGF-β ± SE (n = 6). Statistical analysis was performed by Student's t test.
DISCUSSION
The optimal outcome of malaria infection is that parasitized cells are killed and cleared without inducing significant pathology. Therefore, in the course of evolution, refined regulatory mechanisms of immune and inflammatory response were selected with reciprocal benefit for the host and the parasite. To better understand how immune regulation is achieved, we studied the immune response induced in vitro by MDDC previously exposed to P. falciparum soluble extracts in CD4+ T cells purified from donors never exposed to malaria infection. The reason we used myeloid dendritic cells as T cell activators instead of circulating monocytes is based on data obtained in experimental models of murine malaria, reporting these cells as the most active antigen-presenting cells (APCs) in the first phase of infection (31); MDDC are described as cells able to influence the development of protective immunity or tolerance dependent on the intensity of the costimulation signals, the affinity of T cells for processed antigens, and, most of all, the cytokine environment in which they operate (6). Furthermore, CD11c+ myeloid dendritic cells were shown to be endowed with a greater ability to migrate in the T zone of splenic white pulp than other APCs, such as monocytes/macrophages and B cells (7, 8).
Conflicting data on the ability of parasites or parasite products to inhibit the maturation of dendritic cells were reported (9–12) likely to be dependent on the experimental models of infection as well as on the different strains or concentrations of parasites used. Our results demonstrate that the parasitic extracts, in a range of concentrations between 0.5 and 100 μg/ml of PfSE, do not interfere with the process of maturation of dendritic cells induced by LPS. They also, at the appropriate concentrations (1 to 100 μg/ml), significantly induced the expression of CD86 while the expression of other markers of maturation, such as CD80 and HLA-DR, was unaffected.
However, we must stress that the activity of PfSE does not necessarily reflect those of iRBC: indeed, higher iRBC concentrations (≥1:1 MDDC:iRBC) are needed to obtain comparable effects (10) (data not shown).
Despite the small amounts of IL-12 produced by MDDC exposed to PfSE, these cells induced a clear TH1 differentiation of CD4 lymphocytes as evidenced by the expression of IFN-γ by CD4 cells as well as by the expression of the “master” regulator of TH1 responses, Tbet (data not shown). MDDC pulsed with low PfSE (corresponding to 104 and 105 iRBC) concentrations are as effective as MDDC pulsed with larger amounts of PfSE in inducing TH1 response. Whether or not this response really represents an in vitro priming of CD4 cells needs to be further investigated. Indeed, CD4 cells cross-reactive to malarial antigens have been described by numerous authors (32–34). Dendritic cells could be involved in Treg cell generation either through the presentation of ligands which preferentially expand Treg cell populations or through mechanisms independent of specific TCR activation based on the production of “suppressive” cytokines. In our experimental conditions, the functional phenotype of MDDC acquired in the presence of parasitic extracts resembles that of semimature dendritic cells with prevalent tolerogenic functions (35), and the maximum expansion of Treg cell population induced is achieved by MDDC pulsed with relatively small amounts of PfSE (1 to 10 μg/ml, corresponding to 104 to 105 iRBC), indicating that, under conditions of low antigenic concentrations, MDDC may present high-affinity ligands to T cells which primarily promote Treg induction (25). Preliminary results obtained in our laboratory by using live parasites also show that MDDC activated by iRBC at low iRBC/MDDC ratios (0.1:1, 1:1) are equally effective in inducing Treg cells compared to parasite extracts.
When using monocytes as APCs, much greater antigen amounts are needed to obtain comparable expansion of Treg cell populations (19, 21) (data not shown).
Besides the ability to present high-affinity ligands at low antigen concentrations, it is possible that the sensitivity of MDDC to parasite products is higher than that of monocytes, leading to an optimal and concerted production of factors involved in Treg cell generation. In fact, it was reported that dendritic cells are the most potent APC in spleen in inducing Treg cells compared to other APCs (36), and differences in gene expression profiles were found between monocytes and dendritic cells after stimulation with different parasites (37). The overall results therefore suggest that dendritic cells could play an important role in the expansion of Treg cells in human malaria, particularly under conditions of low parasitemia, as in the first phase of infection or at the end of immune response, when most of parasites have been cleared. In this stage, the suboptimal generation of activated Treg cells could contribute to limit the inflammatory response due to a subsequent reinfection and favor parasite persistence. Consistently with this hypothesis, circulating Treg cells isolated from malaria-exposed donors in areas of malaria endemicity show marked features of activation not related to parasitemia levels (22).
Other peculiarities of the phenotypic and functional features of Treg cells induced by MDDC-PfSE are represented by their homogeneous Foxp3 expression: subsets with high or intermediate expression of Foxp3, as reported in different systems (19, 21), are not clearly distinguishable in Treg cells induced by MDDC-PfSE. Thus, the presence of Treg cells which coexpress the master regulator of TH1 response, Tbet, could be interpreted as the result of contamination of effector cells expressing Foxp3 but not endowed with regulatory activity. However, it is possible to envisage a different hypothesis. Recently, it has been described that Foxp3+ Treg cells may coexpress transcription factors typical of effector TH1, TH2, and TH17, such as Tbet, GATA3, and Stat3 (26–28). The expansion of these T regulatory subsets is driven by the TH cytokines (IFN-γ, IL-4, IL-17) and occurs in parallel with the related effectors (27, 38), and, in definite pathological conditions, such as strong pathogen-induced immunopathology, it was reported that these Treg cells also produce the TH-related cytokines (39, 40) without losing the regulatory ability. With these premises, it is conceivable that Treg cells acquire (or reacquire) the TH1 phenotype, with the expression of Tbet and also the production of IFN-γ, in response to the great amounts of IFN-γ released under the influence of MDDC-PfSE. Consistently with this hypothesis, we found a significant correlation between the production of IFN-γ by CD4 cells (expressed as fluorescence intensity) and either the expression of Tbet or the percentage of Treg cells with TH1 phenotype found only in MDDC-PfSE-stimulated cultures. Further studies are needed to definitely assess the role of Treg/TH1 in the context of malaria infection. Our data show that the functional property of the whole Treg cell population, particularly their suppressive activity, was not limited by the presence of Treg cells with the TH1 phenotype since the suppressive power of the Treg cell population was evident at very low Treg/Teffector ratios (1:100, 1:300).
In areas of malaria high endemicity, patients frequently suffer fron cobacterial infections, such as with nontyphoid Salmonella, Haemophilus, and Streptococcus pneumoniae (41, 42). The increased sensitivity of Treg cells induced by MDDC-PfSE to TLR4 and TLR5 ligands could represent a further checkpoint in Treg cell functions; indeed, bacterial ligands of TLR4 and TLR5 increase the production of suppressive factors by these cells, suggesting that concomitant bacterial infections might worsen the outcome of acute malaria by potentiating Treg functions.
Supplementary Material
ACKNOWLEDGMENTS
This work was supported by grants from Italian Ministry of Education (PRIN 2006) and from University of Firenze (former 60%) and by donations from Mimetech Srl (Rome, Italy). Ann Maria Clemente was supported by a grant from Mimetech Srl (Rome, Italy) (Pharmacological Evaluation of NGF Mimetics).
We thank Eloisa Perissi for her precious secretarial support. We are grateful to Francesco Silvestrini of the Institute of Public Health of Rome for providing Plasmodium falciparum culture.
Footnotes
Published ahead of print 18 March 2013
Supplemental material for this article may be found at http://dx.doi.org/10.1128/IAI.01226-12.
REFERENCES
- 1. World Health Organization 2011. World malaria report. WHO, Geneva, Switzerland [Google Scholar]
- 2. Mu JB, Duan JH, Makova KD, Joy DA, Huynh CQ, Branch OH, Li WH, Su XZ. 2002. Chromosome-wide SNPs reveal an ancient origin for Plasmodium falciparum. Nature 418:323–326 [DOI] [PubMed] [Google Scholar]
- 3. Struik SS, Riley EM. 2004. Does malaria suffer from lack of memory? Immunol. Rev. 201:268–290 [DOI] [PubMed] [Google Scholar]
- 4. Portugal S, Carret C, Recker M, Armitage AE, Goncalves LA, Epiphanio S, Sullivan D, Roy C, Newbold CI, Drakesmith H, Mota MM. 2011. Host-mediated regulation of superinfection in malaria. Nat. Med. 17:732–737 [DOI] [PMC free article] [PubMed] [Google Scholar]
- 5. Mccall MBB, Sauerwein RW. 2010. Interferon-gamma-central mediator of protective immune responses against the pre-erythrocytic and blood stage of malaria. J. Leukoc. Biol. 88:1131–1143 [DOI] [PubMed] [Google Scholar]
- 6. Stevenson MM, Ing R, Berretta F, Miu J. 2011. Regulating the adaptive immune response to blood-stage malaria: role of dendritic cells and CD4(+) Foxp3(+) regulatory T cells. Int. J. Biol. Sci. 7:1311–1322 [DOI] [PMC free article] [PubMed] [Google Scholar]
- 7. Leisewitz AL, Rockett KA, Gumede B, Jones M, Urban B, Kwiatkowski DP. 2004. Response of the splenic dendritic cell population to malaria infection. Infect. Immun. 72:4233–4239 [DOI] [PMC free article] [PubMed] [Google Scholar]
- 8. Voisine C, Mastelic B, Sponaas AM, Langhorne J. 2010. Classical CD11c(+) dendritic cells, not plasmacytoid dendritic cells, induce T cell responses to Plasmodium chabaudi malaria. Int. J. Parasitol. 40:711–719 [DOI] [PubMed] [Google Scholar]
- 9. Bettiol E, Carapau D, Galan-Rodriguez C, Ocana-Morgner C, Rodriguez A. 2010. Dual effect of Plasmodium-infected erythrocytes on dendritic cell maturation. Malaria J. 9:64. [DOI] [PMC free article] [PubMed] [Google Scholar]
- 10. Elliott SR, Spurck TP, Dodin JM, Maier AG, Voss TS, Yosaatmadja F, Payne PD, McFadden GI, Cowman AF, Rogerson SJ, Schofield L, Brown GV. 2007. Inhibition of dendritic cell maturation by malaria is dose dependent and does not require Plasmodium falciparum erythrocyte membrane protein 1. Infect. Immun. 75:3621–3632 [DOI] [PMC free article] [PubMed] [Google Scholar]
- 11. Mukherjee P, Chauhan VS. 2008. Plasmodium falciparum-free merozoites and infected RBCs distinctly affect soluble CD40 ligand-mediated maturation of immature monocyte-derived dendritic cells. J. Leukoc. Biol. 84:244–254 [DOI] [PubMed] [Google Scholar]
- 12. Urban BC, Ferguson DJP, Pain A, Willcox N, Plebanski M, Austyn JM, Roberts DJ. 1999. Plasmodium falciparum-infected erythrocytes modulate the maturation of dendritic cells. Nature 400:73–77 [DOI] [PubMed] [Google Scholar]
- 13. deWalick S, Amante FH, McSweeney KA, Randall LM, Stanley AC, Haque A, Kuns RD, MacDonald KPA, Hill GR, Engwerda CR. 2007. Cutting edge: conventional dendritic cells are the critical APC required for the induction of experimental cerebral malaria. J. Immunol. 178:6033–6037 [DOI] [PubMed] [Google Scholar]
- 14. Finney OC, Riley EM, Walther M. 2010. Regulatory T cells in malaria—friend or foe? Trends Immunol. 31:63–70 [DOI] [PubMed] [Google Scholar]
- 15. Hisaeda H, Maekawa Y, Iwakawa D, Okada H, Himeno K, Kishihara K, Tsukumo S, Yasutomo K. 2004. Escape of malaria parasites from host immunity requires CD4(+)CD25(+) regulatory T cells. Nat. Med. 10:29–30 [DOI] [PubMed] [Google Scholar]
- 16. Long TTA, Nakazawa S, Onizuka S, Huaman MC, Kanbara H. 2003. Influence of CD4(+)CD25(+) T cells on Plasmodium berghei NK65 infection in BALB/c mice. Int. J. Parasitol. 33:175–183 [DOI] [PubMed] [Google Scholar]
- 17. Walther M, Tongren JE, Andrews L, Korbel D, King E, Fletcher H, Andersen RF, Bejon P, Thompson F, Dunachie SJ, Edele F, de Souza JB, Sinden RE, Gilbert SC, Riley EM, Hill AVS. 2005. Upregulation of TGF-beta, FOXP3, and CD4(+)CD25(+) regulatory T cells correlates with more rapid parasite growth in human malaria infection. Immunity 23:287–296 [DOI] [PubMed] [Google Scholar]
- 18. Finney OC, Nwakanma D, Conway DJ, Walther M, Riley EM. 2009. Homeostatic regulation of T effector to Treg ratios in an area of seasonal malaria transmission. Eur. J. Immunol. 39:1288–1300 [DOI] [PubMed] [Google Scholar]
- 19. Scholzen A, Minigo G, Plebanski M. 2010. Heroes or villains? T regulatory cells in malaria infection. Trends Parasitol. 26:16–25 [DOI] [PubMed] [Google Scholar]
- 20. Clemente A, Caporale R, Sannella AR, Majori G, Severini C, Fadigati G, Cirelli D, Bonini P, Garaci E, Cozzolino F, Torcia MG. 2011. Plasmodium falciparum soluble extracts potentiate the suppressive function of polyclonal T regulatory cells through activation of TGF beta-mediated signals. Cell. Microbiol. 13:1328–1338 [DOI] [PubMed] [Google Scholar]
- 21. Finney OC, Lawrence E, Gray AP, Njie M, Riley EM, Walther M. 2012. Freeze-thaw lysates of Plasmodium falciparum-infected red blood cells induce differentiation of functionally competent regulatory T cells from memory T cells. Eur. J. Immunol. 42:1767–1777 [DOI] [PMC free article] [PubMed] [Google Scholar]
- 22. Torcia MG, Santarlasci V, Cosmi L, Clemente A, Maggi L, Mangano VD, Verra F, Bancone G, Nebie I, Sirima BS, Liotta F, Frosali F, Angeli R, Severini C, Sannella AR, Bonini P, Lucibello M, Maggi E, Garaci E, Coluzzi M, Cozzolino F, Annunziato F, Romagnani S, Modiano D. 2008. Functional deficit of T regulatory cells in Fulani, an ethnic group with low susceptibility to Plasmodium falciparum malaria. Proc. Natl. Acad. Sci. U. S. A. 105:646–651 [DOI] [PMC free article] [PubMed] [Google Scholar]
- 23. Sallusto F, Lanzavecchia A. 1994. Efficient presentation of soluble antigen by cultured human dendritic cells is maintained by granulocyte-macrophage colony-stimulating factor plus interleukin-4 and down-regulated by tumor necrosis factor alpha. J. Exp. Med. 179:1109–1118 [DOI] [PMC free article] [PubMed] [Google Scholar]
- 24. Livak KJ, Schmittgen TD. 2001. Analysis of relative gene expression data using real-time quantitative PCR and the 2(-Delta Delta C(T)) method. Methods 25:402–408 [DOI] [PubMed] [Google Scholar]
- 25. Geiger TL, Tauro S. 2011. Nature and nurture in Foxp3(+) regulatory T cell development, stability, and function. Hum. Immunol. 73:232–239 [DOI] [PMC free article] [PubMed] [Google Scholar]
- 26. Chaudhry A, Rudra D, Treuting P, Samstein RM, Liang YQ, Kas A, Rudensky AY. 2009. CD4(+) regulatory T cells control T(H)17 responses in a Stat3-dependent manner. Science 326:986–991 [DOI] [PMC free article] [PubMed] [Google Scholar]
- 27. Koch MA, Tucker-Heard G, Perdue NR, Killebrew JR, Urdahl KB, Campbell DJ. 2009. The transcription factor T-bet controls regulatory T cell homeostasis and function during type 1 inflammation. Nat. Immunol. 10:595–602 [DOI] [PMC free article] [PubMed] [Google Scholar]
- 28. Zheng W, Wang QH, Feng H, Liu J, Meng HR, Cao YM. 2009. CD4(+)CD25(+)Foxp3(+) regulatory T cells prevent the development of Th1 immune response by inhibition of dendritic cell function during the early stage of Plasmodium yoelii infection in susceptible BALB/c mice. Folia Parasitol. 56:242–250 [DOI] [PubMed] [Google Scholar]
- 29. Baecher-Allan CM, Hafler DA. 2006. The purification and functional analysis of human CD4+CD25high regulatory T cells. Curr. Protoc. Immunol. Chapter 7:Unit 4B [DOI] [PubMed] [Google Scholar]
- 30. Sutmuller R, Garritsen A, Adema GJ. 2007. Regulatory T cells and toll-like receptors: regulating the regulators. Ann. Rheumat. Dis. 66:91–95 [DOI] [PMC free article] [PubMed] [Google Scholar]
- 31. Lundie RJ. 2011. Antigen presentation in immunity to murine malaria. Curr. Opin. Immunol. 23:119–123 [DOI] [PubMed] [Google Scholar]
- 32. Fell AH, Currier J, Good MF. 1994. Inhibition of Plasmodium falciparum growth in vitro by Cd4(+) and Cd8(+) T cells from non-exposed donors. Parasite Immunol. 16:579–586 [DOI] [PubMed] [Google Scholar]
- 33. Goodier MR, Targett GAT. 1997. Evidence for CD4(+) T cell responses common to Plasmodium falciparum and recall antigens. Int. Immunol. 9:1857–1865 [DOI] [PubMed] [Google Scholar]
- 34. Zevering Y, Amante F, Smillie A, Currier J, Smith G, Houghten RA, Good MF. 1992. High frequency of malaria-specific T cells in non-exposed humans. Eur. J. Immunol. 22:689–696 [DOI] [PubMed] [Google Scholar]
- 35. Mahnke K, Enk AH. 2005. Dendritic cells: key cells for the induction of regulatory T cells? Curr. Top. Microbiol. Immunol. 293:133–150 [DOI] [PubMed] [Google Scholar]
- 36. Yamazaki S, Bonito AJ, Spisek R, Dhodapkar M, Inaba K, Steinman RM. 2007. Dendritic cells are specialized accessory cells along with TGF-beta for the differentiation of Foxp3(+) CD4(+) regulatory T cells from peripheral Foxp3(−) precursors. Blood 110:4293–4302 [DOI] [PMC free article] [PubMed] [Google Scholar]
- 37. Chaussabel D, Semnani RT, McDowell MA, Sacks D, Sher A, Nutman TB. 2003. Unique gene expression profiles of human macrophages and dendritic cells to phylogenetically distinct parasites. Blood 102:672–681 [DOI] [PubMed] [Google Scholar]
- 38. Josefowicz SZ, Lu LF, Rudensky AY. 2012. Regulatory T cells: mechanisms of differentiation and function. Annu. Rev. Immunol. 30:531–564 [DOI] [PMC free article] [PubMed] [Google Scholar]
- 39. Oldenhove G, Bouladoux N, Wohlfert EA, Hall JA, Chou D, Dos Santos L, O'Brien S, Blank R, Lamb E, Natarajan S, Kastenmayer R, Hunter C, Grigg ME, Belkaid Y. 2009. Decrease of Foxp3(+) Treg cell number and acquisition of effector cell phenotype during lethal infection. Immunity 31:772–786 [DOI] [PMC free article] [PubMed] [Google Scholar]
- 40. Zhao JX, Zhao JC, Fett C, Trandem K, Fleming E, Perlman S. 2011. IFN-gamma- and IL-10-expressing virus epitope-specific Foxp3(+) T reg cells in the central nervous system during encephalomyelitis. J. Exp. Med. 208:1571–1577 [DOI] [PMC free article] [PubMed] [Google Scholar]
- 41. Bassat Q, Guinovart C, Sigauque B, Mandomando I, Aide P, Sacarlal J, Nhampossa T, Bardaji A, Morais L, Machevo S, Letang E, Macete E, Aponte JJ, Roca A, Menendez C, Alonso PL. 2009. Severe malaria and concomitant bacteraemia in children admitted to a rural Mozambican hospital. Trop. Med. Int. Health 14:1011–1019 [DOI] [PubMed] [Google Scholar]
- 42. Scott JA, Berkley JA, Mwangi I, Ochola L, Uyoga S, Macharia A, Ndila C, Lowe BS, Mwarumba S, Bauni E, Marsh K, Williams TN. 2011. Relation between falciparum malaria and bacteraemia in Kenyan children: a population-based, case-control study and a longitudinal study. Lancet 378:1316–1323 [DOI] [PMC free article] [PubMed] [Google Scholar]
Associated Data
This section collects any data citations, data availability statements, or supplementary materials included in this article.