Abstract
An elastic network model (ENM), usually Cα coarse-grained one, has been widely used to study protein dynamics as an alternative to classical molecular dynamics simulation. This simple approach dramatically saves the computational cost, but sometimes fails to describe a feasible conformational change due to unrealistically excessive spring connections. To overcome this limitation, we propose a mass-weighted chemical elastic network model (MWCENM) in which the total mass of each residue is assumed to be concentrated on the representative alpha carbon atom and various stiffness values are precisely assigned according to the types of chemical interactions. We test MWCENM on several well-known proteins of which both closed and open conformations are available as well as three α-helix rich proteins. Their normal mode analysis reveals that MWCENM not only generates more plausible conformational changes, especially for closed forms of proteins, but also preserves protein secondary structures thus distinguishing MWCENM from traditional ENMs. In addition, MWCENM also reduces computational burden by using a more sparse stiffness matrix.
Keywords: elastic network model, normal mode analysis, protein dynamics, closed protein conformation
Introduction
Most proteins undergo conformational changes, which are closely related to their specific biological functions such as catalysis and regulation.1, 2 Therefore, in the past decades, a number of experimental and theoretical approaches have been proposed to understand the functional dynamics of proteins. Various experimental techniques including Cryo-EM, X-ray crystallography, and NMR have succeeded in determining protein structures at the atomic level. Although these structures provide good starting points for molecular dynamics simulations and the elucidation of protein dynamics,3–6 limitations regarding the simulation time scale, data size, and computational cost still exist.7, 8
Elastic network model (ENM) based normal mode analysis (NMA) was proposed as an alternative method that is better suited for the study of the collective motions in macromolecules.9–12 In ENM, the system is constructed using a virtual spring network among point masses, which represent the protein residues and their interactions.13–17 To reduce computational cost, this coarse-grained protein model adopts a simplified Hookean potential instead of using an all-atom empirical potential function.18, 19 Moreover, various types of connection rules have been proposed to capture biologically relevant collective modes.
The most common and simplest method is the distance-cutoff rule. Both empirical and theoretical studies have suggested that the minimum cutoff value should be at least 11 Å to guarantee system stability.19–21 However, this traditional method sometimes fails to capture biologically important functional modes on the low-frequency normal modes, especially for closed forms in proteins. This failure results from the discrepancy between the virtual spring connections in ENM and the actual chemical interactions of native protein structures. For example, in the case of the closed form of lactoferrin, the distance-cutoff method does not show the expected “tweezers” movement, because of the unrealistic constraints between the two closed lobes.22 Moreover, the rigidity of protein structures is not given careful consideration because the traditional connection rule for ENM uses a uniform spring constant for all types of interactions. However, protein secondary structures are thought to behave as rigid bodies under thermal fluctuation because of their relatively strong covalent and hydrogen bond connections.23–25
To improve the accuracy of stiffness and connectivity, the chemical-bond based connection rule was proposed, in which the various stiffness values are assigned according to the type of chemical bond, including disulfide bonds, covalent bonds, hydrogen bonds, salt-bridges, and Van der Waals interactions.20 In this model, one can reduce the computation time by using smaller and more realistic distance-cutoff values of less than 8 Å without a loss of generality. Figure 1 compares traditional distance-cutoff based ENM with chemical bond based ENM. In both cases, the orange spheres and lines represent the alpha carbons and their interactions, respectively.
Figure 1.
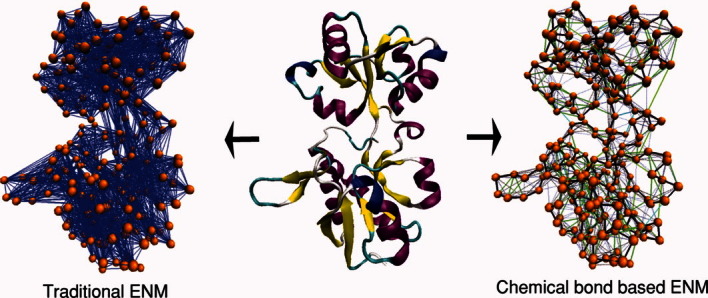
Schematic of coarse-grained ENMs using the traditional distance-cutoff method (left) and chemical bond information (right). The representative alpha carbons are shown as orange spheres. In traditional ENM, the interactions within the cutoff distance of 11 Å are shown as blue solid lines. In chemical bond based ENM, various types of lines depict the various chemical interactions. Black, green, cyan, and yellow solid lines, and blue dotted lines represent backbone, hydrogen bonds, ionic bonds, disulfide bonds, and van der Waals interactions, respectively. [Color figure can be viewed in the online issue, which is available at http://wileyonlinelibrary.com.]
In this article, we propose a more elaborate connection rule that represents not only chemical interactions but also the inertial effect by assuming that the entire mass of an amino acid is concentrated on its alpha carbons atom. This mass-weighted chemical ENM, called MWCENM, maintains a sparse stiffness (Hessian) matrix and enables us to analyze protein dynamics more precisely. To verify the proposed methodology, we compute overlap values between normal modes and conformational changes of several proteins for which both open and closed conformations are available. Moreover, three alpha helix rich proteins are also tested in order to compare the torsion angle distortion between the traditional distance-cutoff method and the proposed MWCENM. Lastly, the computation time for both approaches is compared.
Results
To verify the proposed method, we determined the overlap values of the 10 closed-form proteins, which have their clearly distinguished open form proteins listed in Table I. Here, we precisely discuss the following three closed-form proteins: SARS protease,26, 27 threonyl-tRNA synthetase,28 and lactoferrin.29 We also measured the torsion angle changes in three alpha helix rich proteins: myoglobin,30 calmodulim,31 and human UMP/CMP kinase.32 These proteins were selected from the Macromolecular Movements Database.33, 34 The overlap tests are intended to evaluate how precisely the proposed method can capture the conformational changes observed in proteins, especially for the closed forms. Traditional connection rules have often failed to capture conformational changes in the closed forms of protein.35, 36 A torsion angle measurement for alpha helix rich proteins can show quantitatively whether the protein secondary structures are preserved in the MWCENM based NMA.
Table I.
Overlap Value for Tested Proteins
| MWCENM | Traditional ENM | ||||
|---|---|---|---|---|---|
| Protein name | PDB codea | CSO | Overlap (mode) | CSO | Overlap (mode) |
| SARS protease | 1UK4 | 0.666 | 0.353 (8) | 0.537 | 0.284 (8) |
| 2A5A | 0.510 | 0.306 (9) | 0.532 | 0.310 (8) | |
| Threonyl-tRNAsynthetase | 1EVL | 0.851 | 0.555 (16) | 0.630 | 0.293 (18) |
| 1EVK | 0.879 | 0.550 (10) | 0.799 | 0.387 (13) | |
| Lactoferrin | 1LFG | 0.890 | 0.636 (7) | 0.866 | 0.543 (7) |
| 1LFH | 0.919 | 0.630 (9) | 0.922 | 0.519 (7) | |
| Guanylate kinase | 1EX7 | 0.970 | 0.919 (7) | 0.917 | 0.770 (7) |
| 1EX6 | 0.968 | 0.882 (7) | 0.944 | 0.864 (7) | |
| Sucrose phosphatase (SPP) | 1TJ5 | 0.864 | 0.644 (10) | 0.881 | 0.664 (9) |
| 1S2O | 0.960 | 0.903 (7) | 0.971 | 0.937 (7) | |
| LAO binding protein | 1LST | 0.907 | 0.446 (15) | 0.862 | 0.576 (9) |
| 2LAO | 0.970 | 0.946 (7) | 0.964 | 0.819 (7) | |
| α-Ketoglutaratedioxygenase | 1GY9 | 0.922 | 0.798 (7) | 0.885 | 0.756 (8) |
| 1OTJ | 0.951 | 0.884 (7) | 0.958 | 0.826 (7) | |
| Adenylate kinase | 1AKY | 0.634 | 0.377 (10) | 0.620 | 0.464 (9) |
| 1DVR | 0.949 | 0.792 (8) | 0.948 | 0.730 (8) | |
| Diphtheria toxin | 1MDT | 0.642 | 0.352 (9) | 0.588 | 0.358 (10) |
| 1DDT | 0.710 | 0.409 (8) | 0.723 | 0.562 (8) | |
| CBL | 2CBL | 0.911 | 0.744 (7) | 0.855 | 0.653 (9) |
| 1B47 | 0.921 | 0.701 (7) | 0.901 | 0.655 (9) | |
For each protein, the first and the second PDB codes represent closed and open forms, respectively.
All structural information was obtained from the Protein Data Bank37 and MWCENM based NMA was performed using Matlab. All protein images were generated by Visual Molecular Dynamics.38 Matlab code for both MWCENM and traditional ENM were taken from the online morph server KOSMOS (http://bioengineering.ac.kr/kosmos).39 NMA with various simulation options can be requested from KOSMOS, and the simulation results can be downloaded and visualized using a 3D interactive viewer.
Figure 2 compares the NMA results of closed-form proteins by representing CSO (see Methods section) distributions over the first twenty lowest modes. CSO results from MWCENM are shown as a blue solid line, while the red dashed line represents those from traditional ENM, with a distance cutoff of 11 Å. The first six zeros in the CSO values indicate rigid-body motions.
Figure 2.
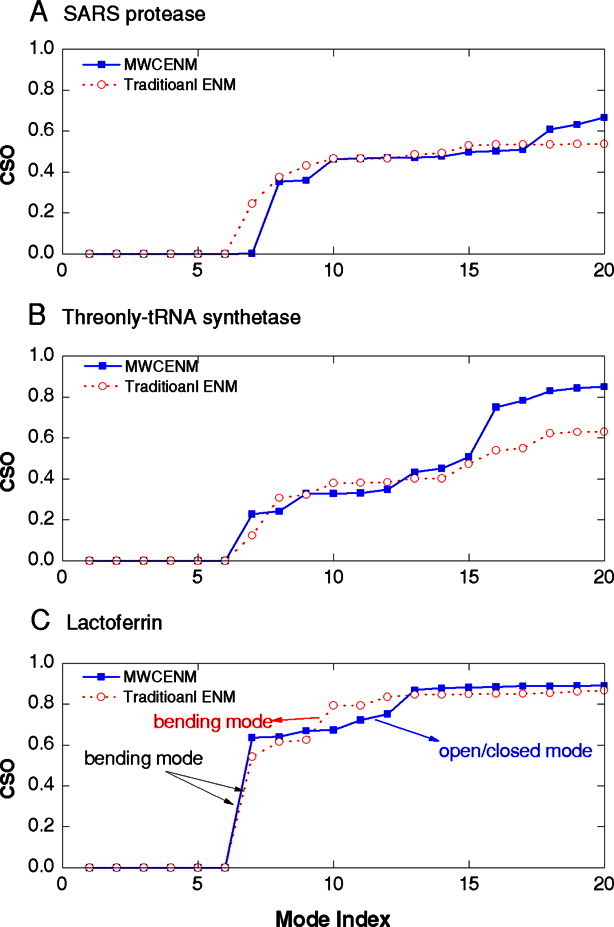
The CSO values of closed-form proteins using the traditional ENM (red dashed line with open circles) and MWCENM (blue solid line with closed rectangle). The first six modes are always zero, representing rigid body motions. [Color figure can be viewed in the online issue, which is available at http://wileyonlinelibrary.com.]
The MWCENM method clearly gives similar or even higher CSO values than traditional ENM. In the case of SARS protease, the CSO value from MWCENM is more than 0.66, whereas the value from traditional ENM is only 0.53. Both methods have the largest increase in the CSO value at the 8th mode. Additionally, two other increases in the CSO value occur at the 10th and the 18th modes of MWCENM. Figure 2(B) shows a more impressive result for threonyl-tRNA synthetase. Both methods show the similar CSO profiles until MWCENM has the largest increase in the CSO value at the 16th mode. MWCENM ultimately achieves the CSO value to 0.85, as compared with 0.63 from traditional ENM, when the first 20 lowest modes are accumulated. As lower frequency modes are closely correlated with more significant functional motions, these high overlap values strongly demonstrate the better simulation accuracy of the proposed MWCENM.36, 40
We also test the closed-form of lactoferrin [Fig. 2(C)]. Unlike the results for SARS protease and threonyl-tRNA synthetase, both traditional ENM and MWCENM achieved nearly the same CSO distribution. Although one can observe the same bending motion at the 7th mode, which represents one of the most significant functional motions of lactoferrin, another peak at the 12th mode involves remarkably different vibration behaviors, depending on the types of ENM.
Figure 3 illustrates the 10th and the 12th mode shapes from traditional ENM and MWCENM, respectively. For comparison, we illustrate the conformational change from the closed form to the open form that is represented by a combination of two large collective motions: the bending motion between the head and the two lobes, and the relative scissoring motion between the two lobes. Figure 3(B) shows an additional bending motion generated by the 10th mode of the traditional ENM. If we approximate the first bending motion, which occurs at the 7th mode, to a half sine wave with a hinge point in the middle, this second bending motion approximates a full sine wave where the upper head and the lower lobes bend in opposite direction to one another. In particular, MWCENM captures the scissoring motion between the two lobes at the 12th mode [Fig. 3(C), Supporting Information]. This result not only correlates well with the significant conformational change in lactoferrin observed in Figure 3(A), but also agrees with previous studies.17, 22, 29 From these results, we are convinced that the proposed MWCENM is able to better capture the intrinsic dynamics of proteins in closed form because it contains enough detailed information about mass weights and chemical interactions, and properly modulates the number of spring connections. An excess of spring connections has often appeared to be the limitation of traditional ENM.
Figure 3.
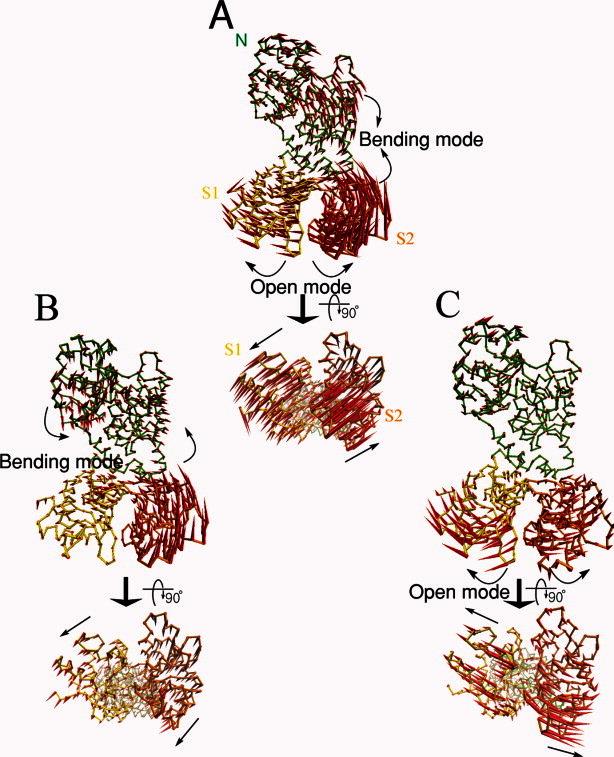
The comparison of the important normal mode shapes of the closed-form of lactoferrin. N, S1, and S2 denote, respectively, the three domains of lactoferrin: head (green), left lobe (yellow), and right lobe (orange). The red arrows indicate the directional vectors at each residue. (A) The conformational change vector from the closed form to the open form. (B) The 10th normal mode vectors from traditional ENM. An interactive view is available in the electronic version of the article. (C) The 12th normal mode vectors from MWCENM. An interactive view is available in the electronic version of the article. [Color figure can be viewed in the online issue, which is available at http://wileyonlinelibrary.com.]
Additionally, we tested seven other proteins, which also have both open and closed conformations. The CSO results from all 10 exampled proteins are listed in Table I. In the case of closed forms, MWCENM method clearly shows higher CSO values than traditional ENM. Moreover, most of closed form proteins get the higher overlap values at lower modes when the MWCENM method is applied. In contrast, the CSO results for the open forms by MWCENM method are not that much higher but still similar those of the traditional ENM. This quantitative study strongly suggests that MWCENM be one of the best choices for protein modeling, regardless of the type of protein conformation.
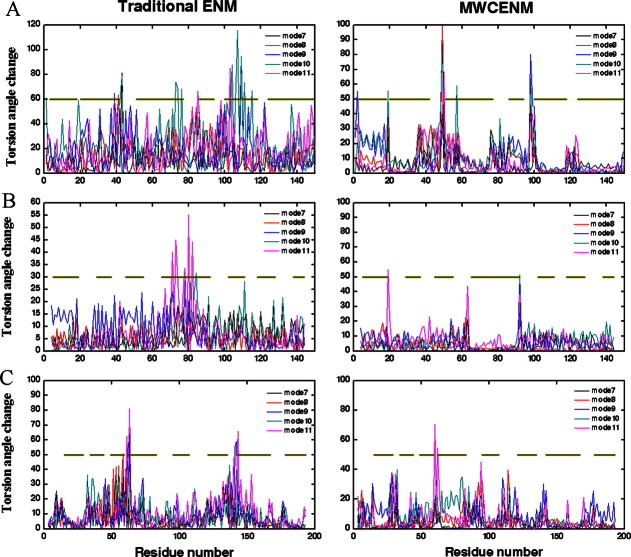
We also measured the torsion angle change for alpha helix rich proteins to test how well MWCENM can preserve secondary structures in NMA. The first five nonrigid-body modes were used to calculate torsion angle changes, and these results are depicted in Figure 4. Each torsion angle change for each mode is represented by a different color line, and alpha helical regions are marked with gold lines in the middle. Figure 4(A) shows the case of myoglobin. The fluctuation of torsion angle by MWCENM clearly distinguished alpha helical regions from others. Most high peaks are placed out of alpha helical regions. In contrast, alpha helical regions are not easily identifiable from traditional ENM, because of the large and disordered torsion angle variation. The mode shape comparison between MWCENM and tradition ENM also supports these results (Supporting Information). At the 7th mode shape from traditional ENM, each alpha helix comprising myoglobin fails to preserve its original conformation showing bending or twist motion, whereas all alpha helices in MWCENM either translate or rotate like rigid bodies. An interactive view is available in the electronic version of the article.
Figure 4.
Comparison of traditional ENM (left) with MWCENM (right) in terms of torsion angle fluctuation caused by the first five nonrigid-body modes. The gold lines located in the middle of each plot indicate alpha helical regions. (A) Myoglobin (PDB: 101M), (B) Calmodulin (PDB: 1CLL), and (C) Human UMP/CMP kinase (PDB: 1TEV). [Color figure can be viewed in the online issue, which is available at http://wileyonlinelibrary.com.]
Calmodulin provides a more vivid comparison traditional ENM and the proposed MWCENM [Fig. 4(B)]. Among many alpha helixes within calmodulin, we focus on the longest one comprising residues 65–92. Every mode from MWCENM achieves torsion angle changes close to zero, whereas the corresponding modes in traditional ENM show higher values by comparison. Similar results are observed for human UMP/CMP kinase [Fig. 4(C)].
Consequently, we note that NMA based on traditional ENM fails to capture secondary structures in proteins. In contrast, the proposed MWCENM preserves the rigidity of proteins and enables us to identify secondary structural regions by measuring the torsion angle change. This good performance of MWCENM is because it replaces many unrealistic distance-based virtual springs in traditional ENM with realistic hydrogen bonds found in alpha helical regions.
To compare the simulation complexity of traditional ENM with the proposed MWCENM, we measured the computation time required for each method. MWCENM usually requires less computational time than traditional ENM because it is able to reduce the number of spring connections based on chemical information. In Figure 5, the results of a computational cost analysis of both traditional ENM and MWCENM are shown. The density of the elastic network is indicated by the number of connections in the linking matrix, and the required computation time to perform NMA on each protein structure is located on top of the bar graph (unit: second). As predicted, MWCENM creates a much sparser elastic network and thus requires less computation time as compared to the traditional ENM. Additionally, the sparseness of the network created increases as the protein size increases. For calculation, we use a PC with a 2.33 GHz Intel Core2 Quad CPU and 4.00 GB of RAM.
Figure 5.
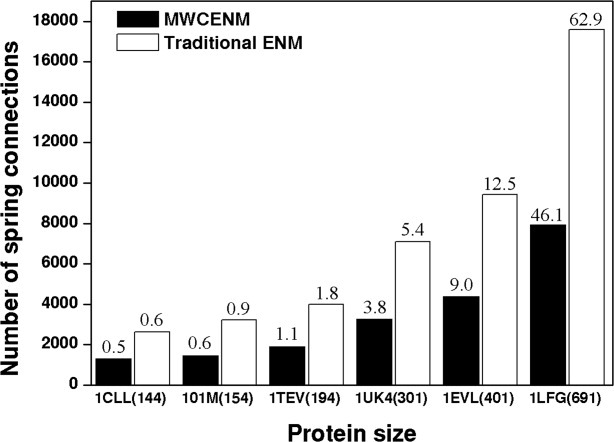
Elastic network density comparison between traditional ENM (white bar) and MWCENM (black bar). Each protein size is represented as the number of residues inside parentheses. The elapsed time for NMA is also displayed on the top of each bar graph.
Discussion
In traditional alpha carbon coarse-grained ENM, various existing chemical interactions including covalent bonds, hydrogen bonds, ionic bonds, disulfide bonds, and van der Waals interactions are oversimplified by a distance based connection rule with a uniform spring constant. Therefore, NMA based on traditional ENM has some limitations in describing realistic conformational changes of proteins. For example, NMA of closed-form proteins often fails to capture their intrinsic functional motions, such as opening mode, because of unrealistic excessive spring connections among proximal regions. In addition, traditional ENM is also inadequate for representing the rigidity of secondary structural elements, such as alpha helices, when NMA is executed. To overcome these problems, MWCENM is proposed in this article. This method achieves both simulation accuracy and computational efficiency by not only optimizing the elastic network with various stiffness values according to the types of chemical interactions, but also considering the inertial effect of each amino acid as a lumped sum mass at the representative alpha carbon atom.
To validate the proposed method, several case studies were performed. First, the overlap values for closed-form proteins were investigated. MWCENM mostly shows higher CSO values than traditional ENM, and captures functionally important opening modes that are rarely observed in traditional ENM. Second, the torsion angle fluctuation, which is highly correlated with the rigidity of a protein structure, is observed in alpha helix rich proteins. MWCENM preserves alpha helical structures better than traditional ENM. We also compared the computational complexity in terms of computation time and elastic network density. The optimal connectivity in MWCENM dramatically reduces the computation time as the size of protein increases. Consequently, the proposed MWCENM enables us to understand protein dynamics more rapidly and more precisely by adopting more precise spring connection rules.
Methods
MWENM with NMA
In MWCENM, the elastic network is constructed using two procedures called backbone modeling and spatial interaction modeling. In backbone modeling, four consecutive atoms along the backbone (i.e., from the ith to the i + 3th alpha carbon in proteins) are connected using virtual springs. Because these constraints in Cartesian space are equivalent to the 3N-6 internal coordinate representations, including N-1 bond lengths, N-2 bond angles, and N-3 torsion angles, they can stabilize the stiffness matrix by generating only six zero eigenvalues corresponding to rigid-body motions. Then, other spring connections that represent the nonsequential but spatially close interactions, such as disulfide bonds, hydrogen bonds, salt bridges, and van del Waals interaction, are added to the network model. Although the backbone modeling is required to ensure system stability in MWCENM, the spatial interaction modeling is the required to improve the accuracy of the simulation model.
The order of magnitude of the stiffness value is assigned to each spring on the basis of the order of averaged bonding energy for the corresponding chemical interaction.41, 42 First, the strongest bonds, such as backbone covalent bonds, and disulfide bonds are easily modeled because a PDB file includes the information for these bonds. Second, hydrogen bonds are modeled using the HBPLUS program, which automatically generates hydrogen bond information from the topology of the given protein structure.43 Third, salt bridges are created between every pair of charged amino acids (i.e., interaction between cation and anion within 4 Å).44 Finally, van der Walls interactions are added to MWCENM depending on the distance between all pair of representative atoms within the 8 Å, because these nonbonded interactions are relatively weak and follow a Lennard–Jones potential profile, where the reliable energy state ranges up to 8 Å.45 Table II summarizes the various stiffness values applied to MWCENM.
Table II.
Various Stiffness Values in MWCENM
| Connection type | Stiffness ratio | Cutoff condition |
|---|---|---|
| Backbone (covalent) | 100 | Residue number (between ith and I + 1th) |
| Backbone (nonbonded) | 1 | Residue number (between ith and i + 2/I + 3th) |
| Disulfide bond | 100 | PDB information |
| Hydrogen bonda | 10 | HBPLUS |
| Salt-bridge | 10 | Distance between charged residues <4 Å |
| Van der Waals forceb | 1 | Nonbonded distance <4 Å |
 |
4 Å ≤ Nonbonded distance, dij< 8 Å |
HBPLUS is a program used to calculate all the possible hydrogen bonds within a protein.
The stiffness ratio for the second range of Van der Waals force interaction is only fitted by the attractive term of Lennard–Jones potential.
Regarding NMA, the equation of motion is derived from the Lagrangian mechanics such that
| (1) |
where L = T – V. T and V mean the kinetic energy and potential energy of the given MWCENM, respectively. δi is the ith component of generalized deviation vector δ ∈ ℝ3N. It is physical meaning is a small fluctuation from the initial position of the ith atom xi(0) so that xi(t) = xi (0) + δi (t). The total kinetic energy in a network of n point masses is obtained by a summation of the kinetic energy of all constituent atoms. Thus,
| (2) |
where mi corresponds to a specific lumped mass value depending on the amino acid type. In addition, the total potential energy forms
| (3) |
where ki,j is a spring constant between the ith and jth atom based on Table II. Substitution of these two energy terms into Eq. (1) yields the following equation of motion and its full derivation is available at Ref. 16.
| (4) |
where M is a global inertia matrix consisting of sub-diagonal matrices Mi,i each of which has a specific lumped mass value mi. Likewise, K is a global stiffness matrix that includes various sub-stiffness matrices Ki,j, which are derived from the potential energy and defined by the following equations.
 |
(5) |
Substitution of  by
by  in Eq. (4) yields the mass-weighted stiffness matrix
| (6) |
Once NMA is performed with respect to the transformed vector  in Eq. (6), the obtained eigenvector set should be inversely transformed by the multiplication of M−1/2. From this process, one can obtain both eigenvalues and eigenvectors of the given MWCENM, which can be interpreted as vibration frequencies and corresponding vibration modes, respectively.46
Overlap of normal modes
The overlap value is widely used to compare the similarity between the direction of conformational changes and the calculated normal mode of given protein. It is defined by Marques and Sanejouand,47 such that
| (7) |
where Oj is the overlap value between the jth normal mode vector and the conformational change vector. aij is the eigenvector of the ith alpha carbon at the jth normal mode, and ri is the displacement vector of the ith alpha carbon between the two given superimposed structures. A higher overlap value correlated with, higher modeling accuracy. An overlap value of 1 implies that the computed normal mode vector exactly captures the direction of conformational change. To validate the proposed MWCENM, we also used the cumulative square overlap (CSO) of the first k modes, defined as
| (8) |
which quantitatively measures how well the first k modes represent the conformational change of the given protein cooperatively.10
Torsion angle
Torsion angle variation along the backbone numerically represents the 3D topology of a given protein. Protein rigidity, (or flexibility), can easily be measured by the torsion angle change during local vibration or a large conformational transition. Figure 6 illustrates the torsion angle defined by the angle between two plains π1 and π2, each of which is sequentially formed by three consecutive atoms among the four given atoms Ci−2, Ci+1, Ci, and Ci+1.
Figure 6.
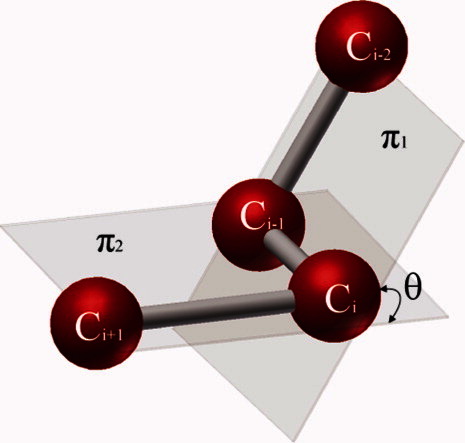
Schematic of torsion angle definition. π1 is the plane defined by the first three atoms Ci−2, Ci−1, and Ci. Similarly, π2 is defined by the next three atoms Ci−1, Ci, and Ci+1. The torsion angle, θ, is determined by the angle between these two planes. [Color figure can be viewed in the online issue, which is available at http://wileyonlinelibrary.com.]
Supplementary material
Additional Supporting Information may be found in the online version of this article.
References
- 1.Bahar I, Atilgan A, Demirel M, Erman B. Vibrational dynamics of folded proteins: significance of slow and fast motions in relation to function and stability. Phys Rev Lett. 1998;80:2733–2736. [Google Scholar]
- 2.Keskin O, Durell SR, Bahar I, Jernigan RL, Covell DG. Relating molecular flexibility to function: a case study of tubulin. Biophys J. 2002;83:663–680. doi: 10.1016/S0006-3495(02)75199-0. [DOI] [PMC free article] [PubMed] [Google Scholar]
- 3.Levitt M, Warshel A. Computer simulation of protein folding. Nature. 1975;253:694–698. doi: 10.1038/253694a0. [DOI] [PubMed] [Google Scholar]
- 4.McCammon JA, Gelin BR, Karplus MK. Dynamics of folded proteins. Nature. 1977;267:585–590. doi: 10.1038/267585a0. [DOI] [PubMed] [Google Scholar]
- 5.Matsushita S, Adachi T, Inoue Y, Hojo M, Sokabe M. Evaluation of extensional and torsional stiffness of single actin filaments by molecular dynamics analysis. J Biomech. 2010;43:3162–3167. doi: 10.1016/j.jbiomech.2010.07.022. [DOI] [PubMed] [Google Scholar]
- 6.Cheon M, Chang I, Hall CK. Spontaneous formation of twisted Aβ(16-22) fibrils in large-scale molecular-dynamics simulations. Biophys J. 2011;101:2493–2501. doi: 10.1016/j.bpj.2011.08.042. [DOI] [PMC free article] [PubMed] [Google Scholar]
- 7.McCammon JA, Harvey SC. Dynamics of proteins and nucleic acids. Cambridge. UK: Cambridge University Press; 1987. [Google Scholar]
- 8.Frenkel D, Smit B. Understanding molecular simulation. Orlando, USA: Academic Press; 2002. [Google Scholar]
- 9.Qian P, Seo S, Kim J, Kim S, Lim BS, Liu WK, Kim BJ, LaBean TH, Park SH, Kim MK. DNA nanotube formation based on normal mode analysis. Nanotechnology. 2012;23:105704. doi: 10.1088/0957-4484/23/10/105704. [DOI] [PubMed] [Google Scholar]
- 10.Kim S, Kim J, Qian P, Shin J, Amin R, Ahn SJ, LaBean TH, Kim MK, Park SH. Intrinsic DNA curvature of double-crossover tiles. Nanotechnology. 2011;22:245706. doi: 10.1088/0957-4484/22/24/245706. [DOI] [PubMed] [Google Scholar]
- 11.Yang L, Song G, Jernigan RL. Protein elastic network models and the ranges of cooperativity. Proc Nat Acad Sci U S A. 2009;106:12347–12352. doi: 10.1073/pnas.0902159106. [DOI] [PMC free article] [PubMed] [Google Scholar]
- 12.Yang L, Song G, Jernigan RL. How well can we understand large-scale protein motions using normal modes of elastic network models? Biophys J 9. 2007;3:920–909. doi: 10.1529/biophysj.106.095927. [DOI] [PMC free article] [PubMed] [Google Scholar]
- 13.Jang Y, Jeong JI, Kim MK. UMMS: constrained harmonic and anharmonic analyses of macromolecules based on elastic network models. Nucleic Acids Res. 2006;34:W57–W62. doi: 10.1093/nar/gkl039. [DOI] [PMC free article] [PubMed] [Google Scholar]
- 14.Kim MK, Jang Y, Jeong JI. Using harmonic analysis and optimization to study macromolecular dynamics. Int J Control Autom. 2006;4:382–393. [Google Scholar]
- 15.Kim MK, Jernigan RL, Chirikjian GS. An elastic network model of HK97 capsid maturation. J Struct Biol. 2003;143:107–117. doi: 10.1016/s1047-8477(03)00126-6. [DOI] [PubMed] [Google Scholar]
- 16.Kim MK, Chirikjian GS, Jernigan RL. Elastic models of conformational transitions in macromolecules. J Mol Graph Model. 2002;21:151–160. doi: 10.1016/s1093-3263(02)00143-2. [DOI] [PubMed] [Google Scholar]
- 17.Kim MK, Jernigan RL, Chirikjian GS. Efficient generation of feasible pathways for protein conformational transitions. Biophys J. 2002;83:1620–1630. doi: 10.1016/S0006-3495(02)73931-3. [DOI] [PMC free article] [PubMed] [Google Scholar]
- 18.Tirion M. Large amplitude elastic motions in proteins from a single-parameter, atomic analysis. Phys Rev Lett. 1996;77:1905–1908. doi: 10.1103/PhysRevLett.77.1905. [DOI] [PubMed] [Google Scholar]
- 19.Bahar I, Atilgan AR, Erman B. Direct evaluation of thermal fluctuations in proteins using a single-parameter harmonic potential. Fold Des. 1997;2:173–181. doi: 10.1016/S1359-0278(97)00024-2. [DOI] [PubMed] [Google Scholar]
- 20.Jeong JI, Jang Y, Kim MK. A connection rule for alpha-carbon coarse-grained elastic network models using chemical bond information. J Mol Graph Model. 2006;24:296–306. doi: 10.1016/j.jmgm.2005.09.006. [DOI] [PubMed] [Google Scholar]
- 21.Atilgan a R, Durell SR, Jernigan RL, Demirel MC, Keskin O, Bahar I. Anisotropy of fluctuation dynamics of proteins with an elastic network model. Biophys J. 2001;80:505–515. doi: 10.1016/S0006-3495(01)76033-X. [DOI] [PMC free article] [PubMed] [Google Scholar]
- 22.Gerstein M, Anderson BF, Norris GE, Baker EN, Lesk AM, Chothia C. Domain closure in lactoferrin. Two hinges produce a see-saw motion between alternative close- packed interfaces. J Mol Biol. 1993;234:357–372. doi: 10.1006/jmbi.1993.1592. [DOI] [PubMed] [Google Scholar]
- 23.Gerstein M, Lesk aM, Chothia C. Structural mechanisms for domain movements in proteins. Biochemistry. 1994;33:6739–6749. doi: 10.1021/bi00188a001. [DOI] [PubMed] [Google Scholar]
- 24.Jacobs DJ, Rader aJ, Kuhn LA, Thorpe MF. Protein flexibility predictions using graph theory. Proteins. 2001;44:150–165. doi: 10.1002/prot.1081. [DOI] [PubMed] [Google Scholar]
- 25.Delarue M, Dumas P. On the use of low-frequency normal modes to enforce collective movements in refining macromolecular structural models. Proc Natl Acad Sci U S A. 2004;101:6957–6962. doi: 10.1073/pnas.0400301101. [DOI] [PMC free article] [PubMed] [Google Scholar]
- 26.Yang H, Yang M, Ding Y, Liu Y, Lou Z, Zhou Z, Sun L, Mo L, Ye S, Pang H, Gao GF, Anand K, Bartlam M, Hilgenteld R, Rao Z. The crystal structures of severe acute respiratory syndrome virus main protease and its complex with an inhibitor. Proc Natl Acad Sci U S A. 2003;100:13190–13195. doi: 10.1073/pnas.1835675100. [DOI] [PMC free article] [PubMed] [Google Scholar]
- 27.Lee TW, Cherney MM, Huitema C, Liu J, James KE, Powers JC, Eltis LD, James MN. Crystal structures of the main peptidase from the SARS coronavirus inhibited by a substrate-like aza-peptide epoxide. J Mol Biol. 2005;353:1137–1151. doi: 10.1016/j.jmb.2005.09.004. [DOI] [PMC free article] [PubMed] [Google Scholar]
- 28.Sankaranarayanan R, Dock-Bregeon AC, Rees B, Bovee M, Caillet J, Romby P, Francklyn CS, Moras D. Zinc ion mediated amino acid discrimination by threonyl-tRNA synthetase. Nat Struct Biol. 2000;7:461–465. doi: 10.1038/75856. [DOI] [PubMed] [Google Scholar]
- 29.Kim MK, Jernigan RL, Chirikjian GS. Rigid-cluster models of conformational transitions in macromolecular machines and assemblies. Biophys J. 2005;89:43–55. doi: 10.1529/biophysj.104.044347. [DOI] [PMC free article] [PubMed] [Google Scholar]
- 30.Li T, Quillin ML, Phillips GN, Olson JS. Structural determinants of the stretching frequency of CO bound to myoglobin. Biochemistry. 1994;33:1433–1446. doi: 10.1021/bi00172a021. [DOI] [PubMed] [Google Scholar]
- 31.Chattopadhyaya R, Meador WE, Means AR, Quiocho FA. Calmodulin structure refined at 1.7 A resolution. J Mol Biol. 1992;228:1177–1192. doi: 10.1016/0022-2836(92)90324-d. [DOI] [PubMed] [Google Scholar]
- 32.Segura-Peña D, Sekulic N, Ort S, Konrad M, Lavie A. Substrate-induced conformational changes in human UMP/CMP kinase. J Biol Chem. 2004;279:33882–33889. doi: 10.1074/jbc.M401989200. [DOI] [PubMed] [Google Scholar]
- 33.Flores S, Echols N, Milburn D, Hespenheide B, Keating K, Lu J, Wells S, Yu EZ, Thorpe M, Gerstein M. The database of macromolecular motions: new features added at the decade mark. Nucleic Acids Res. 2006;34:D296–D301. doi: 10.1093/nar/gkj046. [DOI] [PMC free article] [PubMed] [Google Scholar]
- 34.Gerstein M, Krebs W. A database of macromolecular motions. Nucleic Acids Res. 1998;26:4280–4290. doi: 10.1093/nar/26.18.4280. [DOI] [PMC free article] [PubMed] [Google Scholar]
- 35.Delarue M. Simplified normal mode analysis of conformational transitions in DNA-dependent polymerases: the elastic network model. J Mol Biol. 2002;320:1011–1024. doi: 10.1016/s0022-2836(02)00562-4. [DOI] [PubMed] [Google Scholar]
- 36.Tama F, Sanejouand YH. Conformational change of proteins arising from normal mode calculations. Prot Eng. 2001;14:1–6. doi: 10.1093/protein/14.1.1. [DOI] [PubMed] [Google Scholar]
- 37.Berman HM, Westbrook J, Feng Z, Gilliland G, Bhat TN, Weissig H, Shindyalov IN, Bourne PE. Allen FH, Bergerhoff G, Sievers R, editors. The protein data bank. Nucleic Acids Res. 2000;28:235–242. doi: 10.1093/nar/28.1.235. [DOI] [PMC free article] [PubMed] [Google Scholar]
- 38.Humphrey W, Dalke A, Schulten K. VMD: visual molecular dynamics. J Mol Graph. 1996;14:33–38. doi: 10.1016/0263-7855(96)00018-5. 27–28. [DOI] [PubMed] [Google Scholar]
- 39.Seo S, Kim MK. KOSMOS: a universal morph server for nucleic acids, proteins and their complexes. Nucleic Acids Res. 2012;40:W531–W536. doi: 10.1093/nar/gks525. [DOI] [PMC free article] [PubMed] [Google Scholar]
- 40.Dynamics M. Low frequency motion in proteins. J Comput Phys. 1999;189:169–189. [Google Scholar]
- 41.Berg JM, Tymoczko JL, Stryer L. Biochemistry. New York: WH Freedman; 2002. [Google Scholar]
- 42.Martin DR, Ozkan SB, Matyushov DV. Dissipative electro-elastic network model of protein electrostatics. Phys Biol. 2012;9:036004. doi: 10.1088/1478-3975/9/3/036004. [DOI] [PubMed] [Google Scholar]
- 43.McDonald IK, Thornton JM. Satisfying hydrogen bonding potential in proteins. J Mol Biol. 1994;238:777–793. doi: 10.1006/jmbi.1994.1334. [DOI] [PubMed] [Google Scholar]
- 44.Martz E. Protein explorer: easy yet powerful macromolecular visualization. Trends Biochem Sci. 2002;27:107–109. doi: 10.1016/s0968-0004(01)02008-4. [DOI] [PubMed] [Google Scholar]
- 45.Levitt M. Energy refinement of hen egg-white lysozyme. J Mol Biol. 1974;82:393–420. doi: 10.1016/0022-2836(74)90599-3. [DOI] [PubMed] [Google Scholar]
- 46.Hinsen K. Analysis of domain motions by approximate normal mode calculations. Proteins. 1998;33:417–429. doi: 10.1002/(sici)1097-0134(19981115)33:3<417::aid-prot10>3.0.co;2-8. [DOI] [PubMed] [Google Scholar]
- 47.Marques O, Sanejouand YH. Hinge-bending motion in citrate synthase arising from normal mode calculations. Proteins. 1995;23:557–560. doi: 10.1002/prot.340230410. [DOI] [PubMed] [Google Scholar]
Associated Data
This section collects any data citations, data availability statements, or supplementary materials included in this article.


