

Abstract
Mammalian spermatogenesis consists of many cell types and biological processes and serves as an excellent model for studying gene regulation at transcriptional and post-transcriptional levels. Many key proteins, miRNAs, and perhaps piRNAs have been shown to be involved in post-transcriptional regulation of spermatogenesis. However, a systematic method for assessing the relationship between protein and mRNA expression has not been available for studying mechanisms of post-transcriptional regulation. In the present study, we used the iTRAQ-based quantitative proteomic approach to identify 2008 proteins in mouse type A spermatogonia, pachytene spermatocytes, round spermatids, and elongative spermatids with high confidence. Of these proteins, 1194 made up four dynamically changing clusters, which reflect the mitotic amplification, meiosis, and post-meiotic development of germ cells. We identified five major regulatory mechanisms termed “transcript only,” “transcript degradation,” “translation repression,” “translation de-repression,” and “protein degradation” based on changes in protein level relative to changes in mRNA level at the mitosis/meiosis transition and the meiosis/post-meiotic development transition. We found that post-transcriptional regulatory mechanisms are related to the generation of piRNAs and antisense transcripts. Our results provide a valuable inventory of proteins produced during mouse spermatogenesis and contribute to elucidating the mechanisms of the post-transcriptional regulation of gene expression in mammalian spermatogenesis.
Spermatogenesis in animals is a complex yet tightly regulated developmental process that involves many cell types. Similar to other cellular developments, spermatogenesis is sustained by the self-renewal of stem cells, amplified by multiple rounds of mitotic division of progenitor and intermediate cells, and accomplished by generating terminally differentiated spermatozoa. However, it is distinguishable from other cellular developments because of the occurrence of meiosis, the dynamic remodeling of chromatin, and the formation of many specialized structures such as the acrosome and the flagellum. It is believed that each step of this lengthy differentiation process is supported by the expression of a unique set of genes whose regulation may occur at different levels (1).
It has long been known that global transcription is active in round spermatids (rST)1 but is significantly reduced in elongating and elongated spermatids (eST) when histones are sequentially replaced by transition proteins and protamines (2, 3). Therefore, mRNAs for proteins needed by eST and mature sperm must be formed in advance but are translationally repressed because premature formation of these proteins is detrimental to spermatogenesis (4, 5). For example, mRNAs for transition proteins and protamines are transcribed in rST, stored as translationally repressed messenger ribonucleoprotein particles (mRNPs), and subsequently translated in eST (6, 7). One way such translational repression is achieved is through RNA binding proteins that interact with other proteins to suppress translation initiation (8). For example, the two cytoplasmic poly(A)-binding proteins (Pabpc1 and 2) bind to poly(A) tails and participate in translation repression (9).
miRNAs are well-known for their roles in post-transcriptional regulation of gene expression (10). Conditional knockout of Dicer1, the enzyme responsible for the processing of miRNAs, in primordial germ cells results in spermatogenic defects at multiple stages including at the development of primordial germ cells (PGCs), spermatogonia, rST and sperm. This indicates that miRNAs also participate in post-transcriptional regulation during spermatogenesis (11, 12). In mice, piRNAs are a unique set of small RNAs specifically expressed in germ cells and associated with PIWI proteins including MIWI, MILI, and MIWI2. piRNAs generated at different stages of spermatogenesis have different features. piRNAs produced by PGCs and spermatogonia map to repeat sequences and play important roles in retrotransposon control at the levels of RNA metabolism and DNA methylation (13). piRNAs are also processed from mRNAs mainly in spermatogonia and from long precursor RNAs transcribed from the intergenic regions in spermatocytes and spermatids (14). It is still unclear whether these piRNAs have biological functions or if they are instead products of RNA metabolism. It is well-documented that proteins related to piRNA production—such as MILI, MIWI, and MIWI2—are essential for mouse spermatogenesis because their gene knockouts result in spermatogenesis arrest at multiple stages (15). piRNAs and/or PIWI proteins may also be involved in translational regulation because they are detected in RNP, monosomes, and polysomes (16, 17). Some PIWI proteins also interact with translation initiation complex containing initiation factors such as eIF3a, eIF4G, and eIF4E (16).
Natural antisense transcripts are RNAs transcribed from the opposite DNA strand to other transcripts. The most prominent form of antisense transcripts in mammalian genome is a nonprotein-coding antisense transcript of a protein-coding one. Antisense transcripts regulate gene expression at both transcriptional and post-transcriptional levels (18). Pairing of antisense transcripts to their sense RNAs could either increase the stability of sense RNAs or induce the generation of endogenous siRNAs (19, 20). Alternatively, antisense transcripts may instead block the translation of the sense mRNAs without changing the levels of the latter (21, 22). It has been known that antisense transcripts are highly expressed in the testis, particularly in haploid cells (23, 24). Therefore, antisense transcripts are likely active regulators of gene expression during spermatogenesis.
It is important to know how protein levels change in relation to their mRNA levels to understand post-transcription regulation of gene expression. A number of high throughput profiling studies of mRNA expression during mammalian spermatogenesis have been conducted in the past decade (1). Several high-throughput protein identification studies have also been performed in the gonads or germ cells of some mammalian species (25–30). However, large-scale quantitative analysis of protein dynamics during mouse spermatogenesis has not been conducted. We used an isobaric tag for relative and absolute quantitation (iTRAQ)-based quantitative proteomic approach to investigate the levels of several thousands of proteins in four types of germ cells—type A spermatogonia (SG-A), pachytene spermatocytes (pacSC), rST, and eST—which represent important stages of mammalian spermatogenesis. We compared the changes in the levels of proteins and mRNAs and identified the features of these genes in relation to piRNA and antisense transcript production. Our study will contribute to the understanding of the post-transcription regulation of gene expression during mammalian spermatogenesis.
EXPERIMENTAL PROCEDURES
Isolation of Germ Cells
CD-1 male mice were used for germ cell isolation using the STAPUT method (31) as described previously (14). Type A spermatogonia (SG-A) and pachytene spermatocytes (pacSC) were isolated from the testes of 8 days postpartum (dpp) and 17 dpp mice, respectively. Round spermatids (rST) and elongative spermatids (eST) were isolated from the testes of adult mice. For all cell types, cell purity exceeded 90% based on morphological evaluation and confirmed by RT-PCR and Western blot evaluations of two panels of spermatogenic cell marker genes (supplemental Fig. S1).
Cell lysis and Protein Extraction
Cells isolated as described above were washed three times in cold PBS and homogenized at 4 °C in lysis buffer (1× PBS, 1%Nonidet P-40, 0.5% sodium deoxycholate, 0.1% SDS, and EDTA-free protease inhibitor mixture from Roche). Lysates were centrifuged at 15,000 × g for 30 min at 4 °C to remove cell debris. Supernatants were collected and protein concentration was determined using the Bradford assay (32) with BSA as standard.
Protein Digestion and iTRAQ Labeling
One hundred micrograms of proteins of SG-A, pacSC, rST, and eST were precipitated with six volumes of cold acetone at −20 °C for 4 h and centrifuged at 2000 × g for 5min. The acetone was removed, and the pellets were air-dried and dissolved in 20 μl of 250 mm triethylammonium bicarbonate (TEAB, pH 8.5) with 8 m urea. The proteins were reduced with 2 μl of 50 mm Tris-(2-carboxyethyl) phosphine (TCEP) and incubated at 37 °C for 1 h. Subsequently, 1 μl of the cysteine blocking reagent (200 mm methyl methanethiosulfonate, MMTS) was added and incubated at room temperature for 10 min. After being diluted fourfold with 500 mm TEAB (pH 8.5), the samples were digested with 2 μg trypsin at 37 °C for 16 h. The resulting peptide solutions were concentrated to less than 30 μl in a speed vacuum dryer and then labeled with the 4-plex iTRAQ reagent (Applied Biosysterms) according to the manufacturer's instructions. Peptides derived from the SG-A, pacSC, rST, and eST were labeled with iTRAQ tags 114, 115, 116, and 117, respectively, at ambient temperature for 2 h. The four tagged peptide samples were pooled together and stored at −80 °C until MS analysis. Two independent biological experiments each with three technical replicates were performed.
2D-LC-MS/MS Analysis
The iTRAQ labeled and pooled peptide samples were analyzed on a LTQ Orbitrap XL (Thermo Fisher Scientific, Waltham, MA) interfaced with an in-house built electrospray device. The HPLC used was an Eksigent nano-liquid chromatography (LC) two-dimensional (2D) plus system (Eksigent Technologies, CA) with a micro-pump (40 μm i.d.) and a nano-pump (25 μm i.d.). The buffer solutions used for the nano-pump were 100% water/0.1% formic acid (buffer A), and 100% acetonitrile/0.1% formic acid (buffer B). Buffer A and 700 mm ammonium acetate/0.1% formic acid (buffer C) were used for the micro-pump. For each analysis, 100 μg of 4-plex iTRAQ labeled peptides sample was pressure-loaded onto a home-made biphasic silica capillary column (250 μm I.D.) packed with 3 cm of reverse phase C18 resin (SP-120–3-ODS-A, 3 μm, the Great Eur-Asia Sci & Tech Devolopment Co., Beijing, China) and 3 cm of strong cation exchange (SCX) resin (Luma 5 μ SCX 100A, Phenomenex, Torrance, CA, USA). After sample loading, the biphasic column was washed with buffer A to desalt for 10 min. Then a gradient of buffer B ranging from 0 to 100% was applied to elute the peptides to SCX resin and excess iTRAQ reagents were removed. The biphasic column was then eluted using a 10-step salt gradient with the concentration of ammonium acetate ranging from 35 to 700 mm. Effluent from the biphasic column at each step was directed onto a 10-cm C18 analytical column (100-mm i.d.) with a 3–5 μm spray tip. Steps 1–11 had the profile as following: equilibration of the biphasic column for 3min with 95% buffer A, X% buffer C for 8 min, desalting with 95% buffer A for 3 min, a 5–40% buffer B gradient for 77 min, a 40–80% buffer B gradient for 10min, 80% buffer B for 10 min, an 85% buffer B gradient for 10 min, and a final re-equilibration of the analytical C18 column for 10 min with 95% buffer A. The percentages (X) of buffer C during the 11 steps of the 8-min elution were 5, 10, 15, 20, 25, 30, 40, 50, 60, 80, and 100, respectively. The flow rate was maintained at about 400 nl/min.
The spray voltage was set to 2.3 kV, and the temperature of the heated capillary was set to 200 °C. Survey full-scan MS spectra (m/z 300–1600) were acquired in the orbitrap with a resolution of 60,000 at m/z 400. For MS/MS, an acquisition scheme consisting of alternating collision induced dissociation and high energy collision dissociation fragmentation (CID-HCD) was employed as described by Thomas Kocher and co-worker (33). Briefly, the four most intense ions from the preview survey scan delivered by the Orbitrap were sequenced by collision-induced dissociation and high-energy collision dissociation fragmentation. CID-generated ions was detected with collision energy of 35%, Q value of 0.25, and an activation time of 30 ms. HCD was performed using collision energy of 55% and an activation time of 40 ms.
Mass Spectrometric Data Analysis
For CID-HCD data sets, data processing was performed using a Perl script (QuantMerge) developed by Thomas Kocher and co-worker (33). In short, intensities of the reporter ions (m/z 114.112, 115.1083, 116.116, and 117.1150) were extracted from the Mascot-generated mgf-file of each HCD spectrum with a mass tolerance of 10 mDa. After being normalized to 1, the intensities of the 4 iTRAQ reporter ions were pasted into the corresponding CID spectrum. The respective m/z region of the original CID spectrum were deleted at the same time. The number of paired and merged spectra and the number of unassigned spectra were reported.
Then all the MS/MS data were searched using Mascot version 2.3.02 with the target-decoy database searching strategy (34) against the mouse protein database of Ensembl Release 62 (April 15, 2011; 54,944 sequences). Search parameters included precursor ions mass tolerance of 10 ppm (monoisotopic mass), fragment ion mass tolerance of 0.8 Da (monoisotopic mass), a fixed modifications of methylthiocysteine and iTRAQ reagent labeling at the N terminus and lysine residues, a variable modification of addition of 15.999 Da on methionine (oxidation). At least 2 peptides and 95.0% protein confidence, as well as ion score cutoff >25, were required for protein identification, and the global false discovery rate (FDR) was <1%. For protein quantitation, iTRAQ labeled peptides was quantified with Mascot using the isotopic corrections, and the parameters were set as follows: (1) protein ratio type was set as “weighted”; (2) summed intensities were chosen for normalization; (3) minimum peptides was set to 2; (4) only unique peptides were selected to quantify proteins; (5) outliers were removed automatically, and the peptide threshold was set as above for homology.
Western Blot Analysis
Twenty micrograms of total protein extracts were loaded and separated by SDS-PAGE. The proteins were transferred onto polyvinylidene fluoride (PVDF) membranes. The membranes were blocked with PBST buffer containing 5% fat-free milk and 0.1% Tween 20 and then incubated with primary antibodies. After hybridization with secondary antibodies conjugated to horseradish peroxidase, immunocomplexes were visualized by Enhanced Chemiluminescence kit (Pierce, Rockford, IL). All antibodies used in this article are listed in supplemental Table S1.
Immunohistochemistry
Immunohistochemical experiments were performed according to the standard procedure. Briefly, the adult testes sections from adult CD-1 mice were fixed in Bouin's solution and embedded in paraffin. Sections were incubated in 1% hydrogen peroxide and washed in phosphate-buffered saline. They were then blocked with a rabbit serum and incubated overnight at 4 °C with primary antibodies against LDHC (1:100) and CLGN (1:100). Following three PBS washes, the sections were incubated with horseradish peroxidase conjugated secondary antibody. The immunoreactive sites were visualized brown with diaminobenzidine and mounted for bright field microscopy.
RNA Extraction, RT-PCR, Real-time RT-PCR and Orientation-specific RT-PCR
Large RNAs (>200 nt) and small RNAs were extracted from isolated cells using miRNeasy Mini Kit (Qiagen, Valencia, CA) and RNeasy MinElute Cleanup Kit (Qiagen) according to the manufacturer's instruction. For analysis of the mRNA expression, the large RNAs were used, which were reverse transcribed using M-MLV reverse transcriptase (Promega, Madison, WI) according to the manufacturer's instructions. The RT-PCR was carried out with TaqDNA Polymerase (Takara, Kyoto, Japan). Real-time RT-PCR analysis was performed with qPCR smart mix (MyLab). Reactions were carried out using the ABI 7500 Sequence Detection System and analyzed using the comparative Ct method (ΔΔCt) with β-actin RNA as the internal control. The piRNAs expression profile was detected by real-time PCR using the miScript PCR System of Qiagen. Orientation-specific RT-PCR was performed as described previously (35). Orientation of a transcript was assessed by restricting which primer was present during reverse transcript first-strand cDNA synthesis by reverse transcription. All primer sequences used in this article are listed in supplemental Table S2.
Analysis of Microarray Data
Analysis of mRNA expression in SG-A, pacSC, and rST was based on microarray data set (GSE4193) downloaded from the NCBI GEO database (36). Four types of germ cells (SG-A, SG-B, pacSC, and rST) were isolated by the authors using the STAPUT method that was also used by us in the present study. Chalmel et al. conducted a systematic analysis on gene expression during spermatogenesis in three species: mouse, rat, and human (ArrayExpress data set E-TABM-130) (37). We have compared the gene expression based on these two data sets and have found that they match well with each other. Both data sets (E-TABM-130 and GSE4193) were generated by using the Affymetrix Mouse Genome 430 2.0 Array. According to the Chip Description File maintained by the Microarray Lab of the Molecular and Behavioral Neuroscience Institute, University of Michigan (http://brainarray.mbni.med.umich.edu/Brainarray/Database/ CustomCDF/genomic_curated_CDF.asp), this microarray contained 17144 genes. The Pearson correlation coefficients of the expression of these genes between these two data sets in spermatogonia, spermatocytes, and spermatids were 0.94, 0.95, and 0.95, respectively. We chose to use the data set by Namekawa et al. because the germ cell types and the isolation procedures by us and those authors were the same whereas Chalmel et al. used a slightly different method. Raw microarray data were normalized using the robust multichip average algorithm implemented in the Bioconductor “affy” software package.
Clustering Analysis
Hierarchical clustering of proteins based on their expression levels was done using the web-based software Cluster (http://bonsai.hgc.jp/∼mdehoon/software/cluster/software.htm#ctv). The abundance ratios on pacSC, rST and eST were calculated for each protein using the abundance on SG-A as the baseline. We first log-transformed the ratios of each protein in the four cell types and centered values by the mean. Hierarchical clustering approach with a Spearman Rank Correlation similarity metric was used to classify the various types of expression profiles. Clustering results were visualized with TreeView program (38). According to the clustering results, the proteins were subjectively divided into four clusters. To analyze the specific biological processes of the four cluster proteins, the DAVID Bioinformatics Resources (http://david.abcc.ncifcrf.gov/) and KEEG databases (http://www.genome.jp/kegg/) were used.
Analysis of piRNAs
The analysis of piRNAs derived from piRNA-generating mRNAs (PRMRs) followed the procedure described in our previous study (14). Briefly, small RNAs of 18∼36 nt was isolated, sequenced, and mapped to the genome. Sequences mapped to miRNAs, tRNAs, and other types of small RNAs were excluded. The 24∼32 nt sequences from the remaining population were selected and found to be 5′U biased. Based on their size distribution and 5′U preference, they were regarded as piRNAs. A fraction of piRNAs were mapped to mRNAs, which were named as PRMRs. The quantity of a piRNA mapped to a PRMR was evaluated by the total number of its all reads with the sequencing depth of each sample being normalized to the same level. In the present study, we compared PRMRs identified from our SG-A piRNAs and those identified from piRNAs immunoprecipitated from 10 dpp testis with MILI antibody and found they overlap by 71% in terms of the Jaccard index of two sets, which was defined as J(A, B) = A∩B / A∪B. Based on a hypergeometric distribution, the significance level of the overlap was calculated to be p = 0 on a PC computer by using the R language formula “1 - phyper(q, m, n, k).” Briefly, based on the two piRNA sets, 6985 and 6836 PRMRs were identified, respectively. The intersection of these two PRMR sets was 5769. Given that 22578 mRNAs were used for PRMR identification, the values for the parameters in the formula were the following: q = 5769, m = 6985, n = 15593, and k = 6839. We also analyzed small RNAs from other tissues using the same procedure and found no similar piRNAs, indicating that our piRNAs from different germ cells were not artifacts derived from nonspecific RNA degradation.
Identification of Antisense SAGE Tags
Siddiqui et al. used the LongSAGE technique to profile transcripts in multiple tissues of the mouse (39). We downloaded this data set from the NCBI GEO database (GSE4726) and conducted analysis according to the strategy of Ge et al. (40). We examined the antisense transcripts in tissues of spleen (GSM106591), prostate (GSM106598), brain (GSM106622), liver (GSM106653), mammary glands (GSM113284), bone (GSM113299), ovary (GSM106666), and testis (GSM106631) in the present study. Transcripts in the testis were from all cell types without further separation.
RESULTS
Protein Dynamics During Mouse Spermatogenesis
We used the gravity sedimentation-based STAPUT method to isolate SG-A, pacSC, rST, and eST to study the protein dynamics during mouse spermatogenesis (31). The purities of these four cell types all exceeded 90% as shown by the phase contrast microscopic photos and were further validated by the unique protein and mRNA expression patterns of two panels of germ cell marker genes (supplemental Fig. S1).
Proteins from the four cell types were digested with trypsin and analyzed using the iTRAQ-based quantitative proteomic approach (supplemental Table S3). The following conditions were set to ensure reliable analysis: (1) p < 0.05 and ions score > 25; (2) FDR <1%; (3) only proteins identified with at least two unique peptides were accepted; (4) the proteins were quantitatively detected in two biological replicates. As a result, 2008 proteins were identified (supplemental Table S4). The quantification was reproducible as shown by the scatter plots of the relative abundances of proteins in different germ cells (represented by ratios of 115/114, 116/114, and 117/114) determined using two biological samples (supplemental Fig. S2).
To define fold change values that reflect true biological differences instead of intrinsic variations of the iTRAQ-based quantification system, we labeled the same protein sample (a mixture of proteins prepared from the four cell types) with the 114 and 115 tags and then examined the distribution of the 114/115 ratios (supplemental Fig. S3). As shown by the histogram, only 0.27% proteins had 114/115 ratios either greater than 1.5 or less than 0.66. Therefore, the increase and decrease fold change value cutoffs of proteins that change dynamically during spermatogenesis were set to be 1.5 and 0.66, respectively, corresponding to a p value of 0.003. Under these conditions, it was found that 1194 proteins change their levels significantly in at least one cell type during spermatogenesis. The remaining proteins (814) were regarded as not changing significantly during spermatogenesis and designated as Cluster 0. These proteins were mainly involved in house-keeping activities based on GO/KEGG functional annotations (supplemental Table S5).
Hierarchical clustering of the 1194 proteins revealed four clusters with different expression patterns (Fig. 1A). The levels of Cluster 1 (532) proteins and cluster 2 (254) proteins were higher in diploid germ cells than in haploid ones. Cluster 1 members had slightly higher levels in SG-A than in pacSC, and Cluster 2 members behaved in the opposite way. Cluster 3 proteins (155) had higher levels in pacSC and rST than in SG-A and eST. Cluster 4 proteins (253) had higher levels in haploid germ cells than in diploid ones. We found that the mRNA levels of proteins in Clusters 1 and 2 in the testis were lower than their levels in other types of tissues or cells whereas those in Clusters 3 and 4 were markedly higher in the testis than in other tissue/cell types (Fig. 1B). These results suggest that proteins in Clusters 1 and 2 are encoded by housekeeping genes whereas those in Clusters 3 and 4 are encoded by genes that were highly or specifically expressed in the testis.
Fig. 1.
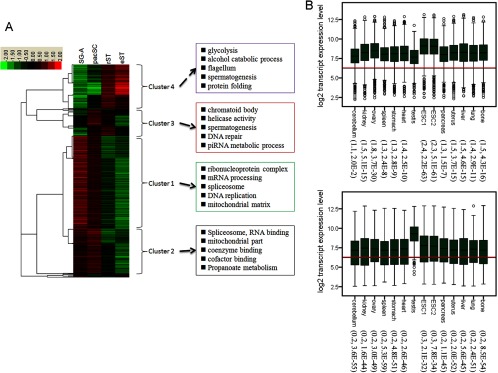
Expression and Gene Ontology analysis of differentially expressed proteins during mouse spermatogenesis. A, Hierarchical clustering of differentially expressed proteins in four types of male germ cells. The clustering was based on the Spearman's Rank Correlation similarity metric. The proteins were generally divided into premeiotic (Cluster 1 and 2) and postmeiotic (Cluster 3 and 4) clades, each of which could be further divided into two clusters. Clusters 1 and 2 were up-regulated in SG-A and pacSC whereas clusters 3 and 4 were up-regulated during and/or after meiosis. Also shown were the top five enriched GO terms using the DAVID functional annotation web tool. B, Box plots of mRNA expression of premeiotic (upper panels) and postmeiotic (lower panels) clades in various mouse tissues and two ESC lines based on microarray data set GSE15998. 12 representative tissues in mice were selected for analysis. The red line is the average of all genes from the GSE15998 data set. The fold changes of the average of gene expression in all tissues relative to the testis as well as the p values of the differences between a tissue and the testis are labeled in the parenthesis following the tissue names. The significance tests were conducted using the one-side Wilcoxon's sum test. For the premeiotic genes, we tested whether the expression in a tissue was higher than in the testis whereas for the postmeiotic genes, we tested whether the expression in a tissue was lower than in the testis. SG-A: type A spermatogonia; pacSC: pachytene spermatocytes; rST: round spermatids; eST: elongative spermatids.
Functional Annotation of Proteins Showing Dynamic Changes During Spermatogenesis
We used the web tools provided by the DAVID (41, 42) and KEGG databases (http://www.genome.jp/kegg/) to search for functional annotation terms (FATs) and pathways that are enriched in the above-identified proteins. We focused on the ontology of “cellular components” and “biological processes” for FAT enrichment analysis for which p < 0.001, FDR < 1%, and Fold Enrichment >4. Cluster 1 proteins were enriched with FATs such as “ribonucleoprotein complex,” “mRNA processing,” “spliceosome,” “DNA replication,” “mitochondrial matrix” as well as with terms related to sugar catabolic processes. Analysis using the KEGG pathway database resulted in similar results (Fig. 1A and supplemental Table S5). To give some examples, this cluster contained 9 ribosomal proteins (RPL10, RPL27, RPL36, RPL4, RPS16, RPS2, RPS4X, RPS5, RPSA), 16 RNA binding proteins (RBM12, RBM3, RBM39, RBM8A, RBMXRT, PABPC4, PABPN1, HNRNPC, HNRNPD, HNRNPH1, HNRNPK, HNRNPU, HNRNPUL2, HNRNPA1, HNRNPA0, HNRNPAB), 10 splicing factors (SF1, SF3B2, SF3B3, SF3B5, SFPQ, SRSF9, SRSF6, SRSF7, PTBP2, PUF60), eight putative RNA helicases (DDX17, DDX21, DDX5, DDX50, DDX6, DHX15, DHX29), five replication factors (RFC1 RFC2, RFC4, RPA1, RPA2), and a large number of proteins involved in mitochondrial activity and sugar, fat, and amino acid metabolism. Because some RNA binding proteins and helicases are also involved in splicing, the total number of proteins related to splicing added up to 33 according to the KEGG pathway database (supplemental Table S5 and supplemental Fig. S5). It seemed apparent that premeiotic germ cells, particularly SG-A, were extremely active in protein translation, RNA processing, DNA replication, and bio-molecule metabolism. This was consistent with the fact that spermatogonia are engaged in active proliferation that requires full-power operation of different housekeeping molecular machinery. Cluster 2 proteins were enriched with similar FATs such as “spliceosome,” “RNA binding”, “RNA processing,” and “propionate metabolism.” In Cluster 2, more proteins were added to the above families presented in Cluster 1. For example, 25 more splicing factors of the spliceosome were added to the list to make the total in both clusters 58 (supplemental Table S5 and supplemental Fig. S5). The presence of similar proteins in both Clusters 1 and 2 indicate that these two clusters can be viewed as a bigger cluster whose members either increased or decreased their abundances slightly between spermatogonia and spermatocytes. Furthermore, the relatively high levels of these proteins in spermatogonia and spermatocytes compared with levels in post-meiotic germ cells indicate that these two cell types shared many commonalities, one of which is cell division to produce large amount of gametes.
Cluster 3 was enriched with FATs such as “piRNA metabolic process,” “chromatoid body,” “helicase activity,” “DNA repair,” and “spermatogenesis.” Many well-known germ cell-specific proteins were present in this cluster. For example, PIWIL1/MIWI, PIWIL2/MILI, and TDRD1 are germ cell-specific proteins that are involved in piRNA processing and are components of the chromatoid body, which is the RNA storage and processing site (43). SYCP3 and SYCE1 are components of the synaptonemal complex and are essential for the completion of meiosis (44). The higher levels of the Cluster 3 proteins in pacSC and rST relative to other cell types indicate that pacSC started to produce proteins for their own specific need and/or for the need of rST. Cluster 4 was enriched with FATs such as “flagellum,” “acrosomal vesicle,” “endoplasmic reticulum lumen,” “protein folding,” “spermatogenesis” and terms related to sugar metabolism. Many proteins in this cluster were potentially involved in the formation of spermatid/sperm-specific organelles. For example, it contained proteins associated with the acrosome (ACRBP, SPACA1, SPACA3, SPACA5) and the flagellum (ODF2, RSPH9, RSPH1, TPPP2, TUBA8, TUBB2C, TUBB4, TUBB6). A significant portion of the proteins were spermatid/sperm-specific (TSKS, SPATA20, SPERT, SMCP and so on) and/or present in the mature sperm (ZP3R, ZPBP, THEM4, SPESP1, SORD, SLC2A3, GSTM5, to name a few) according to the sperm proteome data from the Aitken's and Karr's library (26, 45). It was also interesting to find that many kinases/phosphatases involved in sugar or protein phosphorylation/de-phosphorylation were in this cluster. Examples whose expression and/or function during spermatogenesis had been reported include PGK2 (46), PPP1CC (47), and TSKS (48). It seems that post-meiotic germ cells used a unique set of enzymes to regulate metabolic and signaling pathways to fulfill their energy or structural requirements.
Post-transcriptional Regulation of Gene Expression during Spermatogenesis
We next studied post-transcriptional regulation of gene expression during mouse spermatogenesis by comparing changes in protein levels with changes in transcript levels. Changes in mRNAs and proteins were represented by the fold-change values of their levels in two cell types (ratiom, ratiop). We used two pairs of cell types to represent two important transitions during spermatogenesis: the mitotic division to meiotic division transition (the SG-A/pacST transition) and the meiotic division to the haploid development transition (the pacSC/rST transition). Namekawa et al. studied the mRNA profiles of the mouse SG-A, pacSC, and rST using the Affymetrix GeneChip platform (NCBI GEO data set GSE4193) (36). We obtained mRNA values for 1784 proteins of the 2008 detected ones in our proteomics study. For SG-A/pacSC and pacSC/rST transitions, we plotted the log ratios of protein levels (log2ratiop) in the two interested cell types against the log ratios of their mRNAs (log2ratiom) and calculated the correlation coefficients (Figs. 2A, 2B). The Pearson correlation coefficients for these two transitions were 0.55 and 0.41, respectively, indicating that mRNA levels were poor indicators for their protein levels. Similar correlations between mRNA and protein changes have been reported recently in mouse brain (49), ESCs (50), yeast (51), and Drosophila (52).
Fig. 2.
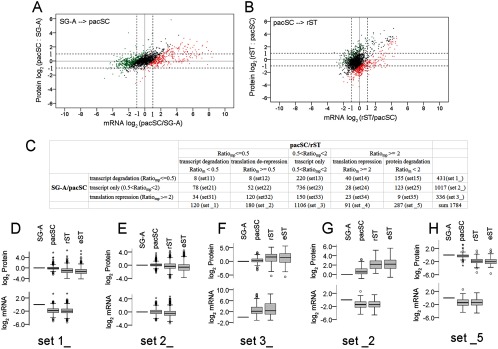
Comparative analysis of mRNA and protein level changes of 1784 proteins and their subsets in different male germ cells. The changes in mRNA and protein levels from SG-A to pacSC (A) and from pacSC to rST (B) were plotted using the log2 values of the ratios (Ratiom and Ratiop) of the normalized raw data, which were the microarray fluorescent signals for mRNAs and the total intensities of all peptide fragments for each protein. The relative change of an mRNA to its protein was represented by Ratiomp, which was the ratio of Ratiom over Ratiop. Genes of Ratiomp ≥ 2 were indicated by red points; genes of 0.5 < Ratiomp < 2 were black points; genes of Ratiomp ≤0.5 were green points. These three types of points formed two boundary lines with slopes equal to 1 and the x-axis intercepts being 1 and −1, respectively, on the log2-scale plots. C, Comparison of genes using three regulatory mechanisms at the SG-A/pacSC transition with genes using five regulatory mechanisms at the pacSC/rST transition in a pair-wise manner. The numbers of genes in each (sub-) sets and the names of (sub-) sets were shown. (D–H) Box plots of the expression levels of proteins and mRNAs of representative gene sets using the five regulatory mechanisms in the log2-scale.
For the SG-A/pacSC transition, the log-scale changes in mRNA levels were more heterogeneous than changes in their protein levels, which is evidenced by higher coefficient of variation (CV) of the former (25.7) than the latter (6.2), and the difference was significant based on the Levene's test (p = 0). For the pacSC/rST transition, CVs of the log-scale mRNA and protein level changes (-5.8, −4.0, respectively) were also statistically different (p = 1.0 × 10⁻¹¹). These data indicated discrepancy between mRNA and protein level changes, suggesting the existence of the post-transcriptional regulation of gene expression. We divided the 1784 genes into three sets based on the mRNA/protein relative changes that were described by a parameter named Ratiomp, the ratio of ratiom over ratiop. To determine the cutoff values of Ratiomp, we constructed a null distribution of this parameter by using mRNA and protein expression values of two biological replicates of pacSC and rST (supplemental Fig. S4). Based on this null distribution, the false positive rate of either the genes with Ratiomp ≤ 0.5 or the ones with Ratiomp ≥ 2 is lower than 5%. At the SG-A/pacSC transition, genes with 0.5 < Ratiomp< 2 (black dots in the plots) were the ones whose protein production or degradation occurred in quick response to their mRNA changes. Because the majority of these genes have their ratiom and ratiop values between 2∼0.5 (indicated by the dashed lines in Figs. 2A and 2B), we can also think that their mRNA and protein levels both remained unchanged (Fig. 2E). We used the term “transcript only” to describe this gene regulation mechanism to reflect that protein levels of these genes were only determined by their transcript levels. The majority of genes with Ratiomp ≥ 2 had mRNA levels that increased more than protein levels; this indicates the presence of protein translation repression at the SG-A/pacSC transition (Fig. 2F). Correspondingly, we used “translation repression” to describe this type of post-transcriptional gene regulation. In most genes with Ratiomp ≤ 0.5, mRNA levels dropped markedly whereas protein levels stayed relatively constant; this type of post-transcriptional regulation was termed “transcript degradation” (Fig. 2D).
For the pacSC/rST transition, we found that a significant portion of the genes whose Ratiomp ≥ 2 had protein levels decreased by more than twofold and mRNA levels either decreased or increased by less than twofold, suggesting large scale protein degradation (Fig. 2H). In parallel, a significant portion of the genes whose Ratiomp ≤0.5 had protein levels increased by more than twofold and mRNA levels changed by less than twofold, indicating derepression of protein translation (Fig. 2G). Accordingly, we used terms “protein degradation” and “translation de-repression” to describe these two novel post-transcriptional regulatory mechanisms identified at the pacSC/rST transition.
Dynamic Changes in Regulatory Mechanisms during Spermatogenesis
By comparing the three sets of genes using the three regulatory mechanisms at the SG-A/pacSC transition with the five sets of genes using the five regulatory mechanisms at the pacSC/rST transition in a pair-wise manner, we were able to follow the dynamic changes in the gene regulation mechanisms during spermatogenesis (Fig. 2C, supplemental Table S6). Most genes (set 23, 736 genes) in the “transcript only” set at the SG-A/pacSC transition (set 2_, 1017 genes) were still in the same set at the pacSC/rST transition (set _3, 1106 genes). This indicated that these genes used the “transcript only” mechanism in gene regulation in both pacSC and rST. This is confirmed by the observation that changes in protein and mRNA levels of these genes (set 23) matched well with each other at the two transitions although all changes were small (supplemental Fig. S6C). Functional annotation analysis of these genes revealed that they were involved in “spliceosome,” “mRNA metabolic process,” “ncRNA metabolic process,” “RNA transport” “translation,” and “protein transport.” We also compared proteins in Clusters 0∼4 with different sets of genes using different regulatory mechanisms (supplemental Table S7). We found that majority of the proteins in Clusters 0, 1, 2 and 3 were in set 2_ and set 23, meaning that the genes of these proteins used the “transcript only” mechanisms at both SG-A/pacSC and pacSC/rST transitions. Therefore, during mouse spermatogenesis, genes mainly depend on transcription followed by quick translation response to regulate their expression.
The 431 genes in the “transcript degradation” set at SG-A/pacSC transition partitioned into the “transcript only” set (set 13, 220 genes) and the “protein degradation” set (set 15, 155 genes) at the pacSC/rST transition, respectively. These genes were transcribed and translated in SG-A and then the mRNAs were rapidly degraded whereas the proteins were stably present in pacSC (supplemental Figs. S6A, 6B). When the cells differentiated into rST, some proteins started to degrade to catch up with the degradation rate of mRNAs (the “transcript only” set) whereas others might degrade at an even faster rate relative to the rate of mRNA degradation (the “protein degradation” set). Functional annotation analysis on the 431 genes revealed that these genes were involved in “mitochondrial matrix,” “protein transport,” “protein complex biogenesis,” “glucose metabolic process,” and “coenzyme metabolic process,” indicating they were mostly house-keeping genes. The percentages of proteins in Clusters 0∼5 using the “transcript degradation” mechanism at the SG-A/pacSC were 14.7%, 36.4%, 31.5%, 16.1%, and 4.7%, indicating that about one-third of proteins highly present in SG-A and pacSC (Cluster 1 and 2) started to reduce their mRNA levels in pacSC while sustaining their protein levels until they were also reduced in rST; in contrast, only a small portion of genes whose protein levels were relatively constant during spermatogenesis (Cluster 0) or elevated during/after meiosis (Clusters 3 and 4) behaved similarly (supplemental Table S7).
Of the 336 genes in the “translation repression” set at SG-A/pacSC transition, 120 went into the “translation de-repression” set (set 32) and 150 went into the “transcript only” set (set 33) at the pacSC/rST transition. These genes were initially transcribed but translationally repressed in pacSC (supplemental Figs, S5D, S5E). Then, some genes entered into translation in rST (the “translation de-repression” set) whereas others stayed translationally repressed (the “transcript only” set). Functional annotation analysis of the 336 genes showed that they were involved in “sexual reproduction,” “flagellum,” “spermatogenesis,” “glycolysis,” and “monosaccharide metabolic process.” Consistently, while only a very small fraction of proteins in Clusters 0∼3 belonged to the “translation repression” set at SG-A/pacSC, more than half in Cluster 4 (139/253) were translationally repressed in pacSC, the majority of which (83/139) were then derepressed in rST. As an example, the zona pellucid binding protein (ZPBP) increased its mRNA level by 10.8-fold and its protein level only by 1.1-fold in pacSC compared with that in SG-A, indicating translation repression. However, the increases in mRNA and protein were 1.7- and 7.2-fold in rST compared with in pacSC, a clear derepression of translation. This typical translation repression/derepression post-transcriptional regulation demonstrated how postmeiotic germ cells had adopted an efficient strategy to deal with the production of proteins needed when transcription is silenced because of the unique structure of chromatin.
Post-transcriptional Regulation is Related to piRNA Biogenesis from mRNAs
We previously reported that about one-third of mRNAs were potential piRNA precursors and named them piRNA-generating mRNAs (PRMRs) (14). We now find that 80% of the genes in the “transcript only” set and 77% in the “transcript degradation” set at the SG-A/pacSC transition produced PRMRs, and the percentages were significantly higher than expected. In contrast, only 42% of the genes in the “translation repression” group produced PRMRs. This was consistent with the observations that the “transcript only” and the “transcript degradation” genes at the SG-A/pacSC transition were mostly housekeeping genes whereas PRMR genes were also evolutionarily conserved housekeeping genes that were mainly transcribed before meiosis (14). By contrast, the “translation repression” genes were less likely to be PRMRs because they were transcribed during meiosis and translated post-meiotically, and piRNAs at this stage were mostly intergenic (14). Three hundred and thirty-three PRMRs of the 431 genes in the “transcript degradation” set (77%) at the SG-A/pacSC transition could each produce 70 piRNA reads on average in SG-A, and the piRNA levels decreased by about 5.5-fold in pacSC and rST. Consistently, piRNAs from these PRMRs co-immunoprecipitated with MILI from 10 dpp mouse testes containing premeiotic germ cells were at significantly higher levels (averagely 22.2 reads per million per gene) than those co-immunoprecipitated with MILI or MIWI from adult mouse testis containing all types of germ cells (3.46 reads per million per gene) (Fig. 3A) (53, 54). These 333 PRMRs produced no piRNAs in nontesticular tissues such as skin, muscle, and saliva glands suggesting that the piRNAs detected in the germ cells were not random degradation fragments of mRNAs (Fig. 3A). Indeed, this group of piRNAs, as all piRNAs in general, were 5′U-biased (72%), mostly derived from coding sequence (CDS) regions (Fig. 3B), and were of 26–27 nucleotides in average (Fig. 3C). The simultaneous decreases in mRNA and piRNA levels of these PRMRs implied that either piRNAs were just metabolic products of PRMRs or they might help to maintain the level of the latter. We selected Sod1 (superoxide dismutase 1) and Fth1 (ferritin heavy chain 1), two typical members of PRMRs, to check their levels of mRNAs, piRNAs and proteins by quantitative RT-PCR (Fig. 3D) and Western blot (Fig. 3E). It turned out that their mRNA and piRNA levels both decreased significantly whereas their protein levels stayed relatively constant when SG-A differentiated to pacSC, consistent with the omics data. SOD1 protects spermatogenic cells from reactive oxygen species damage (55), and FTH1 is a major intracellular iron storage protein in prokaryotes and eukaryotes with multiple pseudogenes, highly expressed in germline and hematopoietic stem cells (56). The housekeeping nature of these two proteins was supported by their sustained levels from SG-A to pacSC.
Fig. 3.

Association of piRNA biogenesis with post-transcriptional regulation during mouse spermatogenesis. A, Expression of piRNAs from the 333 PRMRs of the “transcript degradation” genes in different cell and tissue types or co-immunoprecipitated with MILI or MIWI from the mouse testes of different developmental stages. The abundances of piRNAs were normalized to reads per million. Data for SG-A, pacSC, and rST were from our previous study (14), the dpp 10 MILI-IP data were from a study by Aravin et al. (53), the adult MILI-IP and adult MIWI-IP data were from the study by Robine et al. (54), and data for skin, muscle, and salivary glands data were from the study by Kuchen et al. (75). B, The distribution of piRNAs from the 333 PRMRs in 5′UTR, CDS, and 3′UTR. C, Size distribution of piRNAs from the 333 PRMRs directly isolated from SG-A and co-immunoprecipitated with MILI from 10 dpp mouse testis (dpp 10 MILI-IP). D, Validation of the abundances of mRNAs and two piRNAs of Fth1 and Sod1 using real time PCR analysis. The means and standard errors were calculated from three independent experiments. (*) denotes significant differences with p < 0.01 based the t test. E, Validation of the protein expression of FTH1 and SOD1 by Western blot analysis.
It is estimated that 13% of genes have at least one pseudogene according to the pseudogene database (http://www.pseudogene.org/mouse/, builds 60). Interestingly, we found that 166 of the 333 PRMRs (44%) have at least one pseudogene. As an example, Fth1 has 6 pseudogenes. This number was significantly higher than expected (Fisher's exact test, p = 2 × 10−59). It has been reported that genes giving rise to processed pseudogenes tend to be housekeeping genes that are highly expressed in the germ line (57). Therefore, the enrichment of processed pseudogenes in this particular set of PRMRs from the “transcript degradation” set (set 1_) supported their housekeeping functions and their high expression in SG-A as described above and in our previous study (14).
Post-transcriptional Regulation by Antisense Transcripts during Spermatogenesis
It has been known that antisense transcripts regulate gene expression at post-transcriptional levels. Based on the LongSAGE data (39), we found that the genes in the “translation repression” set at SG-A/pacSC transition and the genes in the “translation de-repression” set at pacSC/rST transition were significantly enriched with antisense transcripts. In addition, the 120 genes (set 32) of the intersection of these two sets had at least one antisense SAGE tag from the testis, representing an enrichment more significant than expected (p = 1.4 × 10−53). Compared with other tissues, the testis had the highest level expression of the antisense transcripts of these 120 genes based on the LongSAGE data (Fig. 4A). As explained above, these genes were transcribed but translationally repressed in pacSC and then actively translated in rST. Therefore, antisense transcripts were likely involved in the post-transcriptional regulation of these genes. More specifically, they might form double-strand duplex with the sense mRNAs to block the translation of the later (18).
Fig. 4.
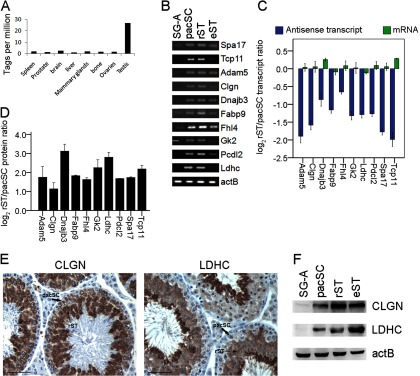
Association of antisense transcripts with the genes using “translation repression/de-repression” mechanisms of post-transcriptional regulation during mouse spermatogenesis. A, The abundance of antisense transcripts in various mouse tissues evaluated by the number of the SAGE tags according to GEO dataset GSE4726. The abundances are normalized to tags per million. B, Strand-specific RT-PCR was used to detect the expression of antisense transcripts of ten genes in four types of germ cells. C, A comparison of relative expression levels of mRNAs and antisense transcripts determined by real time PCR. D, The relative levels of ten proteins in rST compared with pacSC determined by the iTRAQ analysis. E, F, Validation of expression of LDHC and CLGN proteins using immunohistochemistry (E) and Western blot (F). Note the increases in the staining intensities of both proteins from pacSC to rST. Scale bars are all 50 μm.
We used strand-specific RT-PCR to detect the expression of antisense transcripts of 10 selected genes in four types of germ cells, and found that the antisense transcripts were highly expressed in pacSC and rST (Fig. 4B). We then used real-time RT-PCR to analyze the expression of mRNAs and antisense transcripts in a more accurate way. From pacSC to rST, the mRNA levels of these genes remain unchanged. However, the expression of antisense transcripts was significantly down-regulated (Fig. 4C). The protein levels of these 10 selected genes were up-regulated according the iTRAQ quantitative data (Fig. 4D). The protein levels of two genes, lactate hehydrogenase c (Ldhc) and calmegin (Clgn) that are essential for sperm energy production and movement (58, 59), were confirmed by immunohistochemistry and Western blots (Fig. 4E, 4F). Functional annotation analysis indicated that these 120 genes played important roles in the process of spermatogenesis. These genes were highly or specially expressed in the testis. Of these 120 genes, 52 (43%) proteins were present in mature spermatozoa based on comparison with the mouse sperm proteome data (26, 45), suggesting that these proteins could be important for sperm-related activities.
DISCUSSION
In the present study, we used iTRAQ-based quantitative proteomic approach to profile the proteins in four mouse male germ cell types, which represents the key stages of mammalian spermatogenesis. We compared the expression of proteins with their mRNA levels and identified several potential gene regulation mechanisms. We found that post-transcriptional regulation might be related to the generation of piRNAs and to antisense transcripts. Although several proteomic studies had been published before our work, they failed to uncover the relationship between the levels of proteins and mRNAs because of either the low numbers of protein identified (25, 30, 60), the nonquantitative nature of the techniques (25, 60), or the lack of data for more germ cell types (25, 27, 29, 45, 61, 62). Taking advantage of the iTRAQ-based protein mass spectrometry, which is both high throughput and quantitative, as well as published transcriptomic data of mRNAs, piRNAs, and antisense transcripts, we were able to, for the first time, conduct in-depth analysis on the relationships among these important players in gene expression and to reveal several mechanisms of gene regulation during mammalian spermatogenesis. It should be pointed out that our iTRAQ-based proteomic analysis was not sensitive enough to identify all proteins involved in spermatogenesis. However, bias in the discovered mechanisms was not a major concern because of the large number of proteins identified. In line with this and as illustrated in the results, example genes whose expression patterns have been previously known were correctly assigned with corresponding regulatory mechanisms based on our analysis.
Most proteins showing dynamic changes during spermatogenesis are highly expressed in SG-A and pacSC. Rolland et al. also found that more proteins were expressed at a relatively higher level in spermatogonia than in spermatocytes or spermatids (30). One prominent feature of the proteins expressed at higher levels in SG-A and pacSC are that they are related to energy metabolism, consistent with what was reported previously (25, 30). We further detected a large number of proteins involved in RNA splicing, transport, and processing, which confirms previous findings of isolated examples of protein related to RNA activities such as hnRNPs (63), PTBP2 (30), and Hnrpa2b1 (27). For example, 58 proteins related to RNA splicing were found to be highly expressed in SG-A and pacSC. The successful detection of such a large number of proteins related to RNA activities, which were missed by previous studies, may be attributed to the highly sensitive iTRAQ-based mass spectrometry. A smaller cluster of 155 proteins highly expressed in pacSC and rST are enriched with FATs such as “chromatoid body,” “helicase activity,” “piRNA metabolic process,” “DNA repair,” and “spermatogenesis.” The chromatoid body in spermatocytes and spermatids is where RNA storage and processing occurs (64). As examples, MILI, MIWI, TDRD1, and TDRD7, which are involved in piRNA production and which are components of chromatoid body (65), were detected in our study. RNA helicases are involved in many aspects of RNA processing. DNA recombination, the best-known process in spermatocytes, includes DNA double-stand break and repair. Proteins belonging to this category include MDC1 (mediator of DNA damage checkpoint 1), CUL4A (cullin 4A), and XRCC4 (x-ray repair complementing defective repair in Chinese hamster cells 4), all of which are important players in DNA damage response (66–68). The regulation of most of these 155 protein genes used the “transcript only” mechanism at both transitions, with both mRNAs and proteins being increased at the SG-A/pacSC transition while being decreased at the pacSC/rST transition. Proteins highly expressed in haploid cells were either specialized in sperm activities or involved in energy metabolism. This observation is consistent with previous proteomic studies, most of which detected proteins specific to haploid germ cells (27, 29, 30, 61). Proteins involved in energy metabolism were also detected in both mouse and rat sperm (61, 62). It seems that haploid cells use energy to accomplish germ cell specific tasks such as developing acrosomes and flagella, preparing for fertilization, combating the damages of reactive oxygen species, and sensing external signals, to name a few (supplemental Tables S4 and S5). As examples, ZP3R (69), ZPBP (70), and SMCP (71), and GAPDHS (72) which are involved in sperm-egg interactions, were all detected to be highly expressed in haploid cells.
Translation repression has long been known to be important in haploid germ cell development and has been indicated by certain proteomic studies (29). However, questions such as how genes are regulated by this mechanism, whether it is also functioning in earlier cell types, and whether other mechanisms also exist have not be well addressed. The quantitative protein expression data generated in the present study together with multiple transcriptomic data sets available in public databases enable us to answer these questions in a systematic way. By comparing the protein level changes with their mRNA level changes at the mitosis/meiosis transition and the meiosis/post-meiotic development transition (represented by SG-A/pacSC and pacSC/rST transitions), we identified five major mechanisms for gene regulation during mouse spermatogenesis. The “transcript only” mechanism is used by genes whose protein level changes in respond to their mRNA level changes promptly or whose protein and mRNA levels both stay relatively constant. These genes are mainly involved in house-keeping activities such as “mRNA metabolic processes,” “spliceosome,” “mitochondrion,” “translation,” and “protein transport.” Most of these genes (736/1017) use the same mechanism at the two transitions. Examples in this set include DEAD box polypeptides, heterogeneous nuclear ribonucleoproteins, splicing factors, ATP synthases, NADH dehydrogenases, translation initiation factors, proteasome subunits, to name a few. At the SG-A/pacSC transition, the “transcript degradation” mechanism is used by genes whose mRNA levels drop while their protein levels stay relatively constant until marked “protein degradation” ensues at the pacSC/rST transition; the “translation repression” is used by genes whose mRNAs are synthesized but their protein translation is repressed until later stages when the “translation de-repression” mechanism is taken. The “transcript degradation” genes are also involved in house-keeping activities such as “metabolic process,” “mitochondrial matrix,” “protein transport,” “protein complex.” Interestingly, these proteins start to reduce their levels when pacSC turns into rST, reflecting the change in germ cell development from mitotic division to post-meiotic development when some housekeeping activities are reduced to enhance germ cell specific ones. The “translation repression” genes are involved in either housekeeping activities related to “glycolysis” or “mitochondrion” or germ cell specific activities related to “flagellum,” “spermatid development,” or “sexual reproduction.” These genes de-repress their protein translation when pacSC changes into rST. For example, lactate dehydrogenase C (LDHC), a germ cell-specific lactate dehydrogenase essential for spermatogenesis, has been reported to be transcribed and translated in spermatocytes, but its protein level is significantly increases in haploid germ cells (73). These observations were confirmed by results in our present study.
Studies in post-transcriptional regulation of spermatogenesis progressed rapidly in recent years as a large numbers of nonprotein-coding transcripts either specifically or highly expressed in germ cells have been identified. We previously reported that about one-third of mRNAs were piRNA precursors and that they were enriched with antisense transcripts and splicing isoforms (14). In the present study, we re-inspected the relationships between these RNA species in light of corresponding protein dynamics. Genes regulated by the “transcript only” and “transcript degradation” mechanisms transcribe PRMRs in much higher proportions (77 and 80%) than expected whereas those regulated by the “translation repression” mechanism generated PRMRs in a proportion slightly higher (42%) than expected. The first two sets showed a strong relation to housekeeping activities whereas a significant portion of the last set were germ cell-specific, suggesting that the regulation of genes with housekeeping activities is related to piRNA production while regulation of germ cell-specific ones is related to antisense transcripts. Although it is simpler to propose that piRNAs are just by-products of mRNA metabolism, we cannot rule out the possibility that piRNAs help to maintain the high protein levels in the mitotically active spermatogonia. Indeed, ablation of MILI, which associates with piRNAs, does not change the mRNA levels but reduced the protein level globally (74). The “translation repression/de-repression” genes were significantly enriched with antisense transcripts whereas the other gene sets were not. It is likely that antisense transcripts play an essential role in translation repression in haploid cells just by blocking the translation of proteins. Alternatively, these antisense transcripts may induce the endogenous siRNA pathway that results in the degradation of mRNAs in late spermatid development. To discriminate these two possibilities, it is important to correlate the changes in sense and antisense transcripts with a higher resolution along the development path of the haploid cells. Considering mRNAs, piRNAs, antisense transcripts, and proteins altogether, it is tempting to hypothesize that PRMRs sacrificed some mRNA molecules to generate piRNAs which bind to antisense transcripts and antagonize their translation repression effect.
In conclusion, we have presented a large-scale quantitative proteomic study on mouse spermatogenesis. We identified a large number of proteins whose levels were either constant or were dynamically changing during germ cell development. We also uncovered five gene regulation mechanisms used by germ cells and the characteristics of the target genes. In addition, we disclosed the putative involvement of piRNAs and antisense transcripts in the post-transcriptional regulation of genes. These results should provide a rich resource for the study of spermatogenesis and improve our understandings of the molecular mechanisms of gene regulation in mammalian spermatogenesis.
Supplementary Material
Acknowledgments
We thank Dr. Minhua Deng and Dr. Naifang Su of the School of Mathematical Sciences, Peking University for their kind help on the statistic analysis of the data.
Footnotes
* This research was supported by the National Basic Research Program of China (973) (2012CB966702, 2010CB833703, 2012CB966803) and the National Natural Science Foundation of China (90919047, 31271379).
 This article contains supplemental Figs. S1 to S6 and Tables S1 to S7.
1 The abbreviations used are:
- rST
- round spermatids
- SG-A
- type A spermatogonia
- pacSC
- pachytene spermatocytes
- eST
- elongative spermatids
- piRNA
- Piwi-interacting RNA
- GO
- gene ontology
- dpp
- day postpartum
- IP
- Immunoprecipitation
- SAGE
- Serial analysis of gene expression
- iTRAQ
- isobaric tag for relative and absolute quantitation
- FDR
- False discovery rate.
REFERENCES
- 1. Lee T. L., Pang A. L., Rennert O. M., Chan W. Y. (2009) Genomic landscape of developing male germ cells. Birth Defects Res. C Embryo Today 87, 43–63 [DOI] [PMC free article] [PubMed] [Google Scholar]
- 2. Braun R. E. (1998) Post-transcriptional control of gene expression during spermatogenesis. Semin. Cell Dev. Biol. 9, 483–489 [DOI] [PubMed] [Google Scholar]
- 3. Steger K. (1999) Transcriptional and translational regulation of gene expression in haploid spermatids. Anat. Embryol. 199, 471–487 [DOI] [PubMed] [Google Scholar]
- 4. Eddy E. M. (2002) Male germ cell gene expression. Recent Prog. Horm. Res. 57, 103–128 [DOI] [PubMed] [Google Scholar]
- 5. Lee K., Haugen H. S., Clegg C. H., Braun R. E. (1995) Premature translation of protamine 1 mRNA causes precocious nuclear condensation and arrests spermatid differentiation in mice. Proc. Natl. Acad. Sci. U.S.A. 92, 12451–12455 [DOI] [PMC free article] [PubMed] [Google Scholar]
- 6. Kleene K. C. (1993) Multiple controls over the efficiency of translation of the mRNAs encoding transition proteins, protamines, and the mitochondrial capsule selenoprotein in late spermatids in mice. Dev. Biol. 159, 720–731 [DOI] [PubMed] [Google Scholar]
- 7. Kleene K. C., Distel R. J., Hecht N. B. (1984) Translational regulation and deadenylation of a protamine mRNA during spermiogenesis in the mouse. Dev. Biol. 105, 71–79 [DOI] [PubMed] [Google Scholar]
- 8. Idler R. K., Yan W. (2012) Control of messenger RNA fate by RNA-binding proteins: an emphasis on mammalian spermatogenesis. J. Androl. 33, 309–337 [DOI] [PMC free article] [PubMed] [Google Scholar]
- 9. Kimura M., Ishida K., Kashiwabara S., Baba T. (2009) Characterization of two cytoplasmic poly(A)-binding proteins, PABPC1 and PABPC2, in mouse spermatogenic cells. Biol. Reprod. 80, 545–554 [DOI] [PubMed] [Google Scholar]
- 10. Engels B. M., Hutvagner G. (2006) Principles and effects of microRNA-mediated post-transcriptional gene regulation. Oncogene 25, 6163–6169 [DOI] [PubMed] [Google Scholar]
- 11. Hayashi K., Chuva de Sousa Lopes S. M., Kaneda M., Tang F., Hajkova P., Lao K., O'Carroll D., Das P. P., Tarakhovsky A., Miska E. A., Surani M. A. (2008) MicroRNA biogenesis is required for mouse primordial germ cell development and spermatogenesis. PloS one 3, e1738. [DOI] [PMC free article] [PubMed] [Google Scholar]
- 12. Maatouk D. M., Loveland K. L., McManus M. T., Moore K., Harfe B. D. (2008) Dicer1 is required for differentiation of the mouse male germline. Biol. Reprod. 79, 696–703 [DOI] [PubMed] [Google Scholar]
- 13. Castañeda J., Genzor P., Bortvin A. (2011) piRNAs, transposon silencing, and germline genome integrity. Mutat. Res. 714, 95–104 [DOI] [PubMed] [Google Scholar]
- 14. Gan H., Lin X., Zhang Z., Zhang W., Liao S., Wang L., Han C. (2011) piRNA profiling during specific stages of mouse spermatogenesis. RNA 17, 1191–1203 [DOI] [PMC free article] [PubMed] [Google Scholar]
- 15. Thomson T., Lin H. (2009) The biogenesis and function of PIWI proteins and piRNAs: progress and prospect. Annu. Rev. Cell Dev. Biol. 25, 355–376 [DOI] [PMC free article] [PubMed] [Google Scholar]
- 16. Grivna S. T., Pyhtila B., Lin H. (2006) MIWI associates with translational machinery and PIWI-interacting RNAs (piRNAs) in regulating spermatogenesis. Proc. Natl. Acad. Sci. U.S.A. 103, 13415–13420 [DOI] [PMC free article] [PubMed] [Google Scholar]
- 17. Grivna S. T., Beyret E., Wang Z., Lin H. (2006) A novel class of small RNAs in mouse spermatogenic cells. Genes Dev. 20, 1709–1714 [DOI] [PMC free article] [PubMed] [Google Scholar]
- 18. Faghihi M. A., Wahlestedt C. (2009) Regulatory roles of natural antisense transcripts. Nature Rev. 10, 637–643 [DOI] [PMC free article] [PubMed] [Google Scholar]
- 19. Watanabe T., Totoki Y., Toyoda A., Kaneda M., Kuramochi-Miyagawa S., Obata Y., Chiba H., Kohara Y., Kono T., Nakano T., Surani M. A., Sakaki Y., Sasaki H. (2008) Endogenous siRNAs from naturally formed dsRNAs regulate transcripts in mouse oocytes. Nature 453, 539–543 [DOI] [PubMed] [Google Scholar]
- 20. Werner A., Swan D. (2010) What are natural antisense transcripts good for? Biochem. Soc. Trans. 38, 1144–1149 [DOI] [PMC free article] [PubMed] [Google Scholar]
- 21. Hatzoglou A., Deshayes F., Madry C., Laprée G., Castanas E., Tsapis A. (2002) Natural antisense RNA inhibits the expression of BCMA, a tumour necrosis factor receptor homologue. BMC Mol. Biol. 3, 4. [DOI] [PMC free article] [PubMed] [Google Scholar]
- 22. Ebralidze A. K., Guibal F. C., Steidl U., Zhang P., Lee S., Bartholdy B., Jorda M. A., Petkova V., Rosenbauer F., Huang G., Dayaram T., Klupp J., O'Brien K. B., Will B., Hoogenkamp M., Borden K. L., Bonifer C., Tenen D. G. (2008) PU. 1 expression is modulated by the balance of functional sense and antisense RNAs regulated by a shared cis-regulatory element. Genes Dev. 22, 2085–2092 [DOI] [PMC free article] [PubMed] [Google Scholar]
- 23. Okada Y., Tashiro C., Numata K., Watanabe K., Nakaoka H., Yamamoto N., Okubo K., Ikeda R., Saito R., Kanai A., Abe K., Tomita M., Kiyosawa H. (2008) Comparative expression analysis uncovers novel features of endogenous antisense transcription. Hum. Mol. Genet. 17, 1631–1640 [DOI] [PubMed] [Google Scholar]
- 24. Carlile M., Swan D., Jackson K., Preston-Fayers K., Ballester B., Flicek P., Werner A. (2009) Strand selective generation of endo-siRNAs from the Na/phosphate transporter gene Slc34a1 in murine tissues. Nucleic Acids Res. 37, 2274–2282 [DOI] [PMC free article] [PubMed] [Google Scholar]
- 25. Com E., Evrard B., Roepstorff P., Aubry F., Pineau C. (2003) New insights into the rat spermatogonial proteome: identification of 156 additional proteins. Mol. Cell. Proteomics 2, 248–261 [DOI] [PubMed] [Google Scholar]
- 26. Dorus S., Wasbrough E. R., Busby J., Wilkin E. C., Karr T. L. (2010) Sperm proteomics reveals intensified selection on mouse sperm membrane and acrosome genes. Mol. Biol. Evol. 27, 1235–1246 [DOI] [PMC free article] [PubMed] [Google Scholar]
- 27. Huang X. Y., Guo X. J., Shen J., Wang Y. F., Chen L., Xie J., Wang N. L., Wang F. Q., Zhao C., Huo R., Lin M., Wang X., Zhou Z. M., Sha J. H. (2008) Construction of a proteome profile and functional analysis of the proteins involved in the initiation of mouse spermatogenesis. J. Proteome Res. 7, 3435–3446 [DOI] [PubMed] [Google Scholar]
- 28. Guo X., Zhang P., Qi Y., Chen W., Chen X., Zhou Z., Sha J. (2011) Proteomic analysis of male 4C germ cell proteins involved in mouse meiosis. Proteomics 11, 298–308 [DOI] [PubMed] [Google Scholar]
- 29. Guo X., Shen J., Xia Z., Zhang R., Zhang P., Zhao C., Xing J., Chen L., Chen W., Lin M., Huo R., Su B., Zhou Z., Sha J. (2010) Proteomic analysis of proteins involved in spermiogenesis in mouse. J. Proteome Res. 9, 1246–1256 [DOI] [PubMed] [Google Scholar]
- 30. Rolland A. D., Evrard B., Guitton N., Lavigne R., Calvel P., Couvet M., Jégou B., Pineau C. (2007) Two-dimensional fluorescence difference gel electrophoresis analysis of spermatogenesis in the rat. J. Proteome Res. 6, 683–697 [DOI] [PubMed] [Google Scholar]
- 31. Bellvé A. R., Cavicchia J. C., Millette C. F., O'Brien D. A., Bhatnagar Y. M., Dym M. (1977) Spermatogenic cells of the prepuberal mouse. Isolation and morphological characterization. J. Cell Biol. 74, 68–85 [DOI] [PMC free article] [PubMed] [Google Scholar]
- 32. Bradford M. M. (1976) A rapid and sensitive method for the quantitation of microgram quantities of protein utilizing the principle of protein-dye binding. Anal. Biochem. 72, 248–254 [DOI] [PubMed] [Google Scholar]
- 33. Köcher T., Pichler P., Schutzbier M., Stingl C., Kaul A., Teucher N., Hasenfuss G., Penninger J. M., Mechtler K. (2009) High precision quantitative proteomics using iTRAQ on an LTQ Orbitrap: a new mass spectrometric method combining the benefits of all. J. Proteome Res. 8, 4743–4752 [DOI] [PubMed] [Google Scholar]
- 34. Elias J. E., Gygi S. P. (2007) Target-decoy search strategy for increased confidence in large-scale protein identifications by mass spectrometry. Nat. Methods 4, 207–214 [DOI] [PubMed] [Google Scholar]
- 35. Ho E. C., Donaldson M. E., Saville B. J. (2010) Detection of antisense RNA transcripts by strand-specific RT-PCR. Methods Mol. Biol. 630, 125–138 [DOI] [PubMed] [Google Scholar]
- 36. Namekawa S. H., Park P. J., Zhang L. F., Shima J. E., McCarrey J. R., Griswold M. D., Lee J. T. (2006) Postmeiotic sex chromatin in the male germline of mice. Curr. Biol. 16, 660–667 [DOI] [PubMed] [Google Scholar]
- 37. Chalmel F., Rolland A. D., Niederhauser-Wiederkehr C., Chung S. S., Demougin P., Gattiker A., Moore J., Patard J. J., Wolgemuth D. J., Jégou B., Primig M. (2007) The conserved transcriptome in human and rodent male gametogenesis. Proc. Natl. Acad. Sci. U.S.A. 104, 8346–8351 [DOI] [PMC free article] [PubMed] [Google Scholar]
- 38. Saldanha A. J. (2004) Java Treeview–extensible visualization of microarray data. Bioinformatics 20, 3246–3248 [DOI] [PubMed] [Google Scholar]
- 39. Siddiqui A. S., Khattra J., Delaney A. D., Zhao Y., Astell C., Asano J., Babakaiff R., Barber S., Beland J., Bohacec S., Brown-John M., Chand S., Charest D., Charters A. M., Cullum R., Dhalla N., Featherstone R., Gerhard D. S., Hoffman B., Holt R. A., Hou J., Kuo B. Y., Lee L. L., Lee S., Leung D., Ma K., Matsuo C., Mayo M., McDonald H., Prabhu A. L., Pandoh P., Riggins G. J., de Algara T. R., Rupert J. L., Smailus D., Stott J., Tsai M., Varhol R., Vrljicak P., Wong D., Wu M. K., Xie Y. Y., Yang G., Zhang I., Hirst M., Jones S. J., Helgason C. D., Simpson E. M., Hoodless P. A., Marra M. A. (2005) A mouse atlas of gene expression: large-scale digital gene-expression profiles from precisely defined developing C57BL/6J mouse tissues and cells. Proc. Natl. Acad. Sci. U.S.A. 102, 18485–18490 [DOI] [PMC free article] [PubMed] [Google Scholar]
- 40. Ge X., Wu Q., Jung Y. C., Chen J., Wang S. M. (2006) A large quantity of novel human antisense transcripts detected by LongSAGE. Bioinformatics 22, 2475–2479 [DOI] [PubMed] [Google Scholar]
- 41. Huang da W., Sherman B. T., Lempicki R. A. (2009) Systematic and integrative analysis of large gene lists using DAVID bioinformatics resources. Nat. Protoc. 4, 44–57 [DOI] [PubMed] [Google Scholar]
- 42. Dennis G., Jr., Sherman B. T., Hosack D. A., Yang J., Gao W., Lane H. C., Lempicki R. A. (2003) DAVID: Database for Annotation, Visualization, and Integrated Discovery. Genome Biol. 4, P3. [PubMed] [Google Scholar]
- 43. McIver S. C., Roman S. D., Nixon B., McLaughlin E. A. (2012) miRNA and mammalian male germ cells. Hum. Reprod. Update 18, 44–59 [DOI] [PubMed] [Google Scholar]
- 44. Costa Y., Cooke H. J. (2007) Dissecting the mammalian synaptonemal complex using targeted mutations. Chromosome Res. 15, 579–589 [DOI] [PubMed] [Google Scholar]
- 45. Baker M. A., Hetherington L., Reeves G. M., Aitken R. J. (2008) The mouse sperm proteome characterized via IPG strip prefractionation and LC-MS/MS identification. Proteomics 8, 1720–1730 [DOI] [PubMed] [Google Scholar]
- 46. Danshina P. V., Geyer C. B., Dai Q., Goulding E. H., Willis W. D., Kitto G. B., McCarrey J. R., Eddy E. M., O'Brien D. A. (2010) Phosphoglycerate kinase 2 (PGK2) is essential for sperm function and male fertility in mice. Biol. Reprod. 82, 136–145 [DOI] [PMC free article] [PubMed] [Google Scholar]
- 47. Wang R., Sperry A. O. (2011) PP1 forms an active complex with TLRR (lrrc67), a putative PP1 regulatory subunit, during the early stages of spermiogenesis in mice. PloS one 6, e21767. [DOI] [PMC free article] [PubMed] [Google Scholar]
- 48. Xu B., Hao Z., Jha K. N., Zhang Z., Urekar C., Digilio L., Pulido S., Strauss J. F., 3rd, Flickinger C. J., Herr J. C. (2008) Targeted deletion of Tssk1 and 2 causes male infertility due to haploinsufficiency. Dev. Biol. 319, 211–222 [DOI] [PMC free article] [PubMed] [Google Scholar]
- 49. Irmler M., Hartl D., Schmidt T., Schuchhardt J., Lach C., Meyer H. E., Hrab é de Angelis M., Klose J., Beckers J. (2008) An approach to handling and interpretation of ambiguous data in transcriptome and proteome comparisons. Proteomics 8, 1165–1169 [DOI] [PubMed] [Google Scholar]
- 50. O'Brien R. N., Shen Z., Tachikawa K., Lee P. A., Briggs S. P. (2010) Quantitative proteome analysis of pluripotent cells by iTRAQ mass tagging reveals post-transcriptional regulation of proteins required for ES cell self-renewal. Mol. Cell. Proteomics 9, 2238–2251 [DOI] [PMC free article] [PubMed] [Google Scholar]
- 51. de Godoy L. M., Olsen J. V., Cox J., Nielsen M. L., Hubner N. C., Fröhlich F., Walther T. C., Mann M. (2008) Comprehensive mass-spectrometry-based proteome quantification of haploid versus diploid yeast. Nature 455, 1251–1254 [DOI] [PubMed] [Google Scholar]
- 52. Gouw J. W., Pinkse M. W., Vos H. R., Moshkin Y., Verrijzer C. P., Heck A. J., Krijgsveld J. (2009) In vivo stable isotope labeling of fruit flies reveals post-transcriptional regulation in the maternal-to-zygotic transition. Mol. Cell. Proteomics 8, 1566–1578 [DOI] [PMC free article] [PubMed] [Google Scholar]
- 53. Aravin A. A., Sachidanandam R., Bourc'his D., Schaefer C., Pezic D., Toth K. F., Bestor T., Hannon G. J. (2008) A piRNA pathway primed by individual transposons is linked to de novo DNA methylation in mice. Mol. Cell 31, 785–799 [DOI] [PMC free article] [PubMed] [Google Scholar]
- 54. Robine N., Lau N. C., Balla S., Jin Z., Okamura K., Kuramochi-Miyagawa S., Blower M. D., Lai E. C. (2009) A broadly conserved pathway generates 3′UTR-directed primary piRNAs. Curr. Biol. 19, 2066–2076 [DOI] [PMC free article] [PubMed] [Google Scholar]
- 55. Ishii T., Matsuki S., Iuchi Y., Okada F., Toyosaki S., Tomita Y., Ikeda Y., Fujii J. (2005) Accelerated impairment of spermatogenic cells in SOD1-knockout mice under heat stress. Free Radic. Res. 39, 697–705 [DOI] [PubMed] [Google Scholar]
- 56. Mizukami T., Kuramitsu M., Takizawa K., Momose H., Masumi A., Naito S., Iwama A., Ogawa T., Noce T., Hamaguchi I., Yamaguchi K. (2008) Identification of transcripts commonly expressed in both hematopoietic and germ-line stem cells. Stem Cells Dev. 17, 67–80 [DOI] [PubMed] [Google Scholar]
- 57. Zhang Z., Carriero N., Gerstein M. (2004) Comparative analysis of processed pseudogenes in the mouse and human genomes. Trends Genet. 20, 62–67 [DOI] [PubMed] [Google Scholar]
- 58. Goldberg E., Eddy E. M., Duan C., Odet F. (2010) LDHC: the ultimate testis-specific gene. J. Androl. 31, 86–94 [DOI] [PMC free article] [PubMed] [Google Scholar]
- 59. Nakanishi T., Isotani A., Yamaguchi R., Ikawa M., Baba T., Suarez S. S., Okabe M. (2004) Selective passage through the uterotubal junction of sperm from a mixed population produced by chimeras of calmegin-knockout and wild-type male mice. Biol. Reprod. 71, 959–965 [DOI] [PubMed] [Google Scholar]
- 60. Guillaume E., Evrard B., Com E., Moertz E., Jégou B., Pineau C. (2001) Proteome analysis of rat spermatogonia: reinvestigation of stathmin spatio-temporal expression within the testis. Mol. Reprod. Dev. 60, 439–445 [DOI] [PubMed] [Google Scholar]
- 61. Martinez-Heredia J., Estanyol J. M., Ballescà J. L., Oliva R. (2006) Proteomic identification of human sperm proteins. Proteomics 6, 4356–4369 [DOI] [PubMed] [Google Scholar]
- 62. Baker M. A., Hetherington L., Reeves G., Müller J., Aitken R. J. (2008) The rat sperm proteome characterized via IPG strip prefractionation and LC-MS/MS identification. Proteomics 8, 2312–2321 [DOI] [PubMed] [Google Scholar]
- 63. Zhu Y. F., Cui Y. G., Guo X. J., Wang L., Bi Y., Hu Y. Q., Zhao X., Liu Q., Huo R., Lin M., Zhou Z. M., Sha J. H. (2006) Proteomic analysis of effect of hyperthermia on spermatogenesis in adult male mice. J. Proteome Res. 5, 2217–2225 [DOI] [PubMed] [Google Scholar]
- 64. Kotaja N., Sassone-Corsi P. (2007) The chromatoid body: a germ-cell-specific RNA-processing centre. Nat. Rev. Mol. Cell Biol. 8, 85–90 [DOI] [PubMed] [Google Scholar]
- 65. Meikar O., Da Ros M., Korhonen H., Kotaja N. (2011) Chromatoid body and small RNAs in male germ cells. Reproduction 142, 195–209 [DOI] [PubMed] [Google Scholar]
- 66. Jungmichel S., Clapperton J. A., Lloyd J., Hari F. J., Spycher C., Pavic L., Li J., Haire L. F., Bonalli M., Larsen D. H., Lukas C., Lukas J., MacMillan D., Nielsen M. L., Stucki M., Smerdon S. J. (2012) The molecular basis of ATM-dependent dimerization of the Mdc1 DNA damage checkpoint mediator. Nucleic Acids Res. 40, 3913–3928 [DOI] [PMC free article] [PubMed] [Google Scholar]
- 67. Liu L., Lee S., Zhang J., Peters S. B., Hannah J., Zhang Y., Yin Y., Koff A., Ma L., Zhou P. (2009) CUL4A abrogation augments DNA damage response and protection against skin carcinogenesis. Mol. Cell 34, 451–460 [DOI] [PMC free article] [PubMed] [Google Scholar]
- 68. Berg E., Christensen M. O., Dalla Rosa I., Wannagat E., Janicke R. U., Rosner L. M., Dirks W. G., Boege F., Mielke C. (2011) XRCC4 controls nuclear import and distribution of Ligase IV and exchanges faster at damaged DNA in complex with Ligase IV. DNA Repair 10, 1232–1242 [DOI] [PubMed] [Google Scholar]
- 69. Bookbinder L. H., Cheng A., Bleil J. D. (1995) Tissue- and species-specific expression of sp56, a mouse sperm fertilization protein. Science 269, 86–89 [DOI] [PubMed] [Google Scholar]
- 70. Lin Y. N., Roy A., Yan W., Burns K. H., Matzuk M. M. (2007) Loss of zona pellucida binding proteins in the acrosomal matrix disrupts acrosome biogenesis and sperm morphogenesis. Mol. Cell. Biol. 27, 6794–6805 [DOI] [PMC free article] [PubMed] [Google Scholar]
- 71. Nayernia K., Drabent B., Meinhardt A., Adham I. M., Schwandt I., Müller C., Sancken U., Kleene K. C., Engel W. (2005) Triple knockouts reveal gene interactions affecting fertility of male mice. Mol. Reprod. Dev. 70, 406–416 [DOI] [PubMed] [Google Scholar]
- 72. Miki K., Qu W., Goulding E. H., Willis W. D., Bunch D. O., Strader L. F., Perreault S. D., Eddy E. M., O'Brien D. A. (2004) Glyceraldehyde 3-phosphate dehydrogenase-S, a sperm-specific glycolytic enzyme, is required for sperm motility and male fertility. Proc. Natl. Acad. Sci. U.S.A. 101, 16501–16506 [DOI] [PMC free article] [PubMed] [Google Scholar]
- 73. Odet F., Duan C., Willis W. D., Goulding E. H., Kung A., Eddy E. M., Goldberg E. (2008) Expression of the gene for mouse lactate dehydrogenase C (Ldhc) is required for male fertility. Biol. Reprod. 79, 26–34 [DOI] [PMC free article] [PubMed] [Google Scholar]
- 74. Unhavaithaya Y., Hao Y., Beyret E., Yin H., Kuramochi-Miyagawa S., Nakano T., Lin H. (2009) MILI, a PIWI-interacting RNA-binding protein, is required for germ line stem cell self-renewal and appears to positively regulate translation. J. Biol. Chem. 284, 6507–6519 [DOI] [PMC free article] [PubMed] [Google Scholar]
- 75. Kuchen S., Resch W., Yamane A., Kuo N., Li Z., Chakraborty T., Wei L., Laurence A., Yasuda T., Peng S., Hu-Li J., Lu K., Dubois W., Kitamura Y., Charles N., Sun H. W., Muljo S., Schwartzberg P. L., Paul W. E., O'Shea J., Rajewsky K., Casellas R. (2010) Regulation of microRNA expression and abundance during lymphopoiesis. Immunity 32, 828–839 [DOI] [PMC free article] [PubMed] [Google Scholar]
Associated Data
This section collects any data citations, data availability statements, or supplementary materials included in this article.