

Abstract
In the last 25 years 13C MRS has been established as the only non invasive method for measuring glutamate neurotransmission and cell specific neuroenergetics. Although technically and experimentally challenging 13C MRS has already provided important new information on the relationship between neuroenergetics and neuronal function, energy cost of brain function, the high neuronal activity in the resting brain state, and how neuroenergetics and neurotransmitter cycling are altered in neurological and psychiatric disease. In this paper the current state of 13C MRS as it is applied to study neuroenergetics and neurotransmitter cycling in humans is reviewed. The focus is predominantly on recent findings in humans regarding metabolic pathways, applications to clinical research, and the technical status of the method. Results from in vivo 13C MRS studies in animals are discussed from the standpoint of validation of MRS measurements of neuroenergetics and neurotransmitter cycling and where they have helped identify key questions to address in human research. Controversies concerning the relation of neuroenergetics and neurotransmitter cycling and factors impacting accurate determination of fluxes through mathematical modeling are addressed. We further touch upon different 13C labeled substrates used to study brain metabolism, before reviewing a number of human brain diseases studied using 13C MRS. Future technological developments are discussed that will help to overcome limitations of 13C MRS with special attention on recent developments in hyperpolarized 13C MRS.
1. Introduction
In this paper we review the current state of 13C MRS as it is used to study neuroenergetics and neurotransmitter cycling in humans. We focus primarily on the present status of the measurement (pathways and spatial resolution) and recent findings, leaving descriptions of the experimental protocols and methodology to other articles in this issue. We finish by reviewing the results of initial applications of 13C MRS and 1H-13C MRS to study human disease and potential improvements in sensitivity, cost, and ease of performing studies
13C MRS is presently the only method that provides non invasive measurements of neuroenergetics and neurotransmitter cycling in human brain. The ability to use 13C MRS to study cell specific neuroenergetics and neurotransmitter cycling is due to the localization of key enzymes and metabolite pools in neurons and glia and the specificity of 13C labeled precursors to specific cell types. Figure 1 shows a diagram of neuronal and astrocyte (a type of glial cell) cell metabolism and the interplay of neuronal and astrocyte metabolism via the glutamate/glutamine cycle. Both neurons and astrocytes can take up glucose and oxidize it in their mitochondria via the tricarboxylic acid (TCA) cycle. As will be discussed below neurons and astrocytes in addition to glucose can oxidize lactate and betahydroxybutyrate while astrocytes can also oxidize acetate and fatty acids. Excitatory glutamatergic neurons, which account for over 80% of the neurons and synapses in the cerebral cortex (1), will release glutamate as a neurotransmitter most of which will be taken up by the astrocytes (2,3) and converted to glutamine or oxidized (4,5). Neurons lack the enzymes required for de novo synthesis of glutamate, and therefore depend on the astrocytes to provide substrates for the synthesis of glutamate lost during neurotransmission (6). The neuron then converts glutamine to glutamate via phosphate activated glutaminase. The complete series of steps from neuronal glutamate release to resynthesis of glutamate from glutamine is called the glutamate/glutamine cycle.
Figure 1. Diagram of the glutamate/glutamine cycle.

The figure above shows a schematic of metabolic pathways within glutamatergic neurons and surrounding astroglial cells. Glucose and lactate will enter both the glial (VTCAa) and neuronal TCA cycles (VTCAn) via pyruvate dehydrogenase (Vpdh), beta-hydroxybutyrate is directly incorporated into the neuronal and astroglial TCA cycles while acetate is near exclusively incorporated into the glial TCA cycle. Neuronal glutamate (Glu) that is released via neurotransmission will be taken up by astroglial cells and converted by glutamine synthetase to glutamine at a rate proportional to the glutamate/glutamine cycle. The synthesis of glutamine is believed to be exclusively within astroglia and other glial cells. In addition to neurotransmitter cycling glutamine may be synthesized de novo starting with the pyruvate carboxylase (PC) reaction (VPC). Glutamine synthesized via PC can replace neurotransmitter glutamate oxidized in the astrocyte or elsewhere (and be recycled back to the neuron) or leave the brain (Vefflux) to remove ammonia and maintain nitrogen balance (5,17,26). To measure the rates of these pathways 13C labeled substrates are used and the flow of 13C isotope into glutamate and glutamine measured using 13C MRS. For detailed descriptions of how these pathways are tracked using 13C MRS and isotopically labeled substrates and rates then calculated by metabolic modeling see (24–26,44,45,47,143).
Figure 2 shows spectra obtained at 4 Tesla from human brain localized to the midline occipital parietal lobe during infusions of three different isotopically labeled substrates: 99% enriched [1-13C] glucose, [3-13C] lactate and [2-13C] acetate, and shows labeling in the brain pools of aspartate, GABA, glutamine and glutamate. The brain pools of glutamate, GABA, and glutamine have been shown to be localized within glutamatergic neurons, GABAergic neurons, and glia respectively (under non pathological conditions). By following the flow of 13C label from glucose, acetate, and other precursors into these metabolites, MRS in combination with metabolic modeling allows the measurement of the TCA cycle rate in glutamatergic neurons, GABAergic neurons and glia, as well as, glutamate and GABA neurotransmitter cycles between neurons and astrocytes (7,8). When expressed as total substrate oxidation, the rates determined by MRS are found to be in excellent agreement with earlier methods, including Positron Emission Tomography (PET) (7,9–11). However, in vivo MRS is unique among other techniques in its measurement of cell type specific energetics and neuronal/glial neurotransmitter cycles.
Figure 2.

Localized 13C MR spectra acquired at 4 Tesla from the midline occipito-parietal lobe of a volunteer infused with 13C-labeled glucose, lactate or acetate. Upper spectrum: acquired during the last 18 min of a 2-hour [1-13C] glucose infusion. Middle spectrum: acquired during the last 18 min of a 2-hour [3-13C] lactate infusion ([Lac]Plasma ~1.5 mmol/L and 13C fractional enrichment, ~30%). Lower spectrum: acquired during the last 18 min of a 2-hour [2-13C] acetate infusion. Spectra are scaled to NAA C3 to exhibit the differences in 13C fractional enrichment reached for glutamate (Glu) and glutamine (Gln) and aspartate. The highest fractional enrichment is attained with glucose as label precursor. For glucose or lactate as precursor the majority of labeling appears in glutamate C4, consistent with the majority of brain metabolism of these substrates occurring in the neurons which contain the majority of glutamate under normal conditions (25). In contrast label from [2-13C] acetate is highly enriched in glutamine C4, consistent with the localization of acetate metabolism in the astrocyte TCA cycle as shown in figure 1 resulting in preferential labeling of glutamine C4.
Abbreviations Glu: Glutamate, Gln: Glutamine, Asp: Aspartate, NAA: N-Acetyl aspartate, GABA: Gamma-Aminobutyric Acid.
2. Studies in animal and cell models of the glutamate/glutamine cycle and neuronal and glial energetics
Although this article will primarily focus on human studies we briefly review here some relevant studies in animal and cell models which have helped validate 13C MRS measurements of neuroenergetics and neurotransmitter cycling as well as identify key questions to address in human research.
2.1 Glutamate neurotransmitter cycling is the main pathway of cerebral cortex glutamine synthesis
Although the metabolic pathways of glial glutamate uptake and the glutamate/glutamine cycle were well established from 14C radiotracer and cellular studies, they were not considered relevant to neuroenergetics prior to in vivo studies using MRS (4,12,13). Because the neurotransmitter glutamate was shown to be packaged in small vesicles, the predominant concept arose of a small, non-metabolic ‘transmitter’ pool which did not interact with the large ‘metabolic’ glutamate pool (14,15). This concept was brought into question by one of the first 13C MRS study of human brain (16) which found a high rate of glutamine labeling from [1-13C] glucose in the human occipital parietal lobe. At the time of the study it was unclear whether this high labeling was due to the glutamate/glutamine cycle or due to glutamine synthesis to remove ammonia from the brain, the latter believed to be its major role (17). As pointed out by Sibson and coworkers in 1997, these pathways could be distinguished because glutamine that leaves the brain must be replaced by anaplerosis, which occurs in glial cells (18). Furthermore, due to mass balance constraints the glutamine synthesized for this purpose must match the efflux of glutamine and uptake of ammonia and CO2 by the brain as measured by arterio-venous (AV) difference (5,18). To distinguish these possibilities glutamine synthesis was measured in rat cortex during hyperammonemia. When blood ammonia levels were extrapolated to a physiologically normal and low level, anaplerosis was found to account for approximately 20% of glutamine synthesis (18). Measurements of anaplerotic glutamine synthesis using precursors that label this pathway directly, [2-13C] glucose, 15N ammonia, and 14CO2 have found that ~80% of glutamine synthesis is devoted to neurotransmitter cycling (18–22). Analysis of 13C labeled extracellular glutamate measured by microdialysis and mass spectrometry has led to a similar conclusion that neurotransmitter cycling is the major source of glutamine (23). Similar conclusions have been obtained from studies performed in human brain using [1-13C] glucose, [2-13C] acetate and [2-13C] glucose as labeled substrates (24–27).
2.2 The glutamate/glutamine cycle is a major metabolic pathway and is directly coupled to neuroenergetics
To determine the relationship between the glutamate/glutamine cycle and cerebral cortex neuroenergetics, 13C MRS was used to measure the relationship of neuronal glucose oxidation and glutamate/glutamine cycle (Vcyc) in rat cerebral cortex (29). Cortical activity was modulated through anesthesia ranging from an isoelectric EEG to higher EEG activity at two lower doses of anesthesia. With increasing electrical activity the rates of the glutamate/glutamine cycle and neuronal glucose oxidation via the TCA cycle (expressed as CMRglc(ox) in Sibson et al. (28)) increased linearly with a slope of 1.0 +/− 0.1. Subsequent studies have confirmed this relationship (see Hyder et al. for a review (11)). Figure 3 shows a plot of measurements in the rat cerebral cortex of the rate of the neuronal TCA cycle plotted versus the rate of the glutamate/glutamine cycle (Vcyc) taken from 11 published research articles at different levels of brain electrical activity ranging from isoelectricity to awake. As reported originally by Sibson and coworkers (28) the relationship between Vcyc and 0.5 * VTCAn is linear with a slope 0.89 +/− 0.06. (We note that in the Sibson et al. paper (28) 0.5 * VTCAn was taken to be equivalent to neuronal glucose oxidation which will be the case under the hyperglycemic conditions of the study under which glucose is the only net fuel for neuronal oxidation (29)). Furthermore comparison of the intercept at isoelectricity versus the values of VTCAn and Vcyc in the awake state supports that over 80% of neuronal oxidative ATP production is coupled to neuronal signaling (as measured by Vcyc) even in the absence of stimulation. Thus the rate of Vcyc in the awake state is close to the rate of neuronal glucose oxidation and constitutes a major metabolic flux. As described below recent 13C MRS results from human cerebral cortex are consistent with this finding.
Figure 3. Approximately 1:1 relationship between the neuronal TCA cycle (0.5 * VTCAn) and the glutamate/glutamine cycle (Vcyc) with increasing electrical activity in the rat cerebral cortex.

The plot shows the mean values of 0.5 * VTCAn (equivalent to CMRglc(ox)N in Sibson et al. (28)) plotted versus Vcyc reported from 11 published studies at activity levels ranging from awake to isoelectricity (20,22,28,36,39,59,127,150–153). Regression analysis yields a slope of 0.89 (R2 = 0.92) and an intercept of 0.5 * VTCAn of 0.09 at isoelectricity (Vcyc ~0), values similar to those found in the original 1998 study by Sibson et al. (28). In the case of reference (39) for both anesthetized and awake state, values of VTCAn were calculated from the time constants reported for glutamate turnover during a glucose infusion. The ratio of glutamate to glutamine steady state fractional enrichment during [2-13C] acetate infusion was used to calculate Vcyc using the equation described in Lebon et al. (25).
There are several molecular models that have been proposed to explain the near stoichiometric relation between changes in the flux of neuronal glucose oxidation and the glutamate/glutamine cycle. The relationship has been shown to be consistent with a model in which the energy for taking neurotransmitter glutamate up into the astrocyte is provided using glycolytic ATP production from glucose or glycogen (4,30,31). Alternatively it has been shown that the observed slope can be explained based upon redox shuttling requirements between the neuronal cytosol and mitochondria in order to oxidize glutamine taken back up from the glial cells (4). Determination of the actual molecular mechanism may have important implications for understanding brain disease since any dysfunction in this mechanism would severely impact the ability to sustain neurotransmission. In addition the measured coupling between neurotransmission and neuroenergetics has provided key data for detailed models of the energy budget of the brain for supporting signaling and information transfer (32–35).
2.3 Validation of measurements of neurotransmitter cycling and anaplerosis using alternate substrates and labeling strategies
A strategy that has been used to validate the glutamate/glutamine cycle measurement is to use alternate 13C and 15N labeled substrates that are incorporated specifically in astrocytes. The subsequent flow of label from astrocyte glutamine (or other potential trafficking substrates) into neuronal glutamate then provides an independent measure of the rate of the glutamate/glutamine cycle from studies using [1-13C] glucose, which labels the neuronal glutamate pool to a greater degree than the glial pool. Animal studies employing this strategy have used as label sources 15N ammonia (27), [2-13C] glucose (5), 14CO2 (19,20), and [2-13C] acetate (36–40) and found results consistent with a high rate of glutamate neurotransmitter trafficking. Similar results have been reported in studies of human subjects using [2-13C] acetate (25,41) and [2-13C] glucose as tracers (26). In addition analysis of 15N labeling of glutamine obtained from extracellular fluid also supported the majority of glutamine being derived from glutamate neurotransmitter cycling (23). The ECF measurement in principle is a more direct assessment of the pools relevant to neurotransmission than the whole tissue MRS measurement.
In addition to the glutamate/glutamine cycle there are several other potential pathways of neurotransmitter repletion by the astrocytes including the glutamate/glutamine cycle and other cycles that use TCA cycle intermediates to return carbon to the neurons (25,42). However, the agreement found between the rates determined for the glutamate/glutamine cycle measured by [1-13C] glucose and the rates measured using glial specific substrates (which take into account all cycling pathways) suggests that the glutamate/glutamine cycle is the major pathway under normal conditions in rodents and humans in vivo (5,20,21,25,41).
2.4. Controversies regarding the relationship between neuronal energetics and the glutamate/glutamine cycle
Despite the good agreement between findings by different investigators (see Figure 3 and Table 1), there has been considerable controversy regarding the relationship between the neuronal TCA cycle and the glutamate/glutamine cycle rate. The two major areas of debate have been the proposed molecular mechanism, and the slope of the relationship due to questions regarding the accuracy of measuring VTCAn and Vcyc (4,30,32,43). In the sections below the controversies over the accuracy of determining VTCAn and Vcyc are discussed.
Table 1. Experimental mean and SD of Vcyc, VTCAn,VTCAa, VPC, Vcyc/Vgln and Vcyc/0.5 * VTCAn in the resting awake human midline occipital/parietal lobe from 13C and 1H-13C MRS studies.
As in the rat brain, the majority of human cortical glutamine synthesis is due to the glutamate/glutamine cycle as shown by the average value of Vcyc/Vgln of 0.83. Similarly the ratio of Vcyc/0.5 * VTCAn of 0.75 is consistent with the coupling between Vcyc and VTCAn measured in the rat cerebral cortex and indicates that the majority of neuronal energy production in the resting awake human brain is likely to be devoted to supporting neuronal activity. Based on the relative values of VTCAa and VTCAn and VPC, ~20% of brain ATP production occurs in astrocytes.
| Reference | VTCAtotal | VTCAn | VTCAa | Vcyc | VPC | Vcyc/ 0.5 * VTCAn |
Vcyc/ Vgln |
|
|---|---|---|---|---|---|---|---|---|
| (45) | Mason et al., 1995 ** | 0.73 | ||||||
| (58) | Gruetter et al., 1998 | 0.74 | 0.32 | 0.08 | 0.86 | 0.80 | ||
| (27) | Shen et al., 1999 | 0.77 | 0.71 | 0.06 | 0.32 | 0.04 | 0.90 | 0.95 |
| (57) | Pan et al., 2000*** | 0.66 | ||||||
| (84) | Chen et al., 2001** | 0.83 | ||||||
| (75) | Bluml et al., 2002 | 0.70 | 0.13 | |||||
| (25) | Lebon et al., 2002 | 0.12* | 0.28* | 0.78 | ||||
| (148) | Chhina et al., 2001 | 0.75 | 0.29 | |||||
| (24) | Gruetter et al., 2001 | 0.63 | 0.57 | 0.06 | 0.17 | 0.09 | 0.60 | 0.65 |
| (26) | Mason et al., 2007 | 0.72 | 0.02 | 0.73 | 0.93 | |||
| (41) | Boumezbeur et al., 2009 | 0.65 | 0.53 | 0.13 | 0.16 | 0.64 | ||
| (140) | Sailasuta et al., 2010 | 0.09 | ||||||
| (149) | Henry P.-G. et al., 2010** | 0.79 | ||||||
| Mean ± SD | 0.69 ± 0.06 | 0.70 ± 0.09 | 0.09 ± 0.04 | 0.26 ± 0.08 | 0.06 ± 0.03 | 0.75 ± 0.12 | 0.83 ± 0.14 | |
Measured steady state ratios converted to rates using the value of VTCAn from Shen et al. (27)
One compartment model for the neuron used. We assume the derived TCA rate most closely reflects VTCAn.
Average of white and gray matter rates which were measured separately.
2.4.1 The fraction of glutamine synthesis due to anaplerosis via pyruvate carboxylase as opposed to neurotransmitter cycling
As shown in Figure 1 in addition to neurotransmitter cycling glutamine synthesis is used to replace glutamine that leaves the brain for ammonia detoxification and maintenance of nitrogen balance across the blood brain barrier (5,17). Glutamine synthesis used to maintain nitrogen balance derives from anaplerosis via pyruvate carboxylase (PC), which under normal conditions appears to exclusively take place in astrocytes (and glial cells in general). The controversy regarding anaplerosis has largely been settled due to a convergence of results in animal models (5,11,19,20,23) and similar findings in human brain (24,26), (see section 3). There is now general consensus that in rat cerebral cortex a minimum of 80% of glutamine synthesis supports neurotransmitter cycling under normal conditions and between 70 and 90% in humans. Of the remaining 20% of glutamine synthesized by anaplerosis the majority is likely also used to replete neurotransmitter glutamate that is oxidized in the glial cells (see below) as opposed to ammonia detoxification (5,26).
2.4.2 The effect of a slow rate of the mitochondrial glutamate exchange, Vx, on calculating neuronal TCA cycle rate, VTCAn
Another factor that may influence the measured relationship is the rate of exchange of label from mitochondrial alpha-ketoglutarate to cytosolic glutamate, often termed Vx in the literature. If this exchange is not much faster than the TCA cycle rate it may cause an underestimate of VTCAn unless it is incorporated in the metabolic modeling through measurement of the C2 and/or C3 positions of glutamate (24,44). Interestingly, it has been noted that independent of whether multiple glutamate positions were measured, very little difference has been found in the calculated rate of VTCAn or Vcyc in studies of human brain (see Hyder et al. (11)). Based on numerical simulations it has been shown that the accuracy of measuring Vx in the brain using 13C MRS is low (44,45), which most likely explains the extended controversy on this issue. Recently, Yang et al. using an elegant saturation transfer method has shown that Vx is at minimum several times greater than VTCAn in the brain, explaining why it has not impacted measurements of rates of the neuronal TCA cycle (46).
In addition to the consistency of results between different studies and labs the rates of VTCAn measured in rat and human cerebral cortex are consistent with results previously published using 14C-2-deoxyglucose autoradiography, AV difference, and PET (7,11). Recently two studies have directly compared positron emission tomography measurements in non human primates with 13C MRS and found excellent agreement between the total rate of glucose metabolism measured (9,10).
2.4.3 Effects of isotopic dilution of glutamine on the calculated rate of neurotransmitter cycling, Vcyc
Shestov and co workers published the results of simulation studies in which they reported much poorer precision measuring the rate of the glutamate/glutamine cycle using a [1-13C] glucose precursor than reported in experimental papers (44). Shen and coworkers (47) were able to explain this discrepancy by showing that when isotopic dilution of glutamine was taken into account, as had been done in most previous experimental studies but not in the simulations by Shestov et al. (44), the theoretical precision for the Vcyc measurement was similar to that reported experimentally. A similar conclusion regarding the importance of including the glutamine dilution in metabolic modeling was arrived at by Oz and coworkers when comparing rates calculated using [1-13C] glucose and 14C CO2 as precursors (20). We note that when astrocyte specific labels such as [2-13C] acetate are used to determine Vcyc, alone or in combination with [1-13C] glucose, considerably higher precision for measuring Vcyc is obtained (38,41).
2.4.4 Oxidation of neurotransmitter glutamate
Glutamate released by neurons and taken up into astroglia can undergo oxidation as well as being converted to glutamine. The oxidized glutamate is then replaced by anaplerosis and cycled back to the neuron as glutamine (4). This scenario of oxidation and replacement by anaplerosis must occur in order to maintain constant levels of TCA cycle intermediates and glutamate-derived neurotransmitters since transport of necessary five-carbon precursors from blood are comparatively minimal. This possibility is seen by several researchers as being in contradiction to the measured relationship between cycling and energetics (48). However, as described previously the presence of glutamate oxidation has no impact on the MRS measurement of the glutamate/glutamine cycle using an glial specific labeled precursor such as [2-13C] acetate because the oxidized glutamate is replaced by de novo glutamine synthesis, which is cycled back to the neuron (5,25,26). When [1-13C] glucose is used as the precursor, replacement of oxidized glutamate will be included in the anaplerotic contribution to glutamine synthesis, unless it is distinguished from glutamine synthesis related to ammonia removal (detoxification) based on other measurements.
3. In vivo 13C MRS studies of human brain
In the sections below we review results from 13C and 1H-13C MRS studies of human brain, focusing primarily on studies that report metabolic rates or labeling. Following initial studies of the animal brain in the 1980s (49–51) the availability of high field human MR systems and improvements in BØ shimming (52) led to the first 13C and 1H-13C MRS studies of humans (16,53–55). While the use of 13C MRS in humans has been relatively limited (see Section 4) 13C MRS has already made major contributions to understanding human brain energetics and neurotransmitter cycling and how alterations in these pathways may contribute to a range of human diseases.
3.1 13C MRS measurements of the rate of the neuronal and astrocyte TCA cycle and Vcyc in human brain
Table 1 shows a compilation of studies from different groups measuring the rates of VTCAn, VTCAa, VPC, and Vcyc in the human midline occipital lobe. As can be seen there is very good agreement in the rates derived by different studies, with most of the difference explainable by different volume fractions of white matter (which has an approximately 3–4 times lower rate of VTCAn than gray matter (56,57)). As discussed above the rates of VTCAn are similar whether the modeling used the C4, C3, and C2 positions of glutamate and glutamine or just the C4 positions. For the measurement of VTCAa there is good agreement between three independent label strategies using [1-13C] glucose, [2-13C] acetate and 13C bicarbonate as precursors. In the human studies the rate of the neuronal TCA cycle largely reflects glutamatergic neurons since it is derived from fitting the isotopic turnover of the large glutamate pool. Although the rate of the GABAergic neuron TCA cycle has not yet been determined labeling of GABA during infusion of [1-13C] glucose has been reported at 4T (24,58). Results in animal models suggest that on the order of 10% of cerebral cortex energy consumption may be due to GABAergic neurons (22,59).
3.2 The relationship between neuronal energetics and the glutamate/glutamine cycle in human brain and implications for resting brain functional activity
13C MRS studies by several groups have found a ratio of VTCAn to Vcyc that is highly consistent with the predictions based upon studies performed in the rat. Table 1 shows the ratio of Vcyc/0.5 * VTCAn derived in human studies. The values range from 0.6 to 0.9 with an average of 0.75 ± 0.12. This average is similar to the value of Vcyc/0.5 * VTCAn predicted from animal studies using the best fit of the relationship between Vcyc and VTCAn in Figure 2. The variation in the ratio measured in humans is largely due to variation in the measurement of VPC. However based upon AV measurements in humans the majority of VPC is for replacement of oxidized glutamate and therefore reflects glutamine synthesis that is cycled back to the neuron (26). Overall these studies show that functional neuronal activity is extremely high in the awake resting human brain and if there is a similar relationship as in the rat accounts for the majority of neuronal glucose consumption. Furthermore the energy devoted to neuronal activity in the resting state is much higher than the changes in activity that occur during standard activation paradigms such as cognitive challenges and visual stimulation (60). These findings have contributed to the recent surge in interest in studying resting brain activity by fMRI and other methods and form part of the basis of several theories of resting brain function (60,61).
3.3 Measurements of the rate of glutamine synthesis via pyruvate carboxylase in human cerebral cortex
Due to the astrocyte localization of PC, anaplerosis occurs only in the glia and is used both to synthesize glutamine that leaves the brain to maintain nitrogen balance and to replace released neurotransmitter glutamate oxidized in the astrocytes. In order to address the question of what fraction of glutamine synthesis is due to the glutamate/glutamine cycle versus anaplerosis via PC several studies in human brain have measured this rate. As shown in table 1, based on these measurements the fraction of glutamine synthesis due to the glutamate/glutamine cycle (Vcyc/Vgln) has been reported to range between 0.65 and 0.93 in human cerebral cortex with a mean value of rate of 0.83 ± 0.14. (24,26,27). A complication in using [1-13C] glucose precursor to measure this ratio is that label enters the inner positions of glutamate both via pyruvate dehydrogenase and PC. To eliminate the complications arising from [1-13C] glucose as precursor, Mason and coworkers (26) measured 13C incorporation into glutamate and glutamine in the midline occipital/parietal lobe of human volunteers from infused [2-13C] glucose, which labels the C2 and C3 positions of glutamine and glutamate primarily via PC. Labeling in glutamate C4 was used to assess the rate of pyruvate recycling coupled to glutamate oxidation. Metabolic modeling of the labeling data indicated that PC flux (VPC) ranges from 6 to 10% of the rate of glutamine synthesis (0.02 to 0.03 μmol/g/min). Comparison of the measurements of VPC in humans to date with AV difference measurements of human brain glutamine efflux suggests that the majority of the PC flux is used for replacing glutamate lost by oxidation in glia and possibly elsewhere, and therefore can be considered to support neurotransmitter cycling (26).
3.4 Studies of substrate oxidation and transport
Because of its ability to distinguish a substrate from its metabolic products 13C MRS can be used to independently assess both the parameters of transport and rates of metabolism. Furthermore, it can be uniquely used to determine cell type specific metabolism. Glucose has long been known to be the primary fuel for brain metabolism (29). However the brain can also consume alternate substrates including acetate, beta-hydroxybutyrate, and lactate. Beta-hydroxybutyrate is a particularly important substrate during development and under conditions of fasting where AV difference methods have revealed its capacity to supply up to 60% of the fuel oxidized by the brain (62). Similar high rates of utilization of lactate has been reported under conditions of elevated plasma lactate, such as during exercise (63,64). Although total usage and oxidation of these substrates have been determined for humans by AV difference methods, and to some extent by PET, the 13C MRS studies reviewed below have provided the first information on the cell-type specificity of substrate usage, as well as revealing new insights into blood-to-brain transport of these substrates.
3.4.1 Glucose
Due to the commercial availability of [1-13C] glucose, and the high rate of brain glucose metabolism, the majority of metabolic 13C MRS studies have been focused on the measurement of neuronal and glial glucose metabolism (see Section 3.1). 13C MRS has been used to measure glucose transport parameters (KT and Tmax) in the human midline occipital/parietal lobe (54). Subsequent studies of brain glucose transport in humans have used 1H MRS for higher sensitivity. These studies have provided support for the blood-brain-barrier being the rate limiting step for human brain glucose transport (65), which is best described by a reversible, Michaelis-Menten transport model (as opposed to the non reversible model used previously to interpret most PET glucose studies (66,67)) (68,69). In this model glucose transport is described by transporters with reversible Michaelis-Menten kinetics across the membranes of the capillary endothelial cells that make up the blood brain barrier (66,67). Based on in vivo kinetic and isolated transporter studies the glial and neuronal glucose transporters have a relatively much higher activity and can to a first order be neglected in the kinetic modeling. These results have been used to develop and test kinetic models of glucose transport and metabolism (68), and may have potential value for assessing whether impaired substrate delivery may impact brain function in disease (70).
3.4.2 Acetate
Studies in animal models and neural cell culture have found that acetate is almost exclusively transported into and metabolized by the astroglia (37,71–74). Lebon and coworkers studied healthy human subjects infused intravenously with [2-13C] acetate while monitoring 13C labeling in the midline occipital/parietal lobe with 13C MRS (25). The concentration of brain acetate was ~10 fold lower than the plasma concentration indicating that acetate transport was primarily unidirectional. Analysis of the steady state 13C labeling pattern of glutamine and glutamate, as shown in Figure 2, as well as the kinetics of glutamate and glutamine labeling were consistent with acetate metabolism localized to glial cells (25). Furthermore the steady state labeling patterns were in agreement with findings from [1-13C] glucose of a high rate of glutamate/glutamine cycling (25,41). Similar conclusions were obtained by Bluml et al. using [1-13C] acetate as a precursor (75). Although normal plasma levels of acetate in humans are relatively low, the levels can be elevated to ~1 mM or more by alcohol consumption, becoming a major source of oxidative energy for the astrocyte (25,41,75,76).
3.4.3 Beta-hydroxybutyrate
Beta-hydroxybutyrate (BHB) is a substrate critical for brain function during fasting. BHB enters the brain via facilitated diffusion using a monocarboxylate carrier at the blood-brain barrier (70). Although brain BHB consumption had been studied extensively using AV difference methods it was not known whether BHB was preferentially consumed in neurons or astrocytes, or whether the blood-brain barrier was limiting for its metabolism (29). To answer these questions localized 13C MRS measurements were performed during an infusion of [2,4-13C] BHB in healthy subjects and the entry and metabolism of BHB was measured in the medial occipital/parietal cortex (77). During the two-hour infusion study, 13C label was detected in the BHB resonance positions at a time resolution of 5 minutes and in the amino acid pools of glutamate, glutamine and aspartate. The pattern of the 13C labeling at the steady state period (60- to 120 minutes) was very different from that resulting from infusions of 13C-acetate, but was broadly similar to that of [1-13C] glucose, indicating a predominant neuronal consumption of this substrate. The cortical BHB concentration (0.18 mM) was much lower than in plasma (2 mM) indicating that transport across the blood-brain barrier limits brain BHB metabolism. Consumption of BHB accounted for ~6 % of total brain oxidative metabolism in non-fasted volunteers, consistent with earlier reports using AV difference methods (29).
3.4.4 Lactate
Studies over the last decade have provided evidence that lactate may be an important metabolic fuel for the brain, including proposals that an astrocyte-to-neuron lactate shuttle may exist in order to provide neurons with fuel during periods of enhanced activity (30,32). In addition AV difference and PET studies of humans after blood lactate elevation by exercise have reported that when elevated lactate can provide a significant fraction of oxidative fuel to the brain (63,64). To determine the conditions under which plasma lactate might contribute as a significant fuel for human brain energy metabolism, Boumezbeur and coworkers infused [3-13C] lactate and measured by 13C MRS the entry and utilization of lactate in the midline occipital/parietal cortex of healthy human volunteers (78). During the 2-hour infusion study, 13C incorporation in the amino acid pools of glutamate and glutamine were measured every 5 minutes. With a plasma concentration of lactate ([Lac]P) being in the 0.8–2.8 mmol.L−1 range, the brain tissue lactate concentration ([Lac]B) was assessed as well as the fractional contribution of lactate to brain energy metabolism (CMRlac). By fitting the measured relationship between unidirectional lactate influx (Vin) and plasma and brain lactate concentrations, the lactate transport constants were calculated using a model in which the rate limiting step was assumed to be, based on previous work, lactate transport at the blood brain barrier. The transporters at the blood brain barrier were modeled as reversible Michaelis Menten transporters similar to what has been done with glucose transport. The results showed that in the physiological range of plasma lactate concentration, the unidirectional rate of transport and concentration of brain lactate rose linearly with plasma concentration. The maximum potential contribution of plasma lactate to brain metabolism was 10% for basal plasma lactate concentration of ~1.0 mM, and possibly as much as 60% at supraphysiological plasma lactate concentrations when the transporters are saturated (assuming lactate oxidation is limited only by transport). Based on the similarity of the steady state pattern of 13C labeling, as shown in Figure 2, it was concluded that the relative consumption of plasma lactate between neurons and astrocytes is similar to that of glucose (78). The calculation of the lactate metabolic capacity is in good agreement with recent AV difference studies using isotopically labeled lactate as a tracer, further confirming the potential importance of plasma lactate as a substrate for brain metabolism (63).
3.5 Use of 1H-13C MRS to study the energetics of brain tissue types (white/gray matter) and sensory stimulation
As described in Section 4 the sensitivity and spatial resolution limitations of 13C MRS can be partially overcome by using the more sensitive 1H nucleus to measure the 13C enrichment of bound carbon atoms. These inverse MRS methods take advantage of the J coupling between 1H and 13C nuclei (51,79). By combining 1H-13C MRS with spectroscopic imaging and gray/white matter segmentation Pan and coworkers reported the rates of VTCAn in gray and white matter finding a ~4 times higher rate of metabolism in gray matter (57). The higher resolution of 1H-13C MRS has been used to address the question of whether glycolytic or oxidative ATP production provides most of the incremental energy for brain function during activation (11,80–83). Using this technique Chen and co workers reported a 25% increase in VTCAn during visual stimulation (84). This finding is consistent with recent calibrated fMRI measurements of CMRO2 (85–87), and indicates that ATP produced oxidatively is the major source of energy for the incremental neuronal activity during sensory stimulation.
3.6 Application of 13C MRS to study neuroenergetics and neurotransmission in human brain disease
The important role of neuroenergetics, and the glutamate/GABA neurotransmitter cycles, in the pathogenesis of brain disease is being increasingly recognized. Changes in the concentrations of GABA, glutamate, and glutamine have been measured by 1H MRS in a wide range of neurological and psychiatric diseases including aging (88), depression and related disorders (89–94), epilepsy (95–97), genetic disorders of metabolism (98), hepatic encephalopathy (99), and neurodegenerative disorders (100). However, concentration measurements while informative are not specific for the alterations in metabolic fluxes or cellular neurochemical distributions that may have lead to a change. 13C MRS allows the measurement of metabolic rates in humans, may potentially be of great value in studying the pathogenesis and treatment of brain disease. However, its application to disease has been limited by several factors, including the technical complexity of conducting 13C MRS experiments, which is exacerbated by the lack of such study support with most clinical scanners. Furthermore there is the need for a support team to perform the infusion and analysis of substrates labeled with 13C isotope, the relatively low sensitivity and volume resolution of 13C MRS compared with 1H MRS (and especially MRI), availability and cost of 13C-labeled substrates, RF heating concerns due to the need to decouple the J interaction of 13C resonances with bound protons, and the need to perform sophisticated kinetic analysis to extract metabolic rate information from the MRS data (see Ross et al. for an informative review on clinical 13C MRS studies in humans and the obstacles in performing them (101)). In section 4 we speculate on how some of these barriers may be lowered through a range of developments, including hyperpolarized 13C. Despite these challenges the initial applications of 13C MRS in studies of human brain disease and dysfunction have been highly informative, which are briefly reviewed below.
3.6.1 Application of 13C MRS to study stroke and tumors
The initial application of 13C MRS to clinical brain disease was to assess the source of chronic lactate elevation in stroke. In this study 1H MRS was used to measure lactate 13C fractional enrichment in an infarct during infusion of [1-13C] glucose. 1H MRS was used due to its several fold higher sensitivity for measuring 13C enrichment than direct 13C MRS (102). The lactate was found to rapidly incorporate label from glucose indicating active metabolic production even long after the initial infarct event (103). Subsequent 1H MRS and histological assessment indicated that most of the lactate elevation in chronic stroke was likely to be due to macrophage metabolic activity and infiltration (104). A similar strategy was used in animal models of brain cancer by Terpstra and coworkers to assess the metabolic source of lactate in tumors (105). Recently 13C MRS was used to measure lactate turnover in a human brain tumor (106).
3.6.2 Application of 13C MRS to study hepatic encephalopathy and genetic diseases of ammonia metabolism
Studies by Ross and coworkers have established 1H MRS measurements of glutamine and glutamate as one of the best ways to assess the severity of hepatic encephalopathy, a disease of the brain that is caused by chronic exposure to elevated ammonia in the blood due to liver failure (23,99,107,108). Animal studies using conventional methods, as well as 13C and 15N MRS, showed that ammonia led to increased anaplerosis and glutamine synthesis in astrocytes, as well as disruption of the glutamate/glutamine cycle (5,17,27,109–112). To test whether similar metabolic alterations were present in humans Bluml and coworkers studied patients with diagnosed hepatic encephalopathy during infusion of [1-13C] glucose at 1.5T. The studies found disrupted neuroenergetics with increasing disease severity, including evidence for impairment in the glutamate/glutamine cycle (113). More recently Gropman and coworkers have used 13C MRS to demonstrate abnormalities in glutamate metabolism patients with ornithine transcarbamylase deficiency (114).
3.6.3 Application of 13C MRS to study Alzheimer’s disease and healthy aging
Mitochondrial dysfunction has been implicated in the loss of brain function in neurodegenerative disease and normalcaging (115). Studies using PET have found decreased rates of brain oxygen consumption and glucose consumption in Alzheimer’s disease and in healthy aging (116,117). In a pioneering study on Alzheimer’s disease, Ross and coworkers infused 2 patients with [1-13C] glucose and found a reduction in 13C labeling of C4 glutamate, consistent with an impairment in the TCA cycle (118). Recently, Boumezbeur and coworkers using combined infusions of [1-13C] glucose and [2-13C] acetate with 13C MRS, compared a healthy group of elderly subjects with young adult controls. The elderly subjects showed decreased rates of the neuronal TCA cycle (VTCAn) and glutamate/glutamine cycle along with an increased rate of the astroglial TCA cycle (41), changes which were independent of the relatively small age-dependent loss of brain tissue volume. The decrease in the neuronal TCA cycle rate correlated highly with decreases in NAA and glutamate concentrations (Fig. 4) indicating that the reduced metabolic rates were associated with cellular level changes as opposed to differences in sensory input. These findings are consistent with the theory that mitochondria lose oxidative capacity with advancing age leading to loss of brain function. Overall, the ability to study aging and associated dementias with 13C MRS provides a unique opportunity to study the role of mitochondria in the pathogenesis process and how this process can be slowed or ceased through treatment.
Figure 4. Comparison of VTCAn versus glutamate and NAA concentrations in the midline occipital parietal lobe of healthy elderly subjects.
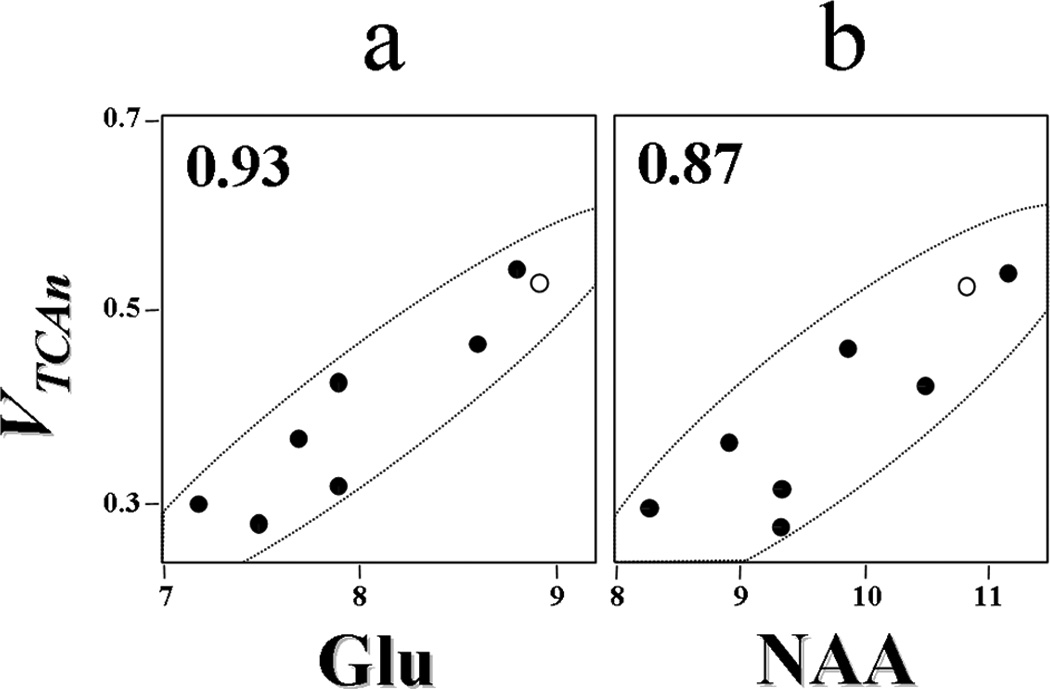
The results show a strong correlation between the rate of the neuronal TCA cycle and the concentrations of glutamate (Glu) and NAA, both of which have been associated with cellular dysfunction and chronically reduced mitochondrial activity in other studies. Pearson correlation coefficients appear in upper left corners of a and b Closed circles, values measured for the individual elderly subjects (n=7). Open circles, average values for the respective metabolite concentrations from a young cohort (n=7). Fluxes and metabolite concentrations are expressed as µmol.g−1.min−1 and µmol.g−1 respectively.
3.6.4 Application of 13C MRS to study type 1 diabetes complications
A major complication in insulin therapy for type 1 diabetes is hypoglycemia, the frequency of which is worsened due to the phenomenon of hypoglycemia unawareness (119,120). Among the theories to explain this phenomenon is that repeated hypoglycemic episodes in type 1 diabetics may lead to metabolic adaptations that allow improved function during periods of mild hypoglycemia. Using [2-13C] acetate as a tracer, Mason and coworkers tested the hypothesis that patients with type 1 diabetes have upregulated blood-to-brain transport and metabolism of monocarboxylic acids (e.g., acetate, beta hydroxybutyrate, and lactate), supporting heightened brain function during hypoglycemia (76). In their study of the medial occipital/parietal cortex, type 1 diabetics showed increased metabolism of acetate, which was most likely secondary to increased acetate transport. An example of the higher 13C labeling attained in the patients with type 1 diabetes is shown in Figure 5. At a blood concentration of 1 mM acetate was found to provide on average ~20% of astrocyte oxidative needs in control subjects and ~35% in patients with type 1 diabetes. Oz and coworkers used 13C MRS to show that brain glycogen may be a significant fuel source during hypoglycemia and that hypoglycemia led to elevated glycogen synthesis upon restoration of normal glucose levels (121). Future studies may be able to determine whether these alternate fuel sources can account fully for the cortical component of hypoglycemia unawareness.
Figure 5. Comparison of steady state 13C MRS spectra during [2-13C] acetate infusion from a type 1 diabetic with a healthy control subject.

Brain 13C MRS spectra were averaged over the final 45 min of a hypoglycemic period during infusion of [2-13C] acetate. The diabetic subject (top spectrum) had significantly greater labeling in glutamate (Glu) and glutamine (Gln) C4 than the control (bottom spectrum). The acetate C2 signal was also greater in the diabetic subject. Other resonances labeled in the figure include N-acetylaspartate (NAA) C4, GABA C2, and Glu C3.
3.6.5 Application of 13C MRS to study epilepsy
Epilepsy has been studied extensively by 1H MRS and there is considerable evidence from PET, 1H MRS, and 31P MRS of hypometabolism in brain regions affected by epilepsy that may be secondary to a failure in neuroenergetics (122). Furthermore, in medial temporal lobe epilepsy chronically elevated extracellular glutamate has been found by microdialysis in epileptogenic sclerotic tissue, possibly contributing to the hyperexcited state of the tissue (123). In order to test whether the chronically elevated extracellular glutamate was due to an impairment in glial glutamate uptake and cycling, Petroff and coworkers obtained neurosurgical specimens from patients intravenously infused with [2-13C] glucose and analyzed the labeling ex vivo using high-resolution 13C MRS (124). In the epileptogenic tissue from the hippocampus with sclerosis and glial proliferation there was marked impairment in glutamate/glutamine cycling compared with more histologically normal tissue (124). A subsequent study showed that this impairment in glutamate/glutamine cycling may be secondary to reduced activity in glutamine synthetase establishing this step in the pathophysiology and as a potential therapeutic target (125).
3.6.6 Application of 13C MRS to study pediatric disease
The increasing concerns over radiation dosage in PET scans of pediatric patients have provided additional motivation for noninvasive application of 13C MRS with this vulnerable group. Studies of infants and young children with 13C MRS however are complicated by the need for extended infusion times increasing the time spent in the magnet. To assess the feasibility of pediatric studies Bluml and colleagues performed 13C MRS on 17 children and pediatric patients receiving [1-13C] glucose either orally or intravenously (126). They observed marked differences in 13C labeling patterns in premature brain and pediatric patients with leukodystrophies and mitochondrial disorders. This study demonstrated the significant potential of 13C MRS applications to pediatric disease, particularly with the improvements in sensitivity discussed in Section 4.
4. Future prospects for 13C MRS studies in humans
As discussed in Section 3 there are several major challenges that must be met for 13C MRS to become a routine tool in the study of human brain disease and treatment. Below, we briefly discuss these limitations and how they may be overcome through future technological developments.
4.1 Improvements in the sensitivity and spatial resolution of the 13C MRS measurement
The primary limitation for the study of human brain disease by 13C MRS is its low sensitivity, with typical volume resolution being on the order of 25 to 100 cm3. Substantial improvements have been achieved by detecting 13C labeling indirectly via the J scalar coupling to bound protons (55,103), enhancing spatial resolution to several cm3 obtained at 4 Tesla (57,84). However, due to the limited spectral resolution of 1H MRS only labeling of glutamate C4, the combined resonances of glutamate and glutamine C3, and lactate C3 have been reported, limiting the rates that can be measured to the neuronal TCA cycle, or in cases of elevated lactate to glycolysis. With the advent of ultra-high field human MRS systems (7 Tesla and above), in principle it should be possible to measure resonances of glutamine and GABA, as has been demonstrated in animal studies (59,127,128), although increased heating associated with decoupling at higher fields may limit this application.
An alternate possibility, which would retain the high spectral resolution and information of direct 13C MRS, and provide much higher spatial resolution, is the use of hyperpolarized 13C MRS and there are several promising initial reports in animal models (129–131). The major limitations in measuring the rates of the pathways discussed in this article are that there are several enzymatic steps between the precursor (e.g. acetate, lactate, glucose) and enzymatic reactions in the pathways of interest. For example to measure the rate of the glutamate/glutamine cycle from hyperpolarized 13C acetate the acetate must first be transported into the glial cells, then converted successively to acetyl CoA, citrate, isocitrate, alpha-ketoglutarate, and glutamate before being converted by glutamine synthetase into glutamine. Based on the concentration of the precursor pools and metabolic rate of acetate metabolism it would take on the order of 1 to 2 minutes for the immediate precursor glial glutamate to be labeled sufficiently to measure the glutamine synthesis rate. Measurement of the glial and neuronal TCA cycle and anaplerosis may be feasible by directly looking at TCA cycle intermediates (e.g. citrate) from precursors such as [2-13C] acetate and [2-13C] lactate which label TCA cycle intermediates in one or two enzymatic steps. An alternate approach is to directly hyperpolarize TCA cycle intermediates themselves, the feasibility of which has been demonstrated in extracts (131).
4.2 Improvements in shimming and reduction of RF heating to allow multi volume 13C MRS
To date the majority of human brain 13C MRS studies have been performed in the midline occipital or occipital/parietal lobe, due largely to the relative ease of shimming to improve BØ homogeneity in this region and the distance from the eyes which are believed to be more sensitive than the brain to heating from the decoupling B1 field. Over the last decade limitations due to shimming have been greatly reduced based on improvements in shim coil strengths and advanced field mapping and shim calculation and updating methods, allowing well shimmed spectra to be obtained from multiple volumes within the human brain even at ultra-high fields (52,132–134).
A continuing limitation is heating that results from the applied RF energy to the protons bound to 13C needed to decouple the J interaction. It has been shown that there are theoretical limits on the minimum decoupling power (135), which even at 4 Tesla are close to the allowable power deposition limits mandated by the United States Food and Drug Administration (FDA) (136). Although advances in RF coil design allow human brain 13C studies to be performed safely even up to 4 Tesla (137,138), concerns remain about RF heating of the eyes which may be more vulnerable than the brain due to areas of restricted circulation. A recently developed alternate approach to circumvent the RF heating is to observe 13C labeling of the carboxyl groups of glutamate and glutamine which require no (or low power) decoupling (139,140). This approach takes advantage of the turnover kinetics of glutamate (Glu) C5 from exogenous [2-13C] glucose, which is identical to the turnover of Glu C4 from exogenous [1-13C] glucose (141). The carboxylic carbons are only coupled to protons via very weak long-range 1H-13C scalar couplings so that they can be effectively decoupled at low RF power. An additional advantage of this strategy is the lack of contamination from subcutaneous lipids because there are no overlapping fat signals in the vicinity of the glutamate C5 and glutamine C5 peaks. An example showing the feasibility of this strategy at 3 Tesla is the work of Li et al. (Figure 6)(141). High quality spectra can be obtained with a maximum regional power deposition in the brain below 2 W/kg, several times below the FDA limit, even using a 1H resonator to deliver the RF decoupling field (142). The ability to deliver RF decoupling from a volume coil further opens up the possibility of multi-volume whole brain 13C MRS.
Figure 6. 13C MRS time course spectra of glutamate, glutamine, and aspartate turnover detected in the occipital lobe during intravenous infusion of [2-13C] glucose.
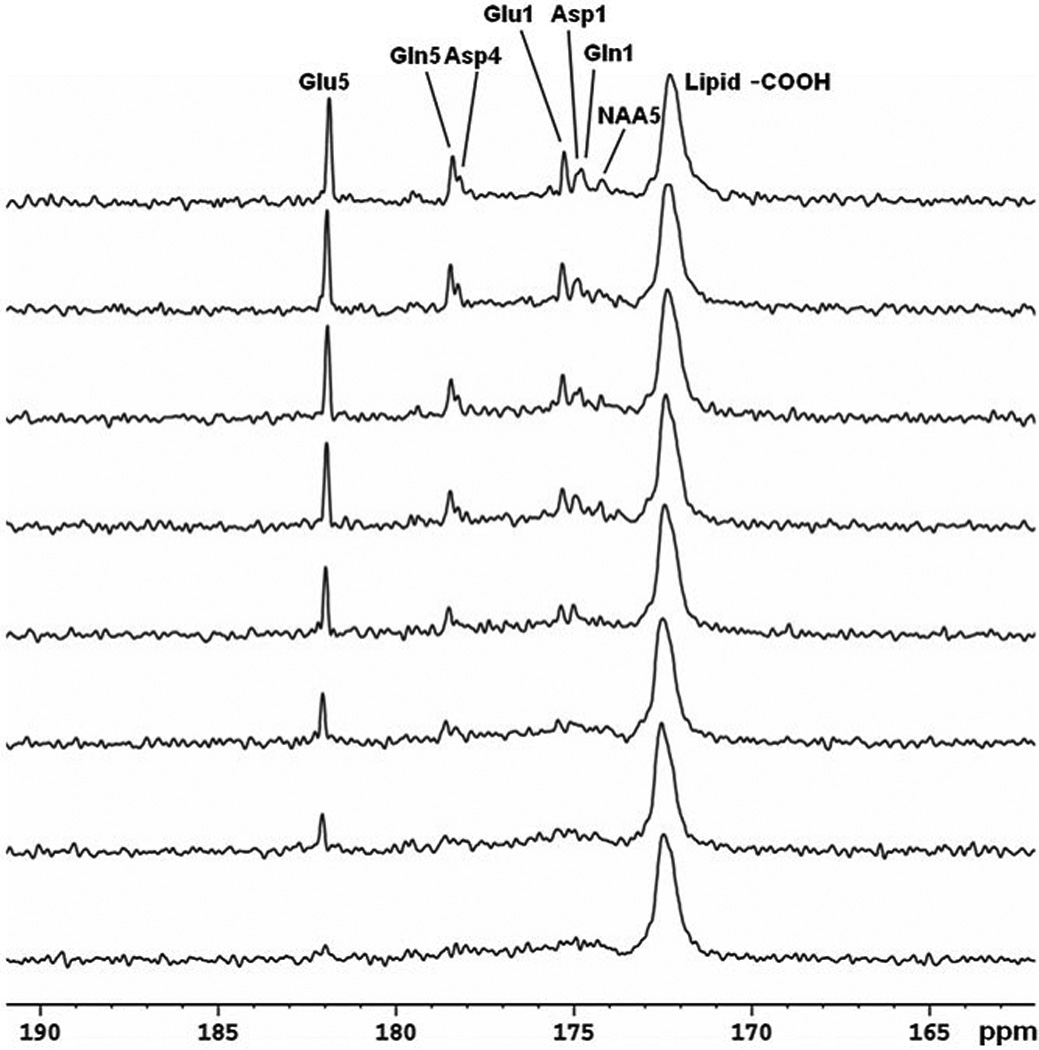
Lorentz–Gauss transformation (LB = 3 Hz, GB = −0.3) was applied. The time-averaged decoupling power was 1.46 W. Each spectrum corresponds to 8.5-min of signal averaging (128 scans). Glu C5 (182.0 ppm) and C1 (175.4 ppm), Gln C5 (178.5 ppm) and C1 (174.9 ppm), Asp C4 (178.3 ppm) and C1 (175.0 ppm), as well as NAA C5 (174.3 ppm) were detected. No baseline corrections were made. Glu, glutamate; Gln, glutamine; Asp, aspartate; NAA, N-acetylaspartate. Figure adapted from Li et al. (141).
An alternate approach to reduce RF heating would be to use hyperpolarized 13C MRS without decoupling. The higher sensitivity of hyperpolarized 13C would in principle make decoupling unnecessary. However due to the blood brain barrier restricting the ability to isotopically label brain metabolites from plasma 13C labeled substrates decoupling may be necessary even for hyperpolarized 13C MRS applications.
4.3 Improvements in 13C infusion protocols
A third major limitation in 13C MRS studies is the requirement for a continuous infusion of the isotopically labeled substrate with venous sampling for fractional enrichment determination. This infusion must occur over a time period (typically two hours) to capture sufficient kinetic information from spectral time courses for absolute rate estimation using metabolic modeling (24,45,143). However several studies have shown it is possible to obtain considerable information on metabolism using simplified infusion schemes or oral ingestion (144–147). Given that the majority of information on absolute and relative rates is derived from the early and steady state portions of the time course a significant reduction in the time required for a subject to be in the scanner may be possible (143).
5. Summary and Conclusions
Work over the past two decades has established 13C MRS studies of the brain in animal models and humans as the only non invasive method for measuring neuronal and glial energy metabolism and glutamate and GABA neurotransmitter cycling. Although some debates regarding metabolic modeling remain, much of our present knowledge of the brain energy budget (glutamatergic neurons, GABAergic neurons, astrocytes) and the relationship between neuroenergetics and neurotransmission has been obtained from in vivo 13C MRS studies. 13C MRS studies have also played an important role in delineating how alternate substrates such as acetate, ketone bodies, and lactate support neuronal and astrocyte energetics. The application of 13C MRS to study human disease faces considerable obstacles, particularly cost, the need for 13C substrate infusions and monitoring, decoupling heating, and the low sensitivity of 13C MRS and lack of technical capability of most MR systems. Despite these difficulties 13C MRS has been successfully applied to study a variety of neurological and psychiatric diseases as well as diabetes and healthy aging. The increasing availability of high field MR magnets, which allow higher sensitivity indirect detection methods, and the development of hyperpolarized 13C have the potential of greatly increasing the sensitivity of the method leading to the possibility of using 13C MRS for metabolic imaging of the human brain. These technological developments along with further improvements in 13C infusion protocols to minimize patient time in the magnet have the potential of greatly expediting clinical and research studies.
References
- 1.Shephard GM. The synaptic organization of the brain. Oxford, U.K: Oxford University Press; 1994. [Google Scholar]
- 2.Rothstein JD, Dykes-Hoberg M, Pardo CA, Bristol LA, Jin L, Kuncl RW, Kanai Y, Hediger MA, Wang Y, Schielke JP, Welty DF. Knockout of glutamate transporters reveals a major role for astroglial transport in excitotoxicity and clearance of glutamate. Neuron. 1996;16(3):675–686. doi: 10.1016/s0896-6273(00)80086-0. [DOI] [PubMed] [Google Scholar]
- 3.Bergles DE, Diamond JS, Jahr CE. Clearance of glutamate inside the synapse and beyond. Curr Opin Neurobiol. 1999;9(3):293–298. doi: 10.1016/s0959-4388(99)80043-9. [DOI] [PubMed] [Google Scholar]
- 4.Hertz L, Peng L, Dienel GA. Energy metabolism in astrocytes: high rate of oxidative metabolism and spatiotemporal dependence on glycolysis/glycogenolysis. J Cereb Blood Flow Metab. 2007;27(2):219–249. doi: 10.1038/sj.jcbfm.9600343. [DOI] [PubMed] [Google Scholar]
- 5.Sibson NR, Mason GF, Shen J, Cline GW, Herskovits AZ, Wall JE, Behar KL, Rothman DL, Shulman RG. In vivo (13)C NMR measurement of neurotransmitter glutamate cycling, anaplerosis and TCA cycle flux in rat brain during. J Neurochem. 2001;76(4):975–989. doi: 10.1046/j.1471-4159.2001.00074.x. [DOI] [PubMed] [Google Scholar]
- 6.Yu AC, Drejer J, Hertz L, Schousboe A. Pyruvate carboxylase activity in primary cultures of astrocytes and neurons. J Neurochem. 1983;41(5):1484–1487. doi: 10.1111/j.1471-4159.1983.tb00849.x. [DOI] [PubMed] [Google Scholar]
- 7.Rothman DL, Behar KL, Hyder F, Shulman RG. In vivo NMR studies of the glutamate neurotransmitter flux and neuroenergetics: implications for brain function. Annu Rev Physiol. 2003;65:401–427. doi: 10.1146/annurev.physiol.65.092101.142131. [DOI] [PubMed] [Google Scholar]
- 8.Mason GF, Rothman DL. Graded image segmentation of brain tissue in the presence of inhomogeneous radio frequency fields. Magnetic resonance imaging. 2002;20(5):431–436. doi: 10.1016/s0730-725x(02)00510-6. [DOI] [PubMed] [Google Scholar]
- 9.Boumezbeur F, Besret L, Valette J, Gregoire M-C, Delzescaux T, Maroy R, Vaufrey F, Gervais P, Hantraye P, Bloch G, Lebon V. Glycolysis versus TCA cycle in the primate brain as measured by combining 18F-FDG PET and 13C-NMR. J Cereb Blood Flow Metab. 2005;25(11):1418–1423. doi: 10.1038/sj.jcbfm.9600145. [DOI] [PubMed] [Google Scholar]
- 10.Chaumeil MM, Valette J, Guillermier M, Brouillet E, Boumezbeur F, Herard A-S, Bloch G, Hantraye P, Lebon V. Multimodal neuroimaging provides a highly consistent picture of energy metabolism, validating 31P MRS for measuring brain ATP synthesis. Proc Natl Acad Sci USA. 2009;106(10):3988–3993. doi: 10.1073/pnas.0806516106. [DOI] [PMC free article] [PubMed] [Google Scholar]
- 11.Hyder F, Patel AB, Gjedde A, Rothman DL, Behar KL, Shulman RG. Neuronal-glial glucose oxidation and glutamatergic-GABAergic function. J Cereb Blood Flow Metab. 2006;26(7):865–877. doi: 10.1038/sj.jcbfm.9600263. [DOI] [PubMed] [Google Scholar]
- 12.Van den Berg CJ, Krzalić L, Mela P, Waelsch H. Compartmentation of glutamate metabolism in brain. Evidence for the existence of two different tricarboxylic acid cycles in brain. Biochem J. 1969;113(2):281–290. doi: 10.1042/bj1130281. [DOI] [PMC free article] [PubMed] [Google Scholar]
- 13.Hertz L. Functional interactions between neurons and astrocytes I. Turnover and metabolism of putative amino acid transmitters. Prog Neurobiol. 1979;13(3):277–323. doi: 10.1016/0301-0082(79)90018-2. [DOI] [PubMed] [Google Scholar]
- 14.Maycox PR, Hell JW, Jahn R. Amino acid neurotransmission: spotlight on synaptic vesicles. Trends Neurosci. 1990;13(3):83–87. doi: 10.1016/0166-2236(90)90178-d. [DOI] [PubMed] [Google Scholar]
- 15.Nicholls D, Attwell D. The release and uptake of excitatory amino acids. Trends Pharmacol Sci. 1990;11(11):462–468. doi: 10.1016/0165-6147(90)90129-v. [DOI] [PubMed] [Google Scholar]
- 16.Gruetter R, Novotny EJ, Boulware SD, Mason GF, Rothman DL, Shulman GI, Prichard JW, Shulman RG. Localized 13C NMR spectroscopy in the human brain of amino acid labeling from D-[1-13C]glucose. J Neurochem. 1994;63(4):1377–1385. doi: 10.1046/j.1471-4159.1994.63041377.x. [DOI] [PubMed] [Google Scholar]
- 17.Cooper AJ, Plum F. Biochemistry and physiology of brain ammonia. Physiol Rev. 1987;67(2):440–519. doi: 10.1152/physrev.1987.67.2.440. [DOI] [PubMed] [Google Scholar]
- 18.Sibson NR, Dhankhar A, Mason GF, Behar KL, Rothman DL, Shulman RG. In vivo 13C NMR measurements of cerebral glutamine synthesis as evidence for glutamate-glutamine cycling. Proc Natl Acad Sci USA. 1997;94(6):2699–2704. doi: 10.1073/pnas.94.6.2699. [DOI] [PMC free article] [PubMed] [Google Scholar]
- 19.Lieth E, LaNoue KF, Berkich DA, Xu B, Ratz M, Taylor C, Hutson SM. Nitrogen shuttling between neurons and glial cells during glutamate synthesis. J Neurochem. 2001;76(6):1712–1723. doi: 10.1046/j.1471-4159.2001.00156.x. [DOI] [PubMed] [Google Scholar]
- 20.Oz G, Berkich DA, Henry PG, Xu Y, LaNoue K, Hutson SM, Gruetter R. Neuroglial metabolism in the awake rat brain: CO2 fixation increases with brain activity. J Neurosci. 2004;24(50):11273–11279. doi: 10.1523/JNEUROSCI.3564-04.2004. [DOI] [PMC free article] [PubMed] [Google Scholar]
- 21.Shen J, Sibson NR, Cline G, Behar KL, Rothman DL, Shulman RG. 15N-NMR spectroscopy studies of ammonia transport and glutamine synthesis in the hyperammonemic rat brain. Dev Neurosci. 1998;20(4–5):434–443. doi: 10.1159/000017341. [DOI] [PubMed] [Google Scholar]
- 22.Patel AB, de Graaf RA, Mason GF, Rothman DL, Shulman RG, Behar KL. The contribution of GABA to glutamate/glutamine cycling and energy metabolism in the rat cortex in vivo. Proc Natl Acad Sci USA. 2005;102(15):5588–5593. doi: 10.1073/pnas.0501703102. [DOI] [PMC free article] [PubMed] [Google Scholar]
- 23.Kanamori K, Kondrat RW, Ross BD. 13C enrichment of extracellular neurotransmitter glutamate in rat brain--combined mass spectrometry and NMR studies of neurotransmitter turnover and uptake into glia in vivo. Cell Mol Biol (Noisy-le-grand) 2003;49(5):819–836. [PubMed] [Google Scholar]
- 24.Gruetter R, Seaquist ER, Ugurbil K. A mathematical model of compartmentalized neurotransmitter metabolism in the human brain. Am J Physiol Endocrinol Metab. 2001;281(1):E100–E112. doi: 10.1152/ajpendo.2001.281.1.E100. [DOI] [PubMed] [Google Scholar]
- 25.Lebon V, Petersen KF, Cline GW, Shen J, Mason GF, Dufour S, Behar KL, Shulman GI, Rothman DL. Astroglial contribution to brain energy metabolism in humans revealed by 13C nuclear magnetic resonance spectroscopy: elucidation of the dominant pathway for neurotransmitter glutamate repletion and measurement of astrocytic oxidative metabolism. J Neurosci. 2002;22(5):1523–1531. doi: 10.1523/JNEUROSCI.22-05-01523.2002. [DOI] [PMC free article] [PubMed] [Google Scholar]
- 26.Mason GF, Petersen KF, de Graaf RA, Shulman GI, Rothman DL. Measurements of the anaplerotic rate in the human cerebral cortex using 13C magnetic resonance spectroscopy and [1-13C] and [2-13C] glucose. J Neurochem. 2007;100(1):73–86. doi: 10.1111/j.1471-4159.2006.04200.x. [DOI] [PMC free article] [PubMed] [Google Scholar]
- 27.Shen J, Petersen KF, Behar KL, Brown P, Nixon TW, Mason GF, Petroff OA, Shulman GI, Shulman RG, Rothman DL. Determination of the rate of the glutamate/glutamine cycle in the human brain by in vivo 13C NMR. Proc Natl Acad Sci USA. 1999;96(14):8235–8240. doi: 10.1073/pnas.96.14.8235. [DOI] [PMC free article] [PubMed] [Google Scholar]
- 28.Sibson NR, Dhankhar A, Mason GF, Rothman DL, Behar KL, Shulman RG. Stoichiometric coupling of brain glucose metabolism and glutamatergic neuronal activity. Proc Natl Acad Sci USA. 1998;95(1):316–321. doi: 10.1073/pnas.95.1.316. [DOI] [PMC free article] [PubMed] [Google Scholar]
- 29.Siesjo BK. Brain energy metabolism. Chichester;New York: Wiley; 1978. [Google Scholar]
- 30.Magistretti PJ, Pellerin L, Rothman DL, Shulman RG. Energy on demand. Science. 1999;283(5401):496–497. doi: 10.1126/science.283.5401.496. [DOI] [PubMed] [Google Scholar]
- 31.Shulman RG, Hyder F, Rothman DL. Cerebral energetics and the glycogen shunt: neurochemical basis of functional imaging. Proc Natl Acad Sci USA. 2001;98(11):6417–6422. doi: 10.1073/pnas.101129298. [DOI] [PMC free article] [PubMed] [Google Scholar]
- 32.Jolivet R, Magistretti PJ, Weber B. Deciphering neuron-glia compartmentalization in cortical energy metabolism. Front Neuroenergetics. 2009;1:4. doi: 10.3389/neuro.14.004.2009. [DOI] [PMC free article] [PubMed] [Google Scholar]
- 33.Occhipinti R, Somersalo E, Calvetti D. Astrocytes as the glucose shunt for glutamatergic neurons at high activity: an in silico study. J Neurophysiol. 2009;101(5):2528–2538. doi: 10.1152/jn.90377.2008. [DOI] [PMC free article] [PubMed] [Google Scholar]
- 34.Strelnikov K. Neuroimaging and neuroenergetics: brain activations as information-driven reorganization of energy flows. Brain Cogn. 2010;72(3):449–456. doi: 10.1016/j.bandc.2009.12.008. [DOI] [PubMed] [Google Scholar]
- 35.Attwell D, Laughlin SB. An energy budget for signaling in the grey matter of the brain. J Cereb Blood Flow Metab. 2001;21(10):1133–1145. doi: 10.1097/00004647-200110000-00001. [DOI] [PubMed] [Google Scholar]
- 36.Chowdhury GMI, Patel AB, Mason GF, Rothman DL, Behar KL. Glutamatergic and GABAergic neurotransmitter cycling and energy metabolism in rat cerebral cortex during postnatal development. J Cereb Blood Flow Metab. 2007;27(12):1895–1907. doi: 10.1038/sj.jcbfm.9600490. [DOI] [PubMed] [Google Scholar]
- 37.Hassel B, Bachelard H, Jones P, Fonnum F, Sonnewald U. Trafficking of amino acids between neurons and glia in vivo. Effects of inhibition of glial metabolism by fluoroacetate. J Cereb Blood Flow Metab. 1997;17(11):1230–1238. doi: 10.1097/00004647-199711000-00012. [DOI] [PubMed] [Google Scholar]
- 38.Patel AB, Chowdhury GMI, de Graaf RA, Rothman DL, Shulman RG, Behar KL. Cerebral pyruvate carboxylase flux is unaltered during bicuculline-seizures. J Neurosci Res. 2005;79(1–2):128–138. doi: 10.1002/jnr.20311. [DOI] [PubMed] [Google Scholar]
- 39.Serres S, Raffard G, Franconi J-M, Merle M. Close coupling between astrocytic and neuronal metabolisms to fulfill anaplerotic and energy needs in the rat brain. J Cereb Blood Flow Metab. 2008;28(4):712–724. doi: 10.1038/sj.jcbfm.9600568. [DOI] [PubMed] [Google Scholar]
- 40.Patel AB, de Graaf RA, Rothman DL, Behar KL, Mason GF. Evaluation of cerebral acetate transport and metabolic rates in the rat brain in vivo using 1H-[13C]-NMR. J Cereb Blood Flow Metab. 2010;30(6):1200–1213. doi: 10.1038/jcbfm.2010.2. [DOI] [PMC free article] [PubMed] [Google Scholar]
- 41.Boumezbeur F, Mason GF, de Graaf RA, Behar KL, Cline GW, Shulman GI, Rothman DL, Petersen KF. Altered brain mitochondrial metabolism in healthy aging as assessed by in vivo magnetic resonance spectroscopy. J Cereb Blood Flow Metab. 2010;30(1):211–221. doi: 10.1038/jcbfm.2009.197. [DOI] [PMC free article] [PubMed] [Google Scholar]
- 42.Maciejewski PK, Rothman DL. Proposed cycles for functional glutamate trafficking in synaptic neurotransmission. Neurochem Int. 2008;52(4–5):809–825. doi: 10.1016/j.neuint.2007.09.015. [DOI] [PMC free article] [PubMed] [Google Scholar]
- 43.DiNuzzo M, Mangia S, Maraviglia B, Giove F. Changes in glucose uptake rather than lactate shuttle take center stage in subserving neuroenergetics: evidence from mathematical modeling. J Cereb Blood Flow Metab. 2010;30(3):586–602. doi: 10.1038/jcbfm.2009.232. [DOI] [PMC free article] [PubMed] [Google Scholar]
- 44.Shestov AA, Valette J, Uğurbil K, Henry P-G. On the reliability of (13)C metabolic modeling with two-compartment neuronal-glial models. J Neurosci Res. 2007;85(15):3294–3303. doi: 10.1002/jnr.21269. [DOI] [PubMed] [Google Scholar]
- 45.Mason GF, Gruetter R, Rothman DL, Behar KL, Shulman RG, Novotny EJ. Simultaneous determination of the rates of the TCA cycle, glucose utilization, alpha-ketoglutarate/glutamate exchange, and glutamine synthesis in human brain by NMR. J Cereb Blood Flow Metab. 1995;15(1):12–25. doi: 10.1038/jcbfm.1995.2. [DOI] [PubMed] [Google Scholar]
- 46.Yang J, Xu S, Shen J. Fast isotopic exchange between mitochondria and cytosol in brain revealed by relayed 13C magnetization transfer spectroscopy. J Cereb Blood Flow Metab. 2009;29(4):661–669. doi: 10.1038/jcbfm.2008.170. [DOI] [PMC free article] [PubMed] [Google Scholar]
- 47.Shen J, Rothman D, Behar K, Xu S. Determination of the glutamate-glutamine cycling flux using two-compartment dynamic metabolic modeling is sensitive to astroglial dilution. J Cereb Blood Flow Metab. 2008;29:108–118. doi: 10.1038/jcbfm.2008.102. [DOI] [PMC free article] [PubMed] [Google Scholar]
- 48.McKenna MC. The glutamate-glutamine cycle is not stoichiometric: fates of glutamate in brain. J Neurosci Res. 2007;85(15):3347–3358. doi: 10.1002/jnr.21444. [DOI] [PubMed] [Google Scholar]
- 49.Behar KL, Petroff OA, Prichard JW, Alger JR, Shulman RG. Detection of metabolites in rabbit brain by 13C NMR spectroscopy following administration of [1-13C]glucose. Magnetic resonance in medicine : official journal of the Society of Magnetic Resonance in Medicine / Society of Magnetic Resonance in Medicine. 1986;3(6):911–920. doi: 10.1002/mrm.1910030611. [DOI] [PubMed] [Google Scholar]
- 50.Fitzpatrick SM, Hetherington HP, Behar KL, Shulman RG. The flux from glucose to glutamate in the rat brain in vivo as determined by 1H-observed, 13C-edited NMR spectroscopy. J Cereb Blood Flow Metab. 1990;10(2):170–179. doi: 10.1038/jcbfm.1990.32. [DOI] [PubMed] [Google Scholar]
- 51.Rothman DL, Behar KL, Hetherington HP, den Hollander JA, Bendall MR, Petroff OA, Shulman RG. 1H-Observe/13C-decouple spectroscopic measurements of lactate and glutamate in the rat brain in vivo. Proc Natl Acad Sci USA. 1985;82(6):1633–1637. doi: 10.1073/pnas.82.6.1633. [DOI] [PMC free article] [PubMed] [Google Scholar]
- 52.Gruetter R. Automatic, localized in vivo adjustment of all first- and second-order shim coils. Magn Reson Med. 1993;29(6):804–811. doi: 10.1002/mrm.1910290613. [DOI] [PubMed] [Google Scholar]
- 53.Beckmann N, Turkalj I, Seelig J, Keller U. 13C NMR for the assessment of human brain glucose metabolism in vivo. Biochemistry. 1991;30(26):6362–6366. doi: 10.1021/bi00240a002. [DOI] [PubMed] [Google Scholar]
- 54.Gruetter R, Novotny EJ, Boulware SD, Rothman DL, Mason GF, Shulman GI, Shulman RG, Tamborlane WV. Direct measurement of brain glucose concentrations in humans by 13C NMR spectroscopy. Proc Natl Acad Sci USA. 1992;89(3):1109–1112. doi: 10.1073/pnas.89.3.1109. [DOI] [PMC free article] [PubMed] [Google Scholar]
- 55.Rothman DL, Novotny EJ, Shulman GI, Howseman AM, Petroff OA, Mason G, Nixon T, Hanstock CC, Prichard JW, Shulman RG. 1H-[13C] NMR measurements of [4-13C]glutamate turnover in human brain. Proc Natl Acad Sci USA. 1992;89(20):9603–9606. doi: 10.1073/pnas.89.20.9603. [DOI] [PMC free article] [PubMed] [Google Scholar]
- 56.Mason GF, Pan JW, Chu WJ, Newcomer BR, Zhang Y, Orr R, Hetherington HP. Measurement of the tricarboxylic acid cycle rate in human grey and white matter in vivo by 1H-[13C] magnetic resonance spectroscopy at 4.1T. J Cereb Blood Flow Metab. 1999;19(11):1179–1188. doi: 10.1097/00004647-199911000-00002. [DOI] [PubMed] [Google Scholar]
- 57.Pan JW, Stein DT, Telang F, Lee JH, Shen J, Brown P, Cline G, Mason GF, Shulman GI, Rothman DL, Hetherington HP. Spectroscopic imaging of glutamate C4 turnover in human brain. Magnetic resonance in medicine : official journal of the Society of Magnetic Resonance in Medicine / Society of Magnetic Resonance in Medicine. 2000;44(5):673–679. doi: 10.1002/1522-2594(200011)44:5<673::aid-mrm3>3.0.co;2-l. [DOI] [PubMed] [Google Scholar]
- 58.Gruetter R, Seaquist ER, Kim S, Ugurbil K. Localized in vivo 13C-NMR of glutamate metabolism in the human brain: initial results at 4 tesla. Dev Neurosci. 1998;20(4–5):380–388. doi: 10.1159/000017334. [DOI] [PubMed] [Google Scholar]
- 59.van Eijsden P, Behar KL, Mason GF, Braun KPJ, de Graaf RA. In vivo neurochemical profiling of rat brain by 1H-[13C] NMR spectroscopy: cerebral energetics and glutamatergic/GABAergic neurotransmission. J Neurochem. 2010;112(1):24–33. doi: 10.1111/j.1471-4159.2009.06428.x. [DOI] [PMC free article] [PubMed] [Google Scholar]
- 60.Shulman RG, Rothman DL. Interpreting functional imaging studies in terms of neurotransmitter cycling. Proc Natl Acad Sci USA. 1998;95(20):11993–11998. doi: 10.1073/pnas.95.20.11993. [DOI] [PMC free article] [PubMed] [Google Scholar]
- 61.Raichle ME. A paradigm shift in functional brain imaging. J Neurosci. 2009;29(41):12729–12734. doi: 10.1523/JNEUROSCI.4366-09.2009. [DOI] [PMC free article] [PubMed] [Google Scholar]
- 62.Owen OE, Morgan AP, Kemp HG, Sullivan JM, Herrera MG, Cahill GF. Brain metabolism during fasting. J Clin Invest. 1967;46(10):1589–1595. doi: 10.1172/JCI105650. [DOI] [PMC free article] [PubMed] [Google Scholar]
- 63.van Hall G, Strømstad M, Rasmussen P, Jans O, Zaar M, Gam C, Quistorff B, Secher NH, Nielsen HB. Blood lactate is an important energy source for the human brain. J Cereb Blood Flow Metab. 2009;29(6):1121–1129. doi: 10.1038/jcbfm.2009.35. [DOI] [PubMed] [Google Scholar]
- 64.Smith D, Pernet A, Hallett WA, Bingham E, Marsden PK, Amiel SA. Lactate: a preferred fuel for human brain metabolism in vivo. J Cereb Blood Flow Metab. 2003;23(6):658–664. doi: 10.1097/01.WCB.0000063991.19746.11. [DOI] [PubMed] [Google Scholar]
- 65.Gruetter R, Novotny EJ, Boulware SD, Rothman DL, Shulman RG. 1H NMR studies of glucose transport in the human brain. J Cereb Blood Flow Metab. 1996;16(3):427–438. doi: 10.1097/00004647-199605000-00009. [DOI] [PubMed] [Google Scholar]
- 66.Blomqvist G, Gjedde A, Gutniak M, Grill V, Widén L, Stone-Elander S, Hellstrand E. Facilitated transport of glucose from blood to brain in man and the effect of moderate hypoglycaemia on cerebral glucose utilization. Eur J Nucl Med. 1991;18(10):834–837. doi: 10.1007/BF00175064. [DOI] [PubMed] [Google Scholar]
- 67.Heiss WD, Pawlik G, Herholz K, Wagner R, Göldner H, Wienhard K. Regional kinetic constants and cerebral metabolic rate for glucose in normal human volunteers determined by dynamic positron emission tomography of [18F]-2-fluoro-2-deoxy-D-glucose. J Cereb Blood Flow Metab. 1984;4(2):212–223. doi: 10.1038/jcbfm.1984.30. [DOI] [PubMed] [Google Scholar]
- 68.de Graaf RA, Pan JW, Telang F, Lee JH, Brown P, Novotny EJ, Hetherington HP, Rothman DL. Differentiation of glucose transport in human brain gray and white matter. J Cereb Blood Flow Metab. 2001;21(5):483–492. doi: 10.1097/00004647-200105000-00002. [DOI] [PubMed] [Google Scholar]
- 69.Gruetter R, Ugurbil K, Seaquist ER. Steady-state cerebral glucose concentrations and transport in the human brain. J Neurochem. 1998;70(1):397–408. doi: 10.1046/j.1471-4159.1998.70010397.x. [DOI] [PubMed] [Google Scholar]
- 70.Simpson IA, Carruthers A, Vannucci SJ. Supply and demand in cerebral energy metabolism: the role of nutrient transporters. J Cereb Blood Flow Metab. 2007;27(11):1766–1791. doi: 10.1038/sj.jcbfm.9600521. [DOI] [PMC free article] [PubMed] [Google Scholar]
- 71.Badar-Goffer RS, Bachelard HS, Morris PG. Cerebral metabolism of acetate and glucose studied by 13C-n.m.r. spectroscopy. A technique for investigating metabolic compartmentation in the brain. Biochem J. 1990;266(1):133–139. doi: 10.1042/bj2660133. [DOI] [PMC free article] [PubMed] [Google Scholar]
- 72.Cerdán S, Künnecke B, Seelig J. Cerebral metabolism of [1,2-13C2]acetate as detected by in vivo and in vitro 13C NMR. J Biol Chem. 1990;265(22):12916–12926. [PubMed] [Google Scholar]
- 73.Künnecke B, Cerdan S. Multilabeled 13C substrates as probes in in vivo 13C and 1H NMR spectroscopy. NMR in biomedicine. 1989;2(5–6):274–277. doi: 10.1002/nbm.1940020516. [DOI] [PubMed] [Google Scholar]
- 74.Waniewski RA, Martin DL. Preferential utilization of acetate by astrocytes is attributable to transport. J Neurosci. 1998;18(14):5225–5233. doi: 10.1523/JNEUROSCI.18-14-05225.1998. [DOI] [PMC free article] [PubMed] [Google Scholar]
- 75.Blüml S, Moreno-Torres A, Shic F, Nguy C-H, Ross BD. Tricarboxylic acid cycle of glia in the in vivo human brain. NMR in biomedicine. 2002;15(1):1–5. doi: 10.1002/nbm.725. [DOI] [PubMed] [Google Scholar]
- 76.Mason GF, Petersen KF, Lebon V, Rothman DL, Shulman GI. Increased brain monocarboxylic acid transport and utilization in type 1 diabetes. Diabetes. 2006;55(4):929–934. doi: 10.2337/diabetes.55.04.06.db05-1325. [DOI] [PMC free article] [PubMed] [Google Scholar]
- 77.Pan JW, de Graaf RA, Petersen KF, Shulman GI, Hetherington HP, Rothman DL. [2,4-13 C2 ]-beta-Hydroxybutyrate metabolism in human brain. J Cereb Blood Flow Metab. 2002;22(7):890–898. doi: 10.1097/00004647-200207000-00014. [DOI] [PMC free article] [PubMed] [Google Scholar]
- 78.Boumezbeur F, Petersen KF, Cline GW, Mason GF, Behar KL, Shulman GI, Rothman DL. The contribution of blood lactate to brain energy metabolism in humans measured by dynamic 13C nuclear magnetic resonance spectroscopy. J Neurosci. 2010;30(42):13983–13991. doi: 10.1523/JNEUROSCI.2040-10.2010. [DOI] [PMC free article] [PubMed] [Google Scholar]
- 79.de Graaf RA. In vivo NMR spectroscopy. Principles and Techniques. Wiley; 2007. [Google Scholar]
- 80.Fox PT, Raichle ME, Mintun MA, Dence C. Nonoxidative glucose consumption during focal physiologic neural activity. Science. 1988;241(4864):462–464. doi: 10.1126/science.3260686. [DOI] [PubMed] [Google Scholar]
- 81.Dienel GA, Hertz L. Glucose and lactate metabolism during brain activation. J Neurosci Res. 2001;66(5):824–838. doi: 10.1002/jnr.10079. [DOI] [PubMed] [Google Scholar]
- 82.Mangia S, Tkác I, Gruetter R, Van De Moortele P-F, Maraviglia B, Uğurbil K. Sustained neuronal activation raises oxidative metabolism to a new steady-state level: evidence from 1H NMR spectroscopy in the human visual cortex. J Cereb Blood Flow Metab. 2007;27(5):1055–1063. doi: 10.1038/sj.jcbfm.9600401. [DOI] [PubMed] [Google Scholar]
- 83.Prichard J, Rothman D, Novotny E, Petroff O, Kuwabara T, Avison M, Howseman A, Hanstock C, Shulman R. Lactate rise detected by 1H NMR in human visual cortex during physiologic stimulation. Proc Natl Acad Sci USA. 1991;88(13):5829–5831. doi: 10.1073/pnas.88.13.5829. [DOI] [PMC free article] [PubMed] [Google Scholar]
- 84.Chen W, Zhu XH, Gruetter R, Seaquist ER, Adriany G, Ugurbil K. Study of tricarboxylic acid cycle flux changes in human visual cortex during hemifield visual stimulation using (1)H-[(13)C] MRS and fMRI. Magnetic resonance in medicine : official journal of the Society of Magnetic Resonance in Medicine / Society of Magnetic Resonance in Medicine. 2001;45(3):349–355. doi: 10.1002/1522-2594(200103)45:3<349::aid-mrm1045>3.0.co;2-8. [DOI] [PubMed] [Google Scholar]
- 85.Hoge RD, Atkinson J, Gill B, Crelier GR, Marrett S, Pike GB. Linear coupling between cerebral blood flow and oxygen consumption in activated human cortex. Proc Natl Acad Sci USA. 1999;96(16):9403–9408. doi: 10.1073/pnas.96.16.9403. [DOI] [PMC free article] [PubMed] [Google Scholar]
- 86.Kim SG, Rostrup E, Larsson HB, Ogawa S, Paulson OB. Determination of relative CMRO2 from CBF and BOLD changes: significant increase of oxygen consumption rate during visual stimulation. Magnetic resonance in medicine : official journal of the Society of Magnetic Resonance in Medicine / Society of Magnetic Resonance in Medicine. 1999;41(6):1152–1161. doi: 10.1002/(sici)1522-2594(199906)41:6<1152::aid-mrm11>3.0.co;2-t. [DOI] [PubMed] [Google Scholar]
- 87.Marrett S, Gjedde A. Changes of blood flow and oxygen consumption in visual cortex of living humans. Adv Exp Med Biol. 1997;413:205–208. doi: 10.1007/978-1-4899-0056-2_22. [DOI] [PubMed] [Google Scholar]
- 88.Haga KK, Khor YP, Farrall A, Wardlaw JM. A systematic review of brain metabolite changes, measured with 1H magnetic resonance spectroscopy, in healthy aging. Neurobiol Aging. 2009;30(3):353–363. doi: 10.1016/j.neurobiolaging.2007.07.005. [DOI] [PubMed] [Google Scholar]
- 89.Dager SR, Friedman SD, Parow A, Demopulos C, Stoll AL, Lyoo IK, Dunner DL, Renshaw PF. Brain metabolic alterations in medication-free patients with bipolar disorder. Arch Gen Psychiatry. 2004;61(5):450–458. doi: 10.1001/archpsyc.61.5.450. [DOI] [PubMed] [Google Scholar]
- 90.Sanacora G, Gueorguieva R, Epperson CN, Wu Y-T, Appel M, Rothman DL, Krystal JH, Mason GF. Subtype-specific alterations of gamma-aminobutyric acid and glutamate in patients with major depression. Arch Gen Psychiatry. 2004;61(7):705–713. doi: 10.1001/archpsyc.61.7.705. [DOI] [PubMed] [Google Scholar]
- 91.Gruber S, Frey R, Mlynárik V, Stadlbauer A, Heiden A, Kasper S, Kemp GJ, Moser E. Quantification of metabolic differences in the frontal brain of depressive patients and controls obtained by 1H-MRS at 3 Tesla. Invest Radiol. 2003;38(7):403–408. doi: 10.1097/01.rli.0000073446.43445.20. [DOI] [PubMed] [Google Scholar]
- 92.Epperson CN, Haga K, Mason GF, Sellers E, Gueorguieva R, Zhang W, Weiss E, Rothman DL, Krystal JH. Cortical gamma-aminobutyric acid levels across the menstrual cycle in healthy women and those with premenstrual dysphoric disorder: a proton magnetic resonance spectroscopy study. Arch Gen Psychiatry. 2002;59(9):851–858. doi: 10.1001/archpsyc.59.9.851. [DOI] [PubMed] [Google Scholar]
- 93.Goddard AW, Mason GF, Almai A, Rothman DL, Behar KL, Petroff OA, Charney DS, Krystal JH. Reductions in occipital cortex GABA levels in panic disorder detected with 1h-magnetic resonance spectroscopy. Arch Gen Psychiatry. 2001;58(6):556–561. doi: 10.1001/archpsyc.58.6.556. [DOI] [PubMed] [Google Scholar]
- 94.Hasler G, van der Veen JW, Tumonis T, Meyers N, Shen J, Drevets WC. Reduced prefrontal glutamate/glutamine and gamma-aminobutyric acid levels in major depression determined using proton magnetic resonance spectroscopy. Arch Gen Psychiatry. 2007;64(2):193–200. doi: 10.1001/archpsyc.64.2.193. [DOI] [PubMed] [Google Scholar]
- 95.Kuzniecky R, Ho S, Pan J, Martin R, Gilliam F, Faught E, Hetherington H. Modulation of cerebral GABA by topiramate, lamotrigine, and gabapentin in healthy adults. Neurology. 2002;58(3):368–372. doi: 10.1212/wnl.58.3.368. [DOI] [PubMed] [Google Scholar]
- 96.Novotny EJ, Hyder F, Shevell M, Rothman DL. GABA changes with vigabatrin in the developing human brain. Epilepsia. 1999;40(4):462–466. doi: 10.1111/j.1528-1157.1999.tb00741.x. [DOI] [PubMed] [Google Scholar]
- 97.Petroff OA, Mattson RH, Rothman DL. Proton MRS: GABA and glutamate. Adv Neurol. 2000;83:261–271. [PubMed] [Google Scholar]
- 98.Novotny EJ, Fulbright RK, Pearl PL, Gibson KM, Rothman DL. Magnetic resonance spectroscopy of neurotransmitters in human brain. Ann Neurol. 2003;54(Suppl 6):S25–S31. doi: 10.1002/ana.10697. [DOI] [PubMed] [Google Scholar]
- 99.Ross BD, Jacobson S, Villamil F, Korula J, Kreis R, Ernst T, Shonk T, Moats RA. Subclinical hepatic encephalopathy: proton MR spectroscopic abnormalities. Radiology. 1994;193(2):457–463. doi: 10.1148/radiology.193.2.7972763. [DOI] [PubMed] [Google Scholar]
- 100.Martin WRW. MR spectroscopy in neurodegenerative disease. Mol Imaging Biol. 2007;9(4):196–203. doi: 10.1007/s11307-007-0087-2. [DOI] [PubMed] [Google Scholar]
- 101.Ross B, Lin A, Harris K, Bhattacharya P, Schweinsburg B. Clinical experience with 13C MRS in vivo. NMR in biomedicine. 2003;16(6–7):358–369. doi: 10.1002/nbm.852. [DOI] [PubMed] [Google Scholar]
- 102.Novotny EJ, Ogino T, Rothman DL, Petroff OA, Prichard JW, Shulman RG. Direct carbon versus proton heteronuclear editing of 2-13C ethanol in rabbit brain in vivo: a sensitivity comparison. Magnetic resonance in medicine : official journal of the Society of Magnetic Resonance in Medicine / Society of Magnetic Resonance in Medicine. 1990;16(3):431–443. doi: 10.1002/mrm.1910160310. [DOI] [PubMed] [Google Scholar]
- 103.Rothman DL, Howseman AM, Graham GD, Petroff OA, Lantos G, Fayad PB, Brass LM, Shulman GI, Shulman RG, Prichard JW. Localized proton NMR observation of [3-13C]lactate in stroke after [1-13C]glucose infusion. Magnetic resonance in medicine : official journal of the Society of Magnetic Resonance in Medicine / Society of Magnetic Resonance in Medicine. 1991;21(2):302–307. doi: 10.1002/mrm.1910210215. [DOI] [PubMed] [Google Scholar]
- 104.Petroff OA, Graham GD, Blamire AM, al-Rayess M, Rothman DL, Fayad PB, Brass LM, Shulman RG, Prichard JW. Spectroscopic imaging of stroke in humans: histopathology correlates of spectral changes. Neurology. 1992;42(7):1349–1354. doi: 10.1212/wnl.42.7.1349. [DOI] [PubMed] [Google Scholar]
- 105.Terpstra M, Gruetter R, High WB, Mescher M, DelaBarre L, Merkle H, Garwood M. Lactate turnover in rat glioma measured by in vivo nuclear magnetic resonance spectroscopy. Cancer Res. 1998;58(22):5083–5088. [PubMed] [Google Scholar]
- 106.Wijnen JP, van der Graaf M, Scheenen TWJ, Klomp DWJ, de Galan BE, Idema AJS, Heerschap A. In vivo 13C magnetic resonance spectroscopy of a human brain tumor after application of 13C-1-enriched glucose. Magnetic resonance imaging. 2010;28(5):690–697. doi: 10.1016/j.mri.2010.03.006. [DOI] [PubMed] [Google Scholar]
- 107.Butterworth RF. Portal-systemic encephalopathy: a disorder of neuron-astrocytic metabolic trafficking. Dev Neurosci. 1993;15(3–5):313–319. doi: 10.1159/000111350. [DOI] [PubMed] [Google Scholar]
- 108.Behar KL, Rothman DL, Petersen KF, Hooten M, Delaney R, Petroff OA, Shulman GI, Navarro V, Petrakis IL, Charney DS, Krystal JH. Preliminary evidence of low cortical GABA levels in localized 1H-MR spectra of alcohol-dependent and hepatic encephalopathy patients. The American journal of psychiatry. 1999;156(6):952–954. doi: 10.1176/ajp.156.6.952. [DOI] [PubMed] [Google Scholar]
- 109.Fitzpatrick SM, Hetherington HP, Behar KL, Shulman RG. Effects of acute hyperammonemia on cerebral amino acid metabolism and pHi in vivo, measured by 1H and 31P nuclear magnetic resonance. J Neurochem. 1989;52(3):741–749. doi: 10.1111/j.1471-4159.1989.tb02517.x. [DOI] [PubMed] [Google Scholar]
- 110.Kanamori K, Ross BD. Glial alkalinization detected in vivo by 1H-15N heteronuclear multiple-quantum coherence-transfer NMR in severely hyperammonemic rat. J Neurochem. 1997;68(3):1209–1220. doi: 10.1046/j.1471-4159.1997.68031209.x. [DOI] [PubMed] [Google Scholar]
- 111.Behar KL, Fitzpatrick SM. In: Effects of hypercarbia and porta-caval shunting on amino acids and high energy phosphates of the rat brain: a 1H and 31P NMR study. GP BRaL, editor. Clifton, NJ: Humana Press; 1989. pp. 189–200. [Google Scholar]
- 112.Fitzpatrick SM, Behar KL, Shulman RG. In: In vivo NMR spectroscopy studies of cerebral metabolism in rats after portal-caval shunting. GP BRaL, editor. Clifton, NJ: 1989. pp. 177–187. [Google Scholar]
- 113.Blüml S, Moreno-Torres A, Ross BD. [1-13C]glucose MRS in chronic hepatic encephalopathy in man. Magnetic resonance in medicine : official journal of the Society of Magnetic Resonance in Medicine / Society of Magnetic Resonance in Medicine. 2001;45(6):981–993. doi: 10.1002/mrm.1131. [DOI] [PubMed] [Google Scholar]
- 114.Gropman AL, Sailasuta N, Harris KC, Abulseoud O, Ross BD. Ornithine transcarbamylase deficiency with persistent abnormality in cerebral glutamate metabolism in adults. Radiology. 2009;252(3):833–841. doi: 10.1148/radiol.2523081878. [DOI] [PMC free article] [PubMed] [Google Scholar]
- 115.Lin MT, Beal MF. Mitochondrial dysfunction and oxidative stress in neurodegenerative diseases. Nature. 2006;443(7113):787–795. doi: 10.1038/nature05292. [DOI] [PubMed] [Google Scholar]
- 116.Kalpouzos G, Chételat G, Baron J-C, Landeau B, Mevel K, Godeau C, Barré L, Constans J-M, Viader F, Eustache F, Desgranges B. Voxel-based mapping of brain gray matter volume and glucose metabolism profiles in normal aging. Neurobiol Aging. 2009;30(1):112–124. doi: 10.1016/j.neurobiolaging.2007.05.019. [DOI] [PubMed] [Google Scholar]
- 117.Rapoport SI. Functional brain imaging in the resting state and during activation in Alzheimer's disease. Implications for disease mechanisms involving oxidative phosphorylation. Ann N Y Acad Sci. 1999;893:138–153. doi: 10.1111/j.1749-6632.1999.tb07823.x. [DOI] [PubMed] [Google Scholar]
- 118.Lin AP, Shic F, Enriquez C, Ross BD. Reduced glutamate neurotransmission in patients with Alzheimer's disease -- an in vivo (13)C magnetic resonance spectroscopy study. MAGMA. 2003;16(1):29–42. doi: 10.1007/s10334-003-0004-x. [DOI] [PubMed] [Google Scholar]
- 119.Cryer PE. Diverse causes of hypoglycemia-associated autonomic failure in diabetes. N Engl J Med. 2004;350(22):2272–2279. doi: 10.1056/NEJMra031354. [DOI] [PubMed] [Google Scholar]
- 120.Cryer PE. Banting Lecture. Hypoglycemia: the limiting factor in the management of IDDM. Diabetes. 1994;43(11):1378–1389. doi: 10.2337/diab.43.11.1378. [DOI] [PubMed] [Google Scholar]
- 121.Oz G, Kumar A, Rao JP, Kodl CT, Chow L, Eberly LE, Seaquist ER. Human brain glycogen metabolism during and after hypoglycemia. Diabetes. 2009;58(9):1978–1985. doi: 10.2337/db09-0226. [DOI] [PMC free article] [PubMed] [Google Scholar]
- 122.Pan JW, Williamson A, Cavus I, Hetherington HP, Zaveri H, Petroff OAC, Spencer DD. Neurometabolism in human epilepsy. Epilepsia. 2008;49(Suppl 3):31–41. doi: 10.1111/j.1528-1167.2008.01508.x. [DOI] [PMC free article] [PubMed] [Google Scholar]
- 123.Cavus I, Kasoff WS, Cassaday MP, Jacob R, Gueorguieva R, Sherwin RS, Krystal JH, Spencer DD, Abi-Saab WM. Extracellular metabolites in the cortex and hippocampus of epileptic patients. Ann Neurol. 2005;57(2):226–235. doi: 10.1002/ana.20380. [DOI] [PubMed] [Google Scholar]
- 124.Petroff OAC, Errante LD, Rothman DL, Kim JH, Spencer DD. Glutamate-glutamine cycling in the epileptic human hippocampus. Epilepsia. 2002;43(7):703–710. doi: 10.1046/j.1528-1157.2002.38901.x. [DOI] [PubMed] [Google Scholar]
- 125.Eid T, Thomas MJ, Spencer DD, Rundén-Pran E, Lai JCK, Malthankar GV, Kim JH, Danbolt NC, Ottersen OP, de Lanerolle NC. Loss of glutamine synthetase in the human epileptogenic hippocampus: possible mechanism for raised extracellular glutamate in mesial temporal lobe epilepsy. Lancet. 2004;363(9402):28–37. doi: 10.1016/s0140-6736(03)15166-5. [DOI] [PubMed] [Google Scholar]
- 126.Blüml S, Moreno A, Hwang JH, Ross BD. 1-(13)C glucose magnetic resonance spectroscopy of pediatric and adult brain disorders. NMR in biomedicine. 2001;14(1):19–32. doi: 10.1002/nbm.679. [DOI] [PubMed] [Google Scholar]
- 127.de Graaf RA, Mason GF, Patel AB, Rothman DL, Behar KL. Regional glucose metabolism and glutamatergic neurotransmission in rat brain in vivo. Proc Natl Acad Sci USA. 2004;101(34):12700–12705. doi: 10.1073/pnas.0405065101. [DOI] [PMC free article] [PubMed] [Google Scholar]
- 128.Pfeuffer J, Tkác I, Choi IY, Merkle H, Ugurbil K, Garwood M, Gruetter R. Localized in vivo 1H NMR detection of neurotransmitter labeling in rat brain during infusion of [1-13C] D-glucose. Magnetic resonance in medicine : official journal of the Society of Magnetic Resonance in Medicine / Society of Magnetic Resonance in Medicine. 1999;41(6):1077–1083. doi: 10.1002/(sici)1522-2594(199906)41:6<1077::aid-mrm1>3.0.co;2-#. [DOI] [PubMed] [Google Scholar]
- 129.Cudalbu C, Comment A, Kurdzesau F, van Heeswijk RB, Uffmann K, Jannin S, Denisov V, Kirik D, Gruetter R. Feasibility of in vivo 15N MRS detection of hyperpolarized 15N labeled choline in rats. Phys Chem Chem Phys. 2010;12(22):5818–5823. doi: 10.1039/c002309b. [DOI] [PubMed] [Google Scholar]
- 130.Marjańska M, Iltis I, Shestov AA, Deelchand DK, Nelson C, Uğurbil K, Henry P-G. In vivo 13C spectroscopy in the rat brain using hyperpolarized [1-(13)C]pyruvate and [2-(13)C]pyruvate. J Magn Reson. 2010;206(2):210–218. doi: 10.1016/j.jmr.2010.07.006. [DOI] [PMC free article] [PubMed] [Google Scholar]
- 131.Bhattacharya P, Chekmenev EY, Perman WH, Harris KC, Lin AP, Norton VA, Tan CT, Ross BD, Weitekamp DP. Towards hyperpolarized (13)C-succinate imaging of brain cancer. J Magn Reson. 2007;186(1):150–155. doi: 10.1016/j.jmr.2007.01.017. [DOI] [PMC free article] [PubMed] [Google Scholar]
- 132.Hetherington HP, Chu W-J, Gonen O, Pan JW. Robust fully automated shimming of the human brain for high-field 1H spectroscopic imaging. Magnetic resonance in medicine : official journal of the Society of Magnetic Resonance in Medicine / Society of Magnetic Resonance in Medicine. 2006;56(1):26–33. doi: 10.1002/mrm.20941. [DOI] [PubMed] [Google Scholar]
- 133.Juchem C, Nixon TW, McIntyre S, Rothman DL, de Graaf RA. Magnetic field homogenization of the human prefrontal cortex with a set of localized electrical coils. Magnetic resonance in medicine : official journal of the Society of Magnetic Resonance in Medicine / Society of Magnetic Resonance in Medicine. 2010;63(1):171–180. doi: 10.1002/mrm.22164. [DOI] [PMC free article] [PubMed] [Google Scholar]
- 134.Koch KM, Sacolick LI, Nixon TW, McIntyre S, Rothman DL, de Graaf RA. Dynamically shimmed multivoxel 1H magnetic resonance spectroscopy and multislice magnetic resonance spectroscopic imaging of the human brain. Magnetic resonance in medicine : official journal of the Society of Magnetic Resonance in Medicine / Society of Magnetic Resonance in Medicine. 2007;57(3):587–591. doi: 10.1002/mrm.21141. [DOI] [PubMed] [Google Scholar]
- 135.de Graaf RA. Theoretical and experimental evaluation of broadband decoupling techniques for in vivo nuclear magnetic resonance spectroscopy. Magnetic resonance in medicine : official journal of the Society of Magnetic Resonance in Medicine / Society of Magnetic Resonance in Medicine. 2005;53(6):1297–1306. doi: 10.1002/mrm.20507. [DOI] [PubMed] [Google Scholar]
- 136.Collins CM, Liu W, Wang J, Gruetter R, Vaughan JT, Ugurbil K, Smith MB. Temperature and SAR calculations for a human head within volume and surface coils at 64 and 300 MHz. Journal of magnetic resonance imaging :JMRI. 2004;19(5):650–656. doi: 10.1002/jmri.20041. [DOI] [PubMed] [Google Scholar]
- 137.Adriany G, Gruetter R. A half-volume coil for efficient proton decoupling in humans at 4 tesla. J Magn Reson. 1997;125(1):178–184. doi: 10.1006/jmre.1997.1113. [DOI] [PubMed] [Google Scholar]
- 138.Klomp DWJ, Renema WKJ, van der Graaf M, de Galan BE, Kentgens APM, Heerschap A. Sensitivity-enhanced 13C MR spectroscopy of the human brain at 3 Tesla. Magnetic resonance in medicine : official journal of the Society of Magnetic Resonance in Medicine / Society of Magnetic Resonance in Medicine. 2006;55(2):271–278. doi: 10.1002/mrm.20745. [DOI] [PubMed] [Google Scholar]
- 139.Li S, Yang J, Shen J. Novel strategy for cerebral 13C MRS using very low RF power for proton decoupling. Magnetic resonance in medicine : official journal of the Society of Magnetic Resonance in Medicine / Society of Magnetic Resonance in Medicine. 2007;57(2):265–271. doi: 10.1002/mrm.21148. [DOI] [PubMed] [Google Scholar]
- 140.Sailasuta N, Abulseoud O, Harris KC, Ross BD. Glial dysfunction in abstinent methamphetamine abusers. J Cereb Blood Flow Metab. 2010;30(5):950–960. doi: 10.1038/jcbfm.2009.261. [DOI] [PMC free article] [PubMed] [Google Scholar]
- 141.Li S, Zhang Y, Wang S, Yang J, Ferraris Araneta M, Farris A, Johnson C, Fox S, Innis R, Shen J. In vivo 13C magnetic resonance spectroscopy of human brain on a clinical 3 T scanner using [2-13C]glucose infusion and low-power stochastic decoupling. Magnetic resonance in medicine : official journal of the Society of Magnetic Resonance in Medicine / Society of Magnetic Resonance in Medicine. 2009;62(3):565–573. doi: 10.1002/mrm.22044. [DOI] [PMC free article] [PubMed] [Google Scholar]
- 142.Li S, Zhang Y, Wang S, Araneta MF, Johnson CS, Xiang Y, Innis RB, Shen J. 13C MRS of occipital and frontal lobes at 3 T using a volume coil for stochastic proton decoupling. NMR in biomedicine. 2010;23(8):977–985. doi: 10.1002/nbm.1524. [DOI] [PMC free article] [PubMed] [Google Scholar]
- 143.Mason GF, Rothman DL. Basic principles of metabolic modeling of NMR (13)C isotopic turnover to determine rates of brain metabolism in vivo. Metab Eng. 2004;6(1):75–84. doi: 10.1016/j.ymben.2003.10.003. [DOI] [PubMed] [Google Scholar]
- 144.Moreno A, Blüml S, Hwang JH, Ross BD. Alternative 1-(13)C glucose infusion protocols for clinical (13)C MRS examinations of the brain. Magnetic resonance in medicine : official journal of the Society of Magnetic Resonance in Medicine / Society of Magnetic Resonance in Medicine. 2001;46(1):39–48. doi: 10.1002/mrm.1158. [DOI] [PubMed] [Google Scholar]
- 145.Mason GF, Falk Petersen K, de Graaf RA, Kanamatsu T, Otsuki T, Shulman GI, Rothman DL. A comparison of (13)C NMR measurements of the rates of glutamine synthesis and the tricarboxylic acid cycle during oral and intravenous administration of [1-(13)C]glucose. Brain Res Brain Res Protoc. 2003;10(3):181–190. doi: 10.1016/s1385-299x(02)00217-9. [DOI] [PubMed] [Google Scholar]
- 146.van de Ven KCC, van der Graaf M, Tack CJJ, Klomp DWJ, Heerschap A, de Galan BE. Optimized [1-(13)C]glucose infusion protocol for 13C magnetic resonance spectroscopy at 3T of human brain glucose metabolism under euglycemic and hypoglycemic conditions. J Neurosci Methods. 2010;186(1):68–71. doi: 10.1016/j.jneumeth.2009.10.025. [DOI] [PMC free article] [PubMed] [Google Scholar]
- 147.Sailasuta N, Tran TT, Harris KC, Ross BD. Swift Acetate Glial Assay (SAGA): An accelerated human (13)C MRS brain exam for clinical diagnostic use. J Magn Reson. 2010;207(2):352–355. doi: 10.1016/j.jmr.2010.09.010. [DOI] [PMC free article] [PubMed] [Google Scholar]
- 148.Chhina N, Kuestermann E, Halliday J, Simpson LJ, Macdonald IA, Bachelard HS, Morris PG. Measurement of human tricarboxylic acid cycle rates during visual activation by (13)C magnetic resonance spectroscopy. J Neurosci Res. 2001;66(5):737–746. doi: 10.1002/jnr.10053. [DOI] [PubMed] [Google Scholar]
- 149.Henry P-G, Criego AB, Kumar A, Seaquist ER. Measurement of cerebral oxidative glucose consumption in patients with type 1 diabetes mellitus and hypoglycemia unawareness using (13)C nuclear magnetic resonance spectroscopy. Metab Clin Exp. 2010;59(1):100–106. doi: 10.1016/j.metabol.2009.07.012. [DOI] [PMC free article] [PubMed] [Google Scholar]
- 150.Patel AB, de Graaf RA, Mason GF, Kanamatsu T, Rothman DL, Shulman RG, Behar KL. Glutamatergic neurotransmission and neuronal glucose oxidation are coupled during intense neuronal activation. J Cereb Blood Flow Metab. 2004;24(9):972–985. doi: 10.1097/01.WCB.0000126234.16188.71. [DOI] [PubMed] [Google Scholar]
- 151.Choi I-Y, Lei H, Gruetter R. Effect of deep pentobarbital anesthesia on neurotransmitter metabolism in vivo: on the correlation of total glucose consumption with glutamatergic action. J Cereb Blood Flow Metab. 2002;22(11):1343–1351. doi: 10.1097/01.WCB.0000040945.89393.46. [DOI] [PubMed] [Google Scholar]
- 152.Wang J, Jiang L, Jiang Y, Ma X, Chowdhury GMI, Mason GF. Regional metabolite levels and turnover in the awake rat brain under the influence of nicotine. J Neurochem. 2010;113(6):1447–1458. doi: 10.1111/j.1471-4159.2010.06684.x. [DOI] [PMC free article] [PubMed] [Google Scholar]
- 153.Yang J, Shen J. In vivo evidence for reduced cortical glutamate-glutamine cycling in rats treated with the antidepressant/antipanic drug phenelzine. Neuroscience. 2005;135(3):927–937. doi: 10.1016/j.neuroscience.2005.06.067. [DOI] [PubMed] [Google Scholar]