

Abstract
Spatially embedded complex networks, such as nervous systems, the Internet, and transportation networks, generally have nontrivial topological patterns of connections combined with nearly minimal wiring costs. However, the growth rules shaping these economical tradeoffs between cost and topology are not well understood. Here, we study the cellular nervous system of the nematode worm Caenorhabditis elegans, together with information on the birth times of neurons and on their spatial locations. We find that the growth of this network undergoes a transition from an accelerated to a constant increase in the number of links (synaptic connections) as a function of the number of nodes (neurons). The time of this phase transition coincides closely with the observed moment of hatching, when development switches metamorphically from oval to larval stages. We use graph analysis and generative modeling to show that the transition between different growth regimes, as well as its coincidence with the moment of hatching, may be explained by a dynamic economical model that incorporates a tradeoff between topology and cost that is continuously negotiated and renegotiated over developmental time. As the body of the animal progressively elongates, the cost of longer-distance connections is increasingly penalized. This growth process regenerates many aspects of the adult nervous system’s organization, including the neuronal membership of anatomically predefined ganglia. We expect that similar economical principles may be found in the development of other biological or manmade spatially embedded complex systems.
Keywords: C. elegans, connectome, generative model, neurodevelopment, spatial network
In the past decade or so, an abundance of studies have demonstrated that superficially diverse systems share important statistical properties (1–4). Movie costar networks, transport and communication systems, gene–gene interactomes, and many other natural and manmade systems have similarly complex topological features: they generally are efficient, small-world, modular systems with a greater-than-random probability of highly connected nodes or hubs. Many but not all of these topologically complex systems also are spatially embedded (5). For example, both the Internet and the World Wide Web have nontrivial topologies, but only the Internet is physically instantiated as a network in a metric space. Spatially embedded networks generally increase in cost with increasing distance of connections between nodes; and this cost constraint must be traded off against the functional advantages of topological features such as hub nodes, robustness, and high global efficiency, that may add value but at greater than minimal cost (6). Nervous systems share these general economical properties (7): at all scales of space and time and in all species, brain networks likely are both parsimoniously wired (8) and topologically complex (3).
This was first demonstrated in the case of the network of neurons comprising the nervous system of the nematode worm, Caenorhabditis elegans (9, 10). The brain of the hermaphrodite worm consists of 279 neurons (excluding the pharyngeal neurons) and is a sparse network (4% of maximum connection density), with most connections being between cells separated by short distances (<10% of the overall body length of the adult worm). Both sparse connection density and low connection distance are as expected by the operation of a parsimonious drive to minimize wiring cost. However, the wiring cost of the C. elegans connectome is not strictly minimized (11–13): further reductions of connection distance may be achieved by rewiring the biological network in silico, but only at the expense of increasing the shortest topological path between neurons (14), thus reducing the overall system efficiency. To put it another way, it seems there is a tradeoff between connection distance and topological efficiency in the organization of the adult nematode worm’s nervous system. Topological efficiency is theoretically advantageous for globally integrated information processing and coordinated behaviors, but it is disproportionately expensive to engineer (7, 15). It is arguable that such economical tradeoffs between topological value and physical cost likely are a general selection pressure on formation of spatially embedded and topologically complex networks. More specifically, we predicted that economical principles applied dynamically over the course of developmental time (hundreds of minutes after fertilization) might provide a reasonable account of the emergence of multiple observed features of the growth and adult configuration of the nematode’s nervous system.
Results
Here, we investigate the growth of the C. elegans connectome, from the moment of fertilization through hatching of the egg and larval elongation to adulthood (16, 17). Importantly, we note that the physical distances between neurons increase as a function of the increasing overall length of the worm’s body as it matures (Fig. 1A). The cells of the adult nervous system are concentrated in the head and the tail of the worm, with a series of neurons running along the length of the body to innervate local muscle groups (the ventral cord). This system may be decomposed into 10 ganglia (or neuronal groups) based on anatomical properties (18, 19) (Fig. 1B). The birth times of each neuron tend to cluster in two time windows, separated by a “quiet” period that includes the time of hatching (800 min after fertilization) (Fig. 1C). The developmental changes in the number of nodes (N) and edges (K) in the network occur in the context of progressive elongation of the worm’s body, from less than 50 μm before hatching to more than 1 mm in the adult.
Fig. 1.

Development of the C. elegans nervous system. (A) C. elegans reaches maturity roughly 63 h after fertilization. During this time, its body length increases from  to
to  (22–24). (B) In the adult hermaphrodite worm, more than
  of the neurons are located in the head and about
  are found in the tip of the tail (based on data modified according to ref. 17, axis arbitrarily centered such that the origin is at the base of the head). Neurons are colored by ganglion membership (16): anterior [A], dorsal [B], lateral [C], ventral [D], retrovesicular [E], ventral cord [G], posterior lateral [F], preanal [H], dorsorectal [J], and lumbar [K]. (C) The total number of neurons (N, solid black), and connections (K, dashed blue), grows rapidly between 250 and 500 min after fertilization. Another burst of neurogenesis is observed at the end of the L1 larval stage (using data from ref. 17). (D) Plotting the number of synapses as a function of the number of neurons (yellow ●) reveals the presence of a phase transition. Before hatching, K grows as
  (solid blue line), whereas after hatching, K grows linearly with N (dashed green line). (Inset) Plot of the average nodal degree vs. N.
The two growth spurts in neuronal number, before and after hatching, are paralleled by a roughly synchronous increase in the total number of synaptic connections between neurons (Fig. 1C). However, the form of the relationship between N and K evidently is different before and after hatching, as shown in Fig. 1D. The initial increase in K is well described by a quadratic function of N, implying that the average node degree increases linearly as the network grows (Fig. 1D, Inset). Then, at  , hatching takes place, marking the metamorphic change of the worm from egg to larva. This event coincides with a discontinuous change in growth rules: after hatching, K increases linearly with N, so the average node degree remains constant. This experimental evidence suggests that sharp qualitative changes can indeed affect the growth rules governing the development and the formation of complex networks (1, 2, 20). In this case, the transition from one growth regime to another coincides with a metamorphic change of the worm, from egg to larva.
Although it is tempting to assume that it is a biological “trigger” or discontinuity associated with hatching that underlies the emergence of this biphasic growth curve, here we have assessed the ability of several simple and continuous models of network formation to reproduce this observed behavior without incorporating further biological detail (Fig. 2 and Materials and Methods). We deliberately decided to restrict ourselves to stochastic one-parameter models: first, because our aim was to isolate the fundamental ingredients that might be responsible for the observed discontinuous growth, and second, because as we show in the following, a one-parameter model indeed was enough to reproduce both the biphasic growth and many of the structural properties of the adult C. elegans neuronal network.
Fig. 2.
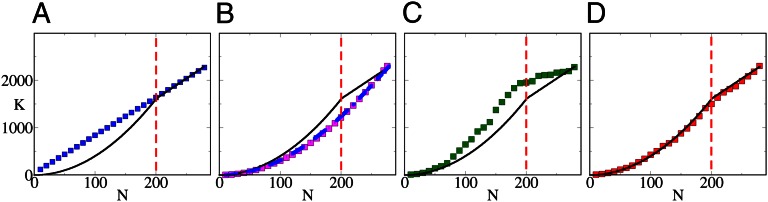
Modeling network growth. (A) The linear preferential attachment model (BA, blue ■) fails to reproduce the biphasic growth observed (solid line). (B) In the BAG model (magenta ■) and the HAG model (dashed blue line), the average node degree increases linearly with the size of the network. (C) The ESG model (green ■) exhibits a biphasic behavior, yielding a transition from quadratic to nearly linear growth at  , but fails to capture the details of the observed growth. (D) The ESTG model (red ■) accurately reproduces the details of the biphasic growth trajectory; for example, the inflection point of the modeled developmental curve corresponds closely to the moment of metamorphosis (hatching). The red dashed line in each panel indicates the number of nodes at the time of hatching
 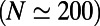 . The SE of each growth curve is smaller than the size of the symbols used to plot it and is not reported.
The first model we considered was the linear preferential attachment model, introduced by Barabási and Albert (BA) (20), which has been used successfully to describe the development of many different complex networks, from the World Wide Web to the Internet and citation networks. The BA model assumes that the growth of a network is driven only by its topological properties: specifically, newborn neurons are more likely to form connections to neurons that are already well connected. This model predicts a linear relationship between N and K, which closely matches the posthatching phase of worm brain development but does not provide a satisfactory fit to the prehatching phase. Conversely, the binomial accelerated growth (BAG) model, which assumes that the probability of a connection between a new neuron and any preexisting neuron is constant, predicts that K increases as a quadratic function of N (21). Similarly, we observe a quadratic dependence of K on N also in a modified version of accelerated growth [hidden-variable accelerated growth (HAG)], which additionally reproduces the node degree distribution of the adult worm. Accelerated growth models thus can reproduce the prehatching phase of the worm brain’s growth but fail to accommodate the transition to linear scaling of K with N in the posthatching phase.
We found that economical tradeoff models that account for the spatial location of neurons while allowing some long-distance connections to high-degree nodes could reproduce biphasic growth more accurately. As a first approximation, we defined the economical spatial growth (ESG) model, which assumes that the probability of a connection forming between newborn neuron i and preexisting neuron j is a product of the degree of the jth node in the adult nervous system, and a decreasing exponential function of the Euclidean distance  between nodes i and j in the adult worm. Although the modeled growth exhibits two phases, the transition between quadratic and linear phases occurs before hatching. Therefore, we considered a more refined economical spatiotemporal growth (ESTG) model where
  is estimated by the Euclidean distance between neurons i and j at the time of birth of the newborn neuron, thereby adjusting for the fact that the connection distance between any pair of neurons will be shorter at earlier stages of development, before the worm becomes elongated. We extrapolated the position of each neuron during growth from its position in the adult worm, assuming that each neuron’s position was shifted along the longitudinal axis in proportion to the overall changes in body length (Fig. 1A), which we collated from the literature (ref. 22 for the prehatching stage and ref. 23 after hatching) using a linear interpolation between larval stages (24). Although the penalty on connection distance remains fixed in this model, its effect on connectivity as a function of the overall scaling of the system is evolving dynamically. Indeed, the tradeoff between distance and topological degree is increasingly biased in favor of minimizing connection distance as development proceeds and the worm becomes longer overall. The model provides an excellent fit to the two observed scalings of K as function of N in the biological data, including a good approximation of the moment of hatching to the transition point from one growth regime to the other.
This suggests that the discontinuity in the growth curve is not explained by biological triggers related to hatching but instead is a consequence of the spatial properties of the system. In particular, the average distance of newly born neurons relative to all other neurons is much greater after hatching, so the distance penalty term begins to dominate the tradeoff embodied in the spatial growth rules. This is especially obvious in the ESTG model, in which the worm’s elongation causes distances to increase in the interim between the two bursts of neurogenesis. Note, however, that a transition already is visible in the ESG model. This may be explained by noting that most neurons born after hatching are located along the body of the worm rather than in the head (SI Appendix, section S1 and Fig. S1), so the average distance between these newly born neurons and all others is again increased after hatching. We also tested the ability of other one-parameter models to reproduce the observed growth curve (SI Appendix, section S2); in particular, we tried to encode the cost of long connections through a power-law decay instead of an exponential one, but none of the alternative models could accommodate the abrupt change in the functional relation between K and N with the same accuracy obtained by ESTG (SI Appendix, section S4 , Table S-II, and Fig. S2).
The ESTG model also provides a good account of several other features of the adult nervous system’s organization, including the statistical distributions of node degree, node efficiency, and edge length in the adult worm brain (Fig. 3). According to the results obtained through the computation of the symmetrized Kullback–Leibler divergence, ESTG is the model that most closely reproduces the distributions of node degree, edge length, and node efficiency (SI Appendix, section S5, Table S-III, and Figs. S3–S5).
Fig. 3.

Local and mesoscopic network structures. (A) The distributions of node degree (Left, blue), connection distance (Center, red), and node efficiency (Right, orange) of model-generated networks closely match those observed in the C. elegans neuronal network (shown in gray). (B) This panel shows how the average node degree (Upper) and the average node efficiency (Lower) vary along the length of the C. elegans body (solid black lines) and in networks generated using the ESTG model (red dashed lines). (C) Networks created using the ESTG model (Right) also reproduce the pattern of intra- and interganglia connections observed in C. elegans (Left). Brighter colors indicate higher connection density; letters A–K denote neuronal ganglia as defined in legend to Figure 1.
Moreover, the model can provide a reasonable account of finer-grained details of the adult system, such as the anatomical variation in the average node degree and nodal efficiency along the length of the worm. Networks simulated by the model also had a mesoscopic structure closely resembling the pattern of clustered connectivity between neurons belonging to one of 10 ganglia previously defined on biological grounds. Neurons belonging to the same ganglion in the worm brain tend to have high connectivity with one another and relatively sparse connectivity to neurons in other ganglia (18, 19). This biological pattern and the neurons belonging to each specific ganglion were reproduced quite accurately by the ESTG model (Fig. 3).
Discussion
We have shown that a fairly simple economical model was adequate to account for many aspects of the spatial and topological development of the nervous system of the nematode worm, C. elegans. We describe this generative model as economical because it represents the formation of synaptic connections probabilistically as a tradeoff between topological value and wiring cost. More specifically, the model accommodates the potentially competitive tendencies of each new neuron to connect to topologically important hub neurons, which may be a long distance away (∼1 mm), versus connecting only to neurons that are spatially adjacent (<0.1 mm), which will conserve wiring costs. Crucially, in estimating the connection cost between pairs of neurons, we have used prior data on the birth time of each neuron and the progressive elongation of the worm’s body to estimate the distance between each pair of neurons at the time of synapse formation. This measure of connection cost was traded off against a topological bias (preferential attachment) for new neurons to connect to high-degree hub neurons of the adult nervous system. As the worm’s body progressively elongates, the cost penalty predominates and long-distance connections, even to hub nodes, become less likely. This simple but unique model of a dynamically evolving economical tradeoff between cost and topology has allowed us to reproduce a phase transition in the growth of the C. elegans cellular connectome coinciding closely with the moment of hatching, or metamorphic transition from egg to larval stages of development. Dynamical economical growth processes also simulated several aspects of the configuration of the adult nervous system.
The principle that nervous systems conserve wiring costs dates back to the seminal work of Ramón y Cajal in the 19th century, and it has been experimentally validated and theoretically developed extensively since then. Many aspects of brain organization, ranging from the placement of neurons in the adult C. elegans nervous system (8) to the shape of dendritic trees (25) and the modular architecture of large-scale human brain networks (26), have been attributed plausibly to a parsimonious drive to minimize wiring costs. However, a strictly cost-minimal network would have a regular, lattice-like topology. Synaptic connections would be clustered between spatially and topologically neighboring neuronal nodes, with none of the long-distance axonal projections needed to mediate topologically efficient communication between widely separated neurons. However, this is not a recognizable description of nervous system topology. In many species, and at many scales of space and time, it has been found that brain structural and functional networks have a shorter average path length or greater efficiency than a regular lattice. Brain networks also consistently have nonregular properties, such as high-degree hubs in a fat-tailed degree distribution, and a modular community structure entailing long-distance intermodular connections between neurons in anatomically distributed modules. Many of these topological features are more than minimally expensive or incur a premium in wiring cost, but they may add value to the overall performance of the system. For example, high-degree hub nodes of the C. elegans nervous system include many of the so-called command interneurons that play a key role in the adaptive function of coordinated forward and backward movement of the worm (15, 16). Topological efficiency of human brain networks has been positively correlated with normal variation in IQ (more intelligent people tend to have more efficient structural and functional networks) (7, 27). Tradeoffs between cost and efficiency have been shown to be heritable properties of human brain networks derived from functional MRI (fMRI) data (28), and economical models of network formation can reproduce the (somewhat different) statistical properties of fMRI networks in both healthy adults and patients with schizophrenia (29). These and other observations support the general idea that nervous systems are selected to negotiate an economical tradeoff between wiring cost (usually measured by connection distance) and topological value (which might be measured by degree, efficiency, or several other network properties related to adaptive brain function).
Therefore, the basic principles of the economical model investigated here are not new to the neuroscience literature (7). However, there are several distinctive aspects of our results. Firstly, this work is an innovative demonstration that economical models can account for the growth of a nervous system described quite concretely and exactly at the cellular scale of synaptic connections between neurons. Many of the previous studies of economical tradeoffs in brain networks were based on analysis of statistical associations (so-called functional connectivity) between fMRI time series recorded at different spatial locations (28), or on analysis of large-scale axonal projections rendered by tractography algorithms applied to diffusion imaging data (30). Such human neuroimaging results indicate that economical principles may apply to network formation at macroscopic scales, but the neuronal substrate of networks based on imaging statistics remains unresolved. The demonstration here of economical principles applying to a connectome described with much greater precision at a cellular scale somewhat validates the prior neuroimaging results. Moreover, it suggests that the same competitive selection criteria may inform nervous system formation over multiple spatial scales. Brain networks may have a scale-invariant or fractal economy of organization.
More broadly, these results are innovative in demonstrating directly how simple economical growth models can provide a reasonable account of complex growth curves, such as the nonlinear processes of nervous system maturation and metamorphosis, from egg to adult worm. Nematodes, like all members of the superphylum Ecdysozoa, develop through discrete stages (egg, several juvenile stages, adult) separated by molting events. The situation in C. elegans is most closely analogous to hemimetabolous insects (with “incomplete metamorphosis”) because the juvenile stages resemble the adults apart from the absence of mating/reproductive structures. However, each molt may be considered metamorphic, with the L1–L2 and L4–adult molts, in particular, known to involve both the addition of new cells and formation of new synaptic links. The special significance of the egg–L1 transition perhaps has been less appreciated up to now, and as such represents a unique finding of this work.
Our more realistic modeling of connection cost, taking into account the changing spatial constraints during the growth of the system, also shines a different light on the many previous studies of connection cost (8, 11, 16) in this paradigmatic complex system. Further work is needed to test the hypothesis that the specific parameters of this model correspond to discrete molecular or genetic signals. It is imaginable, for example, that a penalty on long-distance connections might be biologically coded by the spatial gradient of an axonally attractive molecule diffusing from neurons, or that neurons destined to have high degree in the adult system express distinctive cell surface markers from birth that favor synaptic formation.
We have compared the performance of the dynamically evolving economical model with that of several other models and, as expected theoretically, found that simpler models based on preferential attachment rules could reproduce one of the two phases of network development (quadratic or linear) before or after hatching. However, only economical models that traded off connection distance with preferential attachment bias could reproduce both phases, and the timing of phase transition was reproduced accurately only by the dynamic linkage between interneuronal connection distance and progressive developmental elongation of the whole organism. For this reason, we consider that the modeling results affirm our hypothetical prediction that development of this cellular connectome can be accounted for by continual renegotiation of an economical tradeoff between connection cost and the formation of high-degree hubs. This affirmation is conditional on the caveat that not all possible models have been evaluated comparatively. It is possible that a better model, perhaps incorporating a few more relevant biological details (such as type of synapse, electrical or chemical), might be developed in the future.
We note that economical principles of network formation demonstrated here for the growth of the nervous system of the nematode worm are not necessarily limited to this system. Many other systems, besides brains, are both spatially embedded and topologically complex. We anticipate that economical growth models of the potentially changing tradeoffs between physical connection cost and topological value also may contribute to future understanding of the development and evolution of transport, computational, and infrastructural systems.
Materials and Methods
Data.
We have used the most up-to-date map of the C. elegans connectome (16), consisting of 279 somatic neurons interconnected through 6,393 chemical synapses, 890 gap junctions, and 1,410 neuromuscular junctions. Because gap junctions often overlap with synapses and synaptic connections often are reciprocated, we have considered only the backbone network, in which all the synapses and gap junctions between each pair of neurons are represented by a single undirected edge, obtaining a graph with  nodes and
  edges in total (neuromuscular connections were excluded). Information about the growth of the neuronal network, particularly the exact time of birth of each neuron, has been reconstructed from recent literature (17).
Linear Preferential Attachment.
The BA model assumes that the growth of a network is driven solely by its topological structure, and produces random graphs with a power-law degree distribution  , where
  (20). In the model, a new node is added at each time and is connected to m existing nodes. The probability for the new node i to be connected to an existing node j is a linear function of the degree
  , namely
where K denotes the total number of links when the new node arrives. Because each node chooses m neighbors with which to connect, the total number of links increases linearly with the size of the network, and the average node degree remains constant.
Accelerated Topological Growth.
Traditionally, network growth is said to be accelerated if the average node degree increases with the size of the network. Acceleration has been observed in many complex networks, and different models of scale-free networks with acceleration have been proposed so far (21). We have considered two different accelerated growth models. In the first model, called binomial accelerated growth (BAG), a new node i tries to establish a connection with each of the existing nodes, and a link to node j is created with probability p, namely
The BAG model produces networks in which the number of links increases as the square of N. In fact, the expected number of links established when the network has N nodes is
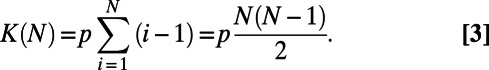 |
The BAG model produces networks with a binomial degree distribution, because it is equivalent to an Erdös–Rényi random graph model, in which each of the  potential links appears with probability p (31).
We also introduced a second model of accelerated growth, called hidden-variable accelerated growth (HAG). In general, hidden-variable models produce networks with a prescribed degree distribution: the HAG model grows random networks having, on average, the same degree distribution observed in the adult C. elegans neural network. The model works as follows. We assign to each node j of the network, once and for all, a hidden variable  . In particular, we set
  , where
  is the degree of node j in the adult worm. When a new node i arrives, it tries to establish a link with each of the nodes in the network, and a link to node j is created with probability
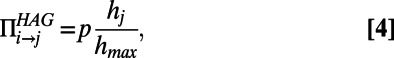 |
where  is the maximum of
  over j and p is appropriately selected to reproduce the final number of links. It is possible to prove that the final degree of a node i over different network realizations is Poisson distributed around an average value equal to
  . Consequently, networks produced by HAG show an accelerated growth similar to that generated by the BAG model while also preserving the actual degree distribution of the C. elegans neural network.
ESG.
To create networks embedded in Euclidean space (5, 6), we considered the economical spatial growth model, which is based on a tradeoff between the tendency to create topologically important connections to hubs and the physical distance between neurons. When a new node i arrives, it is placed in the position it occupies in the adult worm, and a link to each of the existing nodes is created with probability
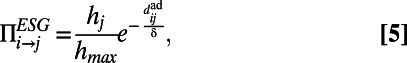 |
where the values  are assigned as in the HAG model and δ is a parameter tuning the typical connection distance. Namely, the probability of creating a link exponentially decreases with the Euclidean distance
  that separates i and j in the adult worm, and is weighted by the hidden variable
  (to preserve the actual degree distribution of the C. elegans neural network).
ESTG.
The economical spatio-temporal growth model, using information about the length of the worm at different stages, takes into account the actual spatial position of each neuron while the worm grows over time. When a new node i arrives, it is placed in the position it occupies in the C. elegans neural network at time t, and a link to each of the existing nodes is created with probability
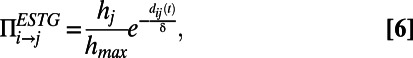 |
where the values  are assigned as in the HAG model and δ is a parameter tuning the typical edge length. Notice that the probability to establish a link depends on the time at which node i appears, because the distance
  depends on the relative positions of i and j, which change over time because of elongation of the worm’s body. We considered the real length of the worm at each time, and we estimated the position of each node at that time using linear interpolation and assuming a uniform expansion of the worm along the longitudinal axis.
Parameter Tuning.
The first requirement of any suitable model for the C. elegans neuronal network growth is to produce networks having  nodes and, on average,
  edges, as observed in the adult worm. We used Monte Carlo simulations and iterative bisection to identify the interval in the parameter space for which the expected total number of edges
  of the generated networks was equal to
  ; see SI Appendix, section S3 for methodological details and the optimal parameter values for each of the eight models in SI Appendix, Table S-I.
Degree Distribution.
Given an undirected graph  associated with the symmetric adjacency matrix
  , the degree of a node i is defined as the number of edges incident on i, and is denoted by
 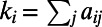 . The degree distribution
  of the graph indicates, for each value of k, the probability of finding a node whose degree is equal to k.
Connection Distance Distribution.
Given two directly connected nodes i and j of a spatially embedded network, we define the distance of the edge  as the Euclidean distance
  separating node i and node j. The distance distribution
  is the probability of finding an edge whose distance is exactly equal to d.
Node and Graph Efficiency.
Given an undirected and unweighted graph G, the efficiency of a node is defined as
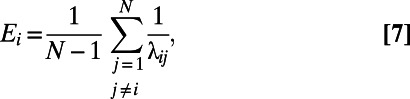 |
where  is the path length between node i and node j, measured as the number of edges in the shortest path connecting i to j. The smaller the
  , the larger the contribution of node j to the efficiency of i. The efficiency of a graph is defined as the average efficiency of its nodes.
Supplementary Material
Acknowledgments
V.N. and V.L. acknowledge the support of the EU Project LASAGNE, Contract no. 318132 (STREP). The Behavioural and Clinical Neuroscience Institute is supported by the Medical Research Council (United Kingdom) and the Wellcome Trust.
Footnotes
Conflict of interest statement: E.T.B. is employed part time by GlaxoSmithKline and part time by the University of Cambridge.
This article is a PNAS Direct Submission.
This article contains supporting information online at www.pnas.org/lookup/suppl/doi:10.1073/pnas.1300753110/-/DCSupplemental.
References
- 1.Albert R, Barabási A-L. Statistical mechanics of complex networks. Rev Mod Phys. 2002;74(1):47–97. [Google Scholar]
- 2.Boccaletti S, Latora V, Moreno Y, Chavez M, Hwang D-U. Complex networks: Structure and dynamics. Phys Rep. 2006;424:175–308. [Google Scholar]
- 3.Bullmore E, Sporns O. Complex brain networks: Graph theoretical analysis of structural and functional systems. Nat Rev Neurosci. 2009;10(3):186–198. doi: 10.1038/nrn2575. [DOI] [PubMed] [Google Scholar]
- 4.Barabási A-L. The network takeover. Nat Phys. 2012;8:14–16. [Google Scholar]
- 5.Barthélemy M. Spatial networks. Phys Rep. 2011;499:1–101. [Google Scholar]
- 6.Barthélemy M. Crossover from scale-free to spatial networks. EPL. 2003;63(6):915–921. [Google Scholar]
- 7.Bullmore E, Sporns O. The economy of brain network organization. Nat Rev Neurosci. 2012;13(5):336–349. doi: 10.1038/nrn3214. [DOI] [PubMed] [Google Scholar]
- 8.Chen BL, Hall DH, Chklovskii DB. Wiring optimization can relate neuronal structure and function. Proc Natl Acad Sci USA. 2006;103(12):4723–4728. doi: 10.1073/pnas.0506806103. [DOI] [PMC free article] [PubMed] [Google Scholar]
- 9.Watts DJ, Strogatz SH. Collective dynamics of ‘small-world’ networks. Nature. 1998;393(6684):440–442. doi: 10.1038/30918. [DOI] [PubMed] [Google Scholar]
- 10.Latora V, Marchiori M. Economic small world behaviour in weighted networks. Eur Phys J B. 2003;32(2):249–263. [Google Scholar]
- 11.Pérez-Escudero A, de Polavieja GG. Optimally wired subnetwork determines neuroanatomy of Caenorhabditis elegans. Proc Natl Acad Sci USA. 2007;104(43):17180–17185. doi: 10.1073/pnas.0703183104. [DOI] [PMC free article] [PubMed] [Google Scholar]
- 12.Pérez-Escudero A, Rivera-Alba M, de Polavieja GG. Structure of deviations from optimality in biological systems. Proc Natl Acad Sci USA. 2009;106(48):20544–20549. doi: 10.1073/pnas.0905336106. [DOI] [PMC free article] [PubMed] [Google Scholar]
- 13.Sporns O. Networks of the Brain. Cambridge, MA: MIT Press; 2011. [Google Scholar]
- 14.Kaiser M, Hilgetag CC. Nonoptimal component placement, but short processing paths, due to long-distance projections in neural systems. PLOS Comput Biol. 2006;2(7):e95. doi: 10.1371/journal.pcbi.0020095. [DOI] [PMC free article] [PubMed] [Google Scholar]
- 15.Towlson EK, Vertes PE, Ahnert SE, Schafer WR, Bullmore ET. The rich club of the C. elegans neuronal connectome. J Neurosci. 2013;33(15):6380–6387. doi: 10.1523/JNEUROSCI.3784-12.2013. [DOI] [PMC free article] [PubMed] [Google Scholar]
- 16.Varshney LR, Chen BL, Paniagua E, Hall DH, Chklovskii DB. Structural properties of the Caenorhabditis elegans neuronal network. PLOS Comput Biol. 2011;7(2):e1001066. doi: 10.1371/journal.pcbi.1001066. [DOI] [PMC free article] [PubMed] [Google Scholar]
- 17.Varier S, Kaiser M. Neural development features: Spatio-temporal development of the Caenorhabditis elegans neuronal network. PLOS Comput Biol. 2011;7(1):e1001044. doi: 10.1371/journal.pcbi.1001044. [DOI] [PMC free article] [PubMed] [Google Scholar]
- 18.Arenas A, Fernández A, Gómez S. A complex network approach to the determination of functional groups in the neural system of C. elegans. In: Liò P, Yoneki E, Crowcroft J, Verma DC, editors. Bio-Inspired Computing and Communication. Berlin: Springer; 2008. pp. 9–18. [Google Scholar]
- 19.Arenas A, Fernández A, Gómez S. An optimization approach to the structure of the neuronal layout of C. elegans. In: Boccaletti S, Latora V, Moreno Y, editors. Handbook on Biological Networks. Vol 10. London: World Scientific; 2009. pp. 243–257. [Google Scholar]
- 20.Barabási A-L, Albert R. Emergence of scaling in random networks. Science. 1999;286(5439):509–512. doi: 10.1126/science.286.5439.509. [DOI] [PubMed] [Google Scholar]
- 21.Dorogovtsev SN, Mendes JFF. Effect of the accelerating growth of communications networks on their structure. Phys Rev E Stat Nonlin Soft Matter Phys. 2001;63(2 Pt 2):025101. doi: 10.1103/PhysRevE.63.025101. [DOI] [PubMed] [Google Scholar]
- 22.McKeown C, Praitis V, Austin J. sma-1 encodes a betaH-spectrin homolog required for Caenorhabditis elegans morphogenesis. Development. 1998;125(11):2087–2098. doi: 10.1242/dev.125.11.2087. [DOI] [PubMed] [Google Scholar]
- 23. Altun ZF, Hall DH (2012) Handbook of C. elegans anatomy. WormAtlas. Figure 6. Available at www.wormatlas.org/hermaphrodite/hermaphroditehomepage.htm. [Google Scholar]
- 24.Altun ZF, Hall DH. Handbook of C. elegans anatomy, Figure 6. WormAtlas. 2012 Available at www.wormatlas.org/hermaphrodite/hermaphroditehomepage.htm. [Google Scholar]
- 25.Cuntz H, Forstner F, Borst A, Häusser M. One rule to grow them all: A general theory of neuronal branching and its practical application. PLOS Comput Biol. 2010;6(8):e1000877. doi: 10.1371/journal.pcbi.1000877. [DOI] [PMC free article] [PubMed] [Google Scholar]
- 26.Bassett DS, et al. Efficient physical embedding of topologically complex information processing networks in brains and computer circuits. PLOS Comput Biol. 2010;6(4):e1000748. doi: 10.1371/journal.pcbi.1000748. [DOI] [PMC free article] [PubMed] [Google Scholar]
- 27.van den Heuvel MP, Stam CJ, Kahn RS, Hulshoff Pol HE. Efficiency of functional brain networks and intellectual performance. J Neurosci. 2009;29(23):7619–7624. doi: 10.1523/JNEUROSCI.1443-09.2009. [DOI] [PMC free article] [PubMed] [Google Scholar]
- 28.Fornito A, et al. Genetic influences on cost-efficient organization of human cortical functional networks. J Neurosci. 2011;31(9):3261–3270. doi: 10.1523/JNEUROSCI.4858-10.2011. [DOI] [PMC free article] [PubMed] [Google Scholar]
- 29.Vértes PE, et al. Simple models of human brain functional networks. Proc Natl Acad Sci USA. 2012;109(15):5868–5873. doi: 10.1073/pnas.1111738109. [DOI] [PMC free article] [PubMed] [Google Scholar]
- 30.van den Heuvel MP, Kahn RS, Goñi J, Sporns O. High-cost, high-capacity backbone for global brain communication. Proc Natl Acad Sci USA. 2012;109(28):11372–11377. doi: 10.1073/pnas.1203593109. [DOI] [PMC free article] [PubMed] [Google Scholar]
- 31.Erdös P, Rényi A. On the evolution of random graphs. Publ Math Inst Hung Acad Sci. 1960;5:17–61. [Google Scholar]
Associated Data
This section collects any data citations, data availability statements, or supplementary materials included in this article.