

Summary
Purpose
Dysfunction of the blood–brain barrier (BBB) and albumin extravasation have been suggested to play a role in the etiology of human epilepsy. In this context, dysfunction of glial cells attracts increasing attention. Our study was aimed to analyze in the hippocampus (1) which cell types internalize albumin injected into the lateral ventricle in vivo, (2) whether internalization into astrocytes impacts their coupling and expression of connexin 43 (Cx43), and (3) whether expression of Kir4.1, the predominating astrocytic K+ channel subunit, is altered by albumin.
Methods
The patch-clamp method was combined with single cell tracer filling to investigate electrophysiologic properties and gap junction coupling (GJC). For cell identification, mice with cell type–specific expression of a fluorescent protein (NG2kiEYFP mice) and immunohistochemistry were employed. Semiquantitative real time polymerase chain reaction (RT-PCR) allowed analysis of Kir4.1 and Cx43 transcript levels.
Key Findings
We show that fluorescently labeled albumin is taken up by astrocytes, NG2 cells, and neurons, with NG2 cells standing out in terms of the quantity of uptake. Within 5 days postinjection (dpi), intracellular albumin accumulation was largely reduced suggesting rapid degradation. Electrophysiologic analysis of astrocytes and NG2 cells revealed no changes in their membrane properties at either time point. However, astrocytic GJC was significantly decreased at 1 dpi but returned to control levels within 5 dpi. We found no changes in hippocampal Cx43 transcript expression, suggesting that other mechanisms account for the observed changes in coupling. Kir4.1 mRNA was regulated oppositely in the CA1 stratum radiatum, with a strong increase at 1 dpi followed by a decrease at 5 dpi.
Significance
The present study demonstrates that extravasal albumin in the hippocampus induces rapid changes of astrocyte function, which can be expected to impair ion and transmitter homeostasis and contribute to hyperactivity and epileptogenesis. Therefore, astrocytes may represent alternative targets for antiepileptic therapeutic approaches.
Keywords: Connexin, Blood–brain barrier, Dye coupling, Kir4.1, Cx43
Although there is ample evidence for a link between epilepsy and a compromised blood–brain barrier (BBB), the causal relation between both phenomena has remained obscure (Oby & Janigro, 2006). Only recently have animal experiments shown that exposure of brain tissue to albumin leads to epileptiform activity, and it has been suggested that albumin extravasation may also play a role in the etiology of human epilepsy (Seiffert et al., 2004; for review see Friedman et al., 2009). Therefore, disruption of the BBB and albumin extravasation was reported in human mesial temporal lobe epilepsy (TLE), with maximum albumin values occurring in autopsy material of patients who had died during status epilepticus (SE). In the same study, in rats, BBB permeability was positively correlated with seizure frequency (Van Vliet et al., 2007). Intriguingly, besides neurons, astrocytes that are key players in neural glutamate and K+ homeostasis (Danbolt, 2001; Kofuji & Newman, 2004) were postulated to take up albumin (Ivens et al., 2007; Van Vliet et al., 2007). The above-mentioned homeostatic functions of astrocytes are assumed to depend on gap junction coupling (GJC) and expression of inwardly rectifying K+ (Kir) channels, and astrocyte dysfunction is increasingly considered an important factor in the generation and spread of seizure activity (Seifert et al., 2010). Recently, transcript analysis and extracellular K+ concentration ([K+]o) measurements in rat neocortical brain slices revealed impaired K+ buffering and decreased expression of Kir4.1 after albumin exposure (Ivens et al., 2007; Cacheaux et al., 2009).
To directly assess the role of glial cells and analyze whether albumin internalization affects their functional properties, in the present study we investigated uptake of albumin in the hippocampus in vivo. Our focus was on the expression of connexin 43 (Cx43) and Kir4.1 channels because of their crucial involvement in the regulation of neuronal excitability. Patch-clamp recordings were combined with tracer filling of identified cells to monitor gap junction coupling, and semiquantitative (sq) reverse transcription-polymerase chain reaction (RT-PCR) analysis was employed to assess transcript levels. Our data show that NG2 cells and astrocytes rapidly internalize extravasal albumin, and that this intracellular albumin is largely degraded within 5 days postinjection (dpi). Kir4.1 transcript levels in SR are elevated at 1 dpi but reduced at 5 dpi. In astrocytes, albumin uptake is accompanied by a decrease in GJC, which can be expected to impair ion and transmitter homeostasis and contribute to epileptogenesis.
Methods
All animals were treated according to the University of Bonn Animal Experiment Guideline, minimizing unnecessary pain and discomfort. Experiments were performed with C57/Bl6 (wild-type) and heterozygous NG2-EYFPki mice our own animal facility at Universitaetsklinikum Bonn (Karram et al., 2008), aged 95–195 days.
Cerebroventricular injection of albumin
Mice were placed under anesthesia with a mixture of 2:3 ketamine hydrochloride (ketamine; Pharmanovo, Hannover, Germany): medetomidine hydrochloride (Cepetor KH; CP-Pharma, Burgdorf, Germany) through intraperitoneal injection (3.3 μl/g bodyweight). Seven microliters of 1 mm (462 μg) bovine serum albumin conjugated with Texas Red (TR-Alb, Invitrogen, Leiden, The Netherlands) in sterile 0.9% NaCl (296 mOsm, B. Braun, Melsungen, Germany) or 0.9% NaCl alone (290 mOsm, 7 μl, control) was injected into the lateral ventricle (1 mm lateral, 0.5 mm posterior, and 2.3 mm ventral of bregma) over a period of 30 min (approximately 0.23 μl/min). The syringe was then left in place for another 15 min to allow diffusion of the injected solution. After surgery, anesthesia was terminated with Antisedan (Orion Pharma, Espor, Finland). Postoperative recovery was rapid, and we observed no lethality due to albumin injections. After intracerebroventricular (i.c.v.) injection, the mice were housed individually for 1 or 5 days before being sacrificed for immunohistochemistry, electrophysiology, and tracer injection or RNA extraction. The cerebroventricular localization of the above coordinates was confirmed through injection of methylene blue. Integrity of the dissolved TR-Alb conjugate under our conditions was confirmed by sodium dodecyl sulphate polyacrylamide gel electrophoresis (not shown; components from Carl Roth, Karlsruhe, Germany).
Immunohistochemistry and stereology
Mice were anesthetized (see above) and transcardially perfused with 0.4% paraformaldehyde (PFA) at 1 or 5 dpi of TR-Alb. The brain was removed and placed in 0.4% paraformaldehyde (PFA) for 24 h for further fixation. For freeze-protection the brain was placed in 30% sucrose in 0.1 m phosphate-buffered saline (PBS) until the tissue was saturated (approximately 36 h). Forty micron thick coronal sections were prepared with a cryomicrotome (CryoStar HM 560; MICROM Int., Walldorf, Germany). Sections were stored at 4°C before immunohistochemistry. Briefly, sections were washed, blocked with 10% normal goat serum (NGS) for 2 h, washed again and then incubated with primary antibodies overnight. Primary antibodies used were: anti-GFP coupled to fluorescein isothiocyanate (FITC; 1:1,000; Abcam, Cambridge, United Kingdom), anti-S100β (1:2,500; Swant, Bellinzona, Switzerland), and anti-NeuN (1:100; Chemicon, Hofheim, Germany). S100β and NeuN antibodies were visualized with Alexa Fluorophore 647 (Invitrogen). Images were acquired with a confocal laser scanning microscope (TCS NT, Leica Lasertechnik, Heidelberg, Germany) and a Leica 40×/NA 0.75 Plan Apochromat objective. Z-stacks contained 20–26 planes with 1.05–1.099 μm spacing. Planes were acquired with a resolution of 1,024 × 1,024 pixels corresponding to 252 × 252 μm. Excitation wavelengths of 488 nm, 568 nm, and 647 nm were produced by an Ar/Kr laser. Cells were counted in the stratum radiatum (SR) utilizing Fiji imaging software in accordance with stereologic guidelines (Peterson, 1999). Five sections at regular 160 μm intervals between −2.5 and −1.5 mm caudal of bregma were stained against EYFP and S100β. The first and last three optical planes were excluded from analysis as guard zones. Each image stack was treated as a three-dimensional counting frame. Cell somata touching the upper and/or left edge of any plane of the z-stack were excluded, whereas cells completely within the plane or touching only the lower and/or right edge were included. Cells visible in the first section were excluded, whereas those present in the last section were included. Accordingly, on average, 15.9 cells per stack (897 cells in total) were excluded for stereologic reasons. Cells within the stratum oriens (SO), stratum pyramidale (SP), or stratum lacunosum moleculare (SLM) were also excluded. Densitometry was performed on maximum projections of the raw data in Fiji software. To minimize the impact of varying staining intensities, sections of both time points were stained in an alternating manner or together. The area of the soma and major proximal processes of 15 single cells of each type in three random sections of three mice in each condition were traced and the average fluorescence intensity per area measured in arbitrary units (AU) for each channel. To avoid viewer bias, the red channel was switched off for tracing. Data from individual sections was averaged. Background was determined in-between cell somata, and subtracted.
Electrophysiology
Electrophysiologic properties of astrocytes were assessed at 1 and 5 dpi. For the characterization of NG2 cells, NG2-EYFP mice were injected intracerebroventricularly and sacrificed at 1 dpi. For electrophysiology mice were anesthetized with isoflurane (DeltaSelect, London, United Kingdom) and decapitated. The skullcap was rapidly removed and the brain placed in ice-cold preparation solution containing (in mm): 87 NaCl, 2.5 KCl, 1.25 NaH2PO4, 7 MgCl2, 0.5 CaCl2, 25 NaHCO3, 25 glucose, and 25 sucrose (equilibrated with 95% O2/5% CO2). Two hundred micron–thick coronal slices were cut on a vibratome (VT1200S; Leica, Nussloch, Germany) in ice-cold preparation solution. Slices were incubated for 20 min in preparation solution at 35°C and were subsequently kept in standard artificial cerebrospinal fluid (ACSF) at room temperature containing (in mm): 126 NaCl, 3 KCl, 2 MgSO4, 2 CaCl2, 10 glucose, 1.25 NaH2PO4, and 26 NaHCO3, equilibrated to a pH of 7.4 (with 95% O2, 5% CO2).
Whole-cell patch-clamp recordings were performed at room temperature. Pipette resistances varied between 3 and 6 MΩ when filled with an internal solution containing (in mm) 130 K-gluconate, 1 MgCl2, 3 Na2-ATP, 20 N-2-hydroxyethylpiperazine-N’-2-ethanesulfonic acid (HEPES), 10 ethylene glycol tetraacetic acid (EGTA), and 0.5% N-biotinyl-l-lysine (Biocytin; Sigma, Taufkirchen, Germany), pH 7.2. Slices were visualized with infrared difference interference contrast (IR DIC) optics with a Nikon Eclipse FN1 microscope (Amstelveen, The Netherlands) and a Nikon NIR Apo water immersion (60×/NA 1.0) objective and a CCD IR camera (VX45; Optronis, Kehl, Germany) (Nikon). Images were digitized with a USB 2.0 AV-converter (VRmAVC-1 PRO V.3; VRmagic, Mannheim, Germany). Currents were recorded with an EPC7 amplifier (HEKA Elektronik, Lambrecht, Germany) and data were stored using TIDA software (HEKA Elektronik), sampled at 1–30 kHz, and filtered at 10 kHz. Data were analyzed with Igor Pro 5.0.2.0 (WaveMetrics, Nimbus, Portland, OR, U.S.A.). Cells were held at −80 mV unless otherwise stated. To obtain whole cell current patterns, cells were depolarized and hyperpolarized between +20 mV and −160 mV (50 msec, 10 mV steps). To separate transient outward currents, 300 msec preconditioning pulses to −110 or −40 mV were applied prior to the test pulses, and current responses were subtracted at corresponding voltages.
Tracer coupling analysis
For coupling experiments, C57/BL6 mice were injected i.c.v. and sacrificed for acute slice preparation at 1 or 5 dpi. TR-albumin and NaCl injections were performed on littermates. GJC was assessed as previously described (Wallraff et al., 2004, 2006). Biocytin was added to the pipette solution (0.5%) and recordings were terminated after exactly 20 min. Immediately after recordings, slices were fixed in 4% PFA for 12–24 h, washed in 0.1 m PBS, and placed in blocking buffer (10% NGS, 2% Triton in 0.1 m PBS) for 2 h at room temperature. Slices were then incubated in 0.1 m PBS containing 1:100 streptavidin-Cy2 conjugate (Jackson Immunoresearch, Newmarket, United Kingdom), 2% NGS, and 0.1% TritonX-100 over night at 4°C on a shaker. The following day slices were washed, counterstained with Hoechst (10 min, 1:10 in distilled water; Invitrogen), washed again, and mounted in Aqua Poly/Mount (Poly-sciences, Eppelheim, Germany) for imaging with a Zeiss Axiophot microscope (Carl Zeiss, Oberkochen, Germany). Image stacks with 1-μm intervals were taken with a 20×/NA 0.8 Plan Apochromat objective, digital SPOT camera (Diagnostic Instruments, Sterling Heights, MI, U.S.A.), and MetaVue software (Universal Imaging Corporation, West Chester, U.S.A.). Image analysis was performed with Fiji software. Stacks were maximum-projected into a single plane and biocytin positive cells counted by a blinded person.
Semi-quantitative real time RT-PCR
DNA-free mRNA isolation and sqRT-PCR was performed as described previously (Seifert et al., 2009); see Supporting Information for further details.
Data analysis
Data are given as mean ± standard error of the mean (SEM). Differences between data were tested for significance using a paired or unpaired Student’s t-test. The level of significance was set at p < 0.05.
Results
Albumin is taken up by various cell types in vivo
Previous work has revealed that local neocortical BBB opening or direct application of serum albumin causes delayed hyperexcitability and epileptiform activity, both in vitro and in vivo (Ivens et al., 2007; Tomkins et al., 2007). Albumin was proposed to be taken up selectively by astrocytes, based on GFAP and MAP2 staining of acute slices. However, the authors also reported a GFAP-negative/MAP2-negative population of cells with clear albumin signal. To more closely examine the uptake of albumin in glial subtypes of the murine hippocampus in vivo, TR-Alb was stereotaxically injected into the lateral ventricle of anesthetized NG2kiEYFP mice. To avoid local damage, the injection site was chosen rostrally from the hippocampus. TR-Alb fluorescence within cells of the hippocampal CA1 area was analyzed by double immunohistochemistry against EYFP and S100β to visualize NG2 cells and astrocytes by confocal laser scanning microscopy. Astrocytes were defined as S100β-positive/NG2-negative cells. At 1 dpi, a total of 32 hippocampal sections from four mice were analyzed. Maximum projections of hippocampal slices (40 μm thick) revealed uptake of TR-Alb by astrocytes as well as NG2 cells (Fig. 1A). The cellular localization of TR-Alb was verified by scrolling through the stack of confocal images and analyzing colocalization in single optical sections. Figure 1B–D show single optical sections of exemplary cells. NG2 cells were found to prominently take up albumin, occasionally displaying strong TR-fluorescence throughout the soma (Fig. 1B) and in some processes. Frequently, TR-fluorescence in NG2 cells was punctate (Fig. 1C). A small population of weakly EYFP-positive and TR-Alb-negative cells, which occurred exclusively at 1 dpi, differed markedly in morphology from typical NG2 cells. These cells showed spherical cell bodies where the faint NG2 signal was limited to the soma sparing the nucleus (cf. Fig. 1C). These cells were not included in the further analyses. Astrocytes generally displayed punctate TR-fluorescence, which was usually peripheral, most often inside large proximal processes (Fig. 1D). At 5 dpi very faint TR-fluorescence signals were detected in both cell types (Fig. 2A). A total of 25 hippocampal sections from three mice were analyzed. TR-fluorescence in both NG2 cells and astrocytes was now generally punctate and peripheral. Only vascular TR signals remained strong (Fig. 2A, open arrow). Single optical sections of a typical NG2 cell and a typical astrocyte are displayed in Fig. 2B,C.
Figure 1.

TR-Alb is taken up by astrocytes, NG2-cells, and neurons in the CA1 region of the hippocampus. NG2kiEYFP mice were injected with TR-Alb, i.c.v., sacrificed at 1 dpi, stained against EYFP and S100β or NeuN, and confocally imaged. (A) Maximum projection of 26 optical sections through the SR of the CA1 in the rostral hippocampus. Fluorescence panels from left to right display TR-Alb (red), EYFP (blue), S100β (green), and merge. (B, C) Blow-ups of two single optical sections of two NG2 cells from A (arrowheads). (D) Single optical section of an astrocyte shown in A (open arrow). (E) Maximum projection of a NeuN staining in the CA1 pyramidal cell layer. (F) Blow-up of a single optical section of a neuron in E (arrow). Scale bars A, E: 40 μm; B–D, F: 10 μm.
Epilepsia © ILAE
Figure 2.

Cellular TR-Alb fluorescence has largely decreased at 5 dpi. NG2kiEYFP mice were injected with TR-Alb, i.c.v., sacrificed at 5 dpi, and stained against EYFP and S100β. (A) Maximum projection of 26 optical sections through the SR of the CA1 region in the rostral hippocampus. Fluorescence panels from left to right display TR-Alb (red), EYFP (blue), S100β (green) and merge. Open arrow indicates a blood vessel. (B, C) Single optical sections of an NG2-cell (arrow) and an astrocyte (arrow-head) shown in A. Scale bars A: 40 μm; B, C: 10 μm.
Epilepsia © ILAE
Clear TR-fluorescence was also observed in the CA1 pyramidal layer (Figs 1A and 2A). Neuronal localization of TR-Alb in CA1 neurons was confirmed with immunohistochemistry against NeuN (not shown). TR-Alb fluorescence intensity of neurons was generally higher than in astrocytes but lower than in NG2 cells. EYFP-positive pericytes (Ozerdem et al., 2001), which could be identified by their juxtaposition to vessels and elongated morphology, were also frequently TR-Alb positive. In our further analysis, we focussed on NG2 cells and astrocytes.
NG2 cells internalize TR-Alb more prominently than astrocytes
We quantified TR-Alb uptake by NG2 cells and astrocytes at 1 and 5 dpi with stereologic methods and densitometry. The stereologic methodology guarantees that effects such as cell swelling do not translate into higher cell counts. At 1 dpi a stack in each of 32 hippocampal sections from four mice (198 NG2 cells and 984 astrocytes) was counted. At 5 dpi a stack in each of 25 hippocampal sections from three mice (132 NG2 cells and 783 astrocytes) was counted. The percentage of TR-Alb positive cells among NG2 cells per slice was significantly higher than the proportion of TR-Alb positive cells among astrocytes (at 1 dpi: 94 ± 4.5% and 89 ± 4.4% for NG2 cells and astrocytes, respectively, p < 0.01; Fig. 3A). Both cell types showed significant declines of their TR-Alb positive subpopulations from 1 to 5 dpi, with NG2 cells losing albumin more rapidly than astrocytes (decline to 33 ± 21% and 54 ± 11% for NG2 cells and astrocytes, respectively, p < 0.001; Fig. 3A). The total number of either cell type did not differ between time points (6.2 ± 0.95 and 5.3 ± 1.42 NG2 cells per section at 1 and 5 dpi, respectively; 30.8 ± 2.96 and 31.3 ± 4.67 astrocytes per section at 1 and 5 dpi, respectively; Fig. 3B). We consistently noted higher TR-fluorescence intensities in NG2 cells than in astrocytes. To quantify this difference, variable regions of interest (ROIs) containing the somata and proximal processes of random NG2 cells were defined (Methods) and the fluorescence intensity per ROI was measured in AU. TR-Alb fluorescence intensity in NG2 cells was on average three times stronger than in astrocytes at 1 dpi (49.3 ± 10.84 AU in NG2 cells; 16.6 ± 3.95 AU in astrocytes; p < 0.05; Fig. 3C). This difference disappeared by 5 dpi (5.3 ± 2 AU in NG2 cells vs. 6.2 ± 1.97 AU in astrocytes).
Figure 3.

Quantitative analysis of TR-Alb uptake and fluorescence loss in astrocytes and NG2 cells. Light and dark grey bars represent cells of mice sacrificed at 1 and 5 dpi, respectively. (A) Percentage of TR-Alb positive cells among NG2 cells and astrocytes. (B) Average number of cells within the CA1 SR per 40 μm section. Cell numbers were determined stereologically by confocal laser scanning microscopy. One day post injection: n = 32 sections, four mice; 5 dpi: n = 25 sections, three mice (C) Average fluorescence intensity per cell in AU. n = 15 cells in three sections of three mice for each condition; *p < 0.05, **p < 0.01, ***p < 0.001.
Epilepsia © ILAE
Uptake of albumin does not alter electrophysiologic properties of astrocytes or NG2 cells
To assess electrophysiologic properties of TR-Alb positive cells, acute slices were prepared from C57/Bl6 and NG2kiEYFP mice. TR-Alb positive glial cells within the CA1 SR were identified morphologically by IR-DIC and fluorescence microscopy. The selected cells displayed two distinct whole-cell current patterns corresponding to NG2/GluR cells and astrocytes as described previously (Fig. 4A,C; Jabs et al., 2005; Karram et al., 2008; Matthias et al., 2003; Wallraff et al., 2004). In a few cases, current patterns of TR-Alb positive cells resembled those described for microglial cells (not shown; Boucsein et al., 2000); these cells were not considered in the further analysis. During recording the cells were filled with biocytin in order to reveal their morphology and test for GJC. NG2 cells were identified by their typical time- and voltage-dependent current patterns (Fig. 4A), EYFP fluorescence, or postrecording immunohistochemistry (not shown). At 1 dpi, TR-Alb-positive/EYFP-positive and NG2 cells from NaCl controls did not differ in input resistance (32 ± 14.1 MΩ, n = 9 vs. 44 ± 9.4 MΩ n = 12) and resting potentials (−79 ± 2.6 mV, n = 8 vs. −81 ± 3.9 mV, n = 8). All NG2 cells displayed transient K+ outward currents with peak current densities not differing between albumin- and NaCl-injected animals (83.0 ± 16.0 pA/pF, n = 9 vs. 59.8 ± 15.3 pA/pF, n = 8, respectively; V = +20 mV). Similarly, the density of Kir currents was not affected by albumin at 1 dpi (40.0 ± 5.4, n = 10 vs. 31.1 ± 3.0 pA/pF, n = 9 for TR-Alb-positive/EYFP-positive and NG2 cells from NaCl controls, respectively; V = −130 mV). These biocytin-filled cells with complex current patterns showed a typical NG2 cell morphology, with radially spreading varicosity-bearing processes and absence of tracer coupling (Fig. 4B).
Figure 4.
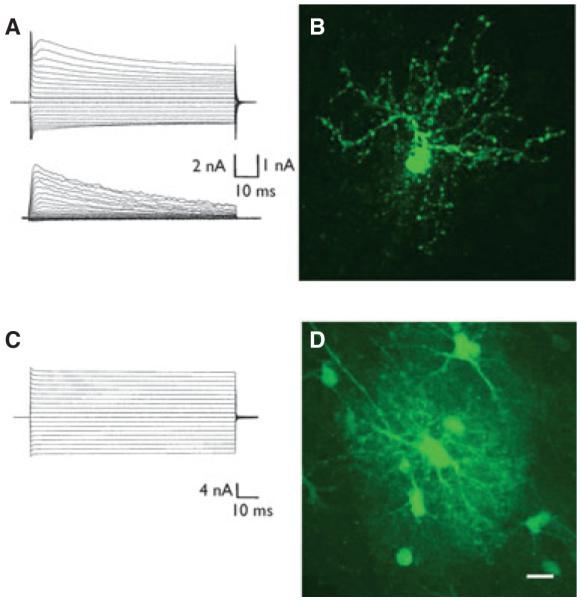
Functional and morphological characteristics of TR-Alb positive glial cells at 1 dpi. TR-Alb positive cells in the CA1 SR were identified by fluorescence and IR DIC microscopy. During patch-clamp recording cells were filled with 0.5% biocytin. (A) Complex whole cell current pattern of a TR-Alb positive cell (de- and hyperpolarization between −160 and +20 mV; holding potential −80 mV, 10 mV voltage step increments) (top panel). Subtraction of corresponding currents after applying prepulse protocols (see Methods) isolated transient outwardly rectifying K+ currents (bottom). (B) After 20 min of recording the slice was fixated and stained against biocytin. The cell in (A) shows the typical morphology of an NG2 cell. (C) The stimulus protocol described in (A) was applied to another TR-Alb positive cell that showed a passive current pattern. The cell was filled with biocytin during recording. (D) Postrecording biocytin immunocytochemistry of the cell in (C) revealed a typical astroglial morphology and GJC. Scale bars: 10 μm.
Epilepsia © ILAE
Astrocytes displayed time- and voltage-independent current patterns (Fig. 4C). Resting potential and input resistance of astrocytes were unaltered by albumin at both time points. The average resting potential was −76 ± 1.4 mV, n = 15 vs. −80 ± 1.5 mV, n = 13 at 1 dpi and −82 ± 0.6 mV, n = 10 vs. −82 ± 0.9 mV, n = 10 at 5 dpi for TR-Alb and NaCl injected animals, respectively. The average input resistance was 2.9 ± 0.4 MΩ, n = 15 versus 3.6 ± 0.6 MΩ, n = 13 at 1 dpi and 3.1 ± 0.4 MΩ, n = 10 versus 2.1 ± 0.26 MΩ, n = 10 at 5 dpi for TR-Alb- and NaCl-injected animals, respectively. Postrecording staining against biocytin demonstrated the typical astrocyte morphology with a sponge-like net of processes and abundant tracer coupling (Figs. 4D and 5).
Figure 5.
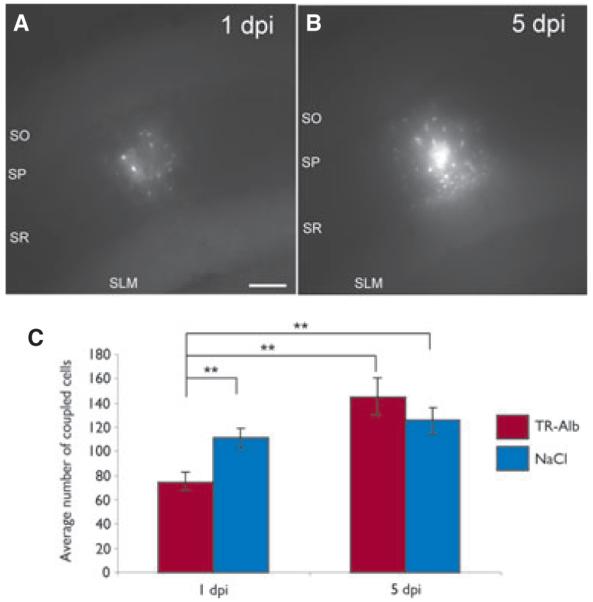
TR-Alb induced a transient decrease of astrocytic GJC. (A, B) Biocytin spread after 20 min of biocytin filling of TR-Alb positive astrocytes at 1 and 5 dpi. Maximum projections of representative coupling clouds. (C) Quantification of tracer coupling per loaded astrocyte. As a control, NaCl instead of TR-Alb was injected i.c.v. **p < 0.01; scale bar 100 μm.
Epilepsia © ILAE
Astrocytic uptake of albumin decreases gap junction coupling
Previous work has shown that 1 day following in vivo application of albumin, astroglial connexin transcript levels in the cortex are decreased (Cacheaux et al., 2009). To determine whether these changes on the mRNA level occur also in the hippocampus and are accompanied by alterations in GJC, astrocytic tracer coupling was analyzed in TR-Alb- and NaCl-injected mice at 1 and 5 dpi. TR-Alb-positive cells and cells from NaCl-injected animals, all displaying passive current patterns, were filled with biocytin (20 min) during patch-clamp recording. At 1 dpi of TR-Alb, the number of tracer coupled cells in the hippocampus was reduced by 33% (75 ± 7 cells, n = 29 filled cells vs. 111 ± 8 cells, n = 32 for TR-Alb and NaCl injected animals, respectively, p < 0.01, Fig. 5). However, by 5 dpi, this difference between TR-Alb-injected and control animals disappeared (145 ± 16 cells, n = 10 and 126 ± 11 cells, n = 10 for TR-Alb and NaCl injection, respectively; Fig. 5C).
In parallel we also analyzed Cx43 mRNA expression in different subregions of the hippocampus with sqRT-PCR by determining Cx43 to β-actin ratios. None of the investigated regions showed altered Cx43 transcript levels 1 or 5 dpi of TR-Alb (Table S1).
Time-dependent regulation of Kir4.1 transcripts after albumin injection
In the cortex, albumin led to a down-regulation of Kir4.1 channels, which are involved in K+ buffering (Ivens et al., 2007; Cacheaux et al., 2009). We compared Kir4.1 mRNA levels in hippocampal subregions 1 and 5 dpi. At 1 dpi, sqRT-PCR revealed up-regulation of Kir4.1 in the SR, whereas the other regions displayed no changes. At 5 dpi, Kir4.1 levels in the SR significantly declined below control levels, whereas the other hippocampal subregions showed no changes (Table S2).
Discussion
Albumin extravasation is involved in the generation of epilepsy after BBB disruption (Seiffert et al., 2004), although the underlying cellular mechanisms are poorly understood. Our data confirm that following transient, single application to an otherwise unchanged environment, albumin is taken up by various cell types within the brain. Astrocytic internalization is in accordance with reports on uptake of endogenous albumin in experimental epilepsy and patients with intractable TLE (Van Vliet et al., 2007), exposure of acute brain slices to albumin (Ivens et al., 2007), or patients with epilepsy due to vascular malformations (Raabe et al., 2012). However, in contrast to the findings of Ivens et al. (2007) but in accordance with Van Vliet et al. (2007), we also found neuronal uptake of albumin. This difference might be explained by different experimental approaches such as the mode of albumin application (in situ vs. in vivo). Furthermore, we describe for the first time, a pronounced albumin uptake by gray matter NG2 cells. These cells are now considered a distinct glial cell type, although little is known about their functions (Nishiyama et al., 2009; Bergles et al., 2010). Of interest, however, NG2 cells respond to BBB disruption or application of transforming growth factor (TGF)-β1 (Rhodes et al., 2006), an agonist of TGF-β receptors, which were thought to mediate albumin uptake into astrocytes (Ivens et al., 2007). It has been suggested that after lesions to the brain some NG2 cells express GFAP (Komitova et al., 2011) and might contribute to formation of the glial scar (Alonso, 2005). Fate mapping analysis has demonstrated the ability of NG2 cells to differentiate into astrocytes even in the normal adult gray matter (Dimou et al., 2008). The punctate, peripheral intracellular pattern of TR-fluorescence found here supports the notion of albumin localization within cellular compartments, and the marked decrease of TR-fluorescence at 5 dpi may reflect its degradation by this time point.
Increasing evidence suggests a role for dysfunctional glial cells in neurologic disorders, including epilepsy (Seifert et al., 2006). Specifically, impaired K+ buffering and GJC might be involved in the generation and spread of seizure activity (Seifert et al., 2010). To investigate putative functional changes within the time window reported for experimental albumin-mediated epileptogenesis, we conducted patch-clamp and tracer-coupling experiments at 1 and 5 dpi. No changes in electrophysiologic characteristics were found in astrocytes or NG2 cells at either time point. However, the low input resistance of astrocytes and possibly also adult NG2 cells may have imposed improper clamp control so that these data have to be interpreted with caution. We noted that the input resistance of NG2 cells in the present study was lower than previously reported, which might be due to the older age investigated here (Kressin et al., 1995; Bordey & Sontheimer, 1997). Note that from today’s perspective, many of the more mature cells with complex current pattern in the latter two studies probably were NG2 cells rather than astrocytes (see Bergles et al. (2010) for discussion).
In astrocytes, the predominantly expressed Kir-channel subunit Kir4.1 (Seifert et al., 2009) is crucial for K+ buffering (Olsen & Sontheimer, 2008). Likewise, K+ buffering in the hippocampus critically depends on proper Cx30/43–mediated GJC (Wallraff et al., 2006). Down-regulation of Kir currents, probably mediated through Kir4.1 channels, has been reported in patients with epilepsy who present with hippocampal sclerosis (Hinterkeuser et al., 2000; Kivi et al., 2000; Schröder et al., 2000). Albumin application, within 2 days, led to down-regulation of Kir4.1 mRNA and protein levels in rat neocortical astrocytes, in concert with a decreased clearance of [K+]o probably due to reduced Kir currents (Ivens et al., 2007; Cacheaux et al., 2009). Focusing on the mouse hippocampus, we found a 46% down-regulation of Kir4.1 mRNA levels in the CA1 SR at 5 dpi while transcripts were enhanced at 1 dpi. The reason for this difference is unknown, but there is increasing evidence for brain region–dependent functional heterogeneity among astrocytes (Matyash & Kettenmann, 2010). In addition, species differences (rat vs. mouse) cannot be excluded. Notably, we observed no changes in Kir4.1 mRNA levels in the SLM. Immunohistochemistry has found higher Kir4.1 protein levels in the adult SR compared with the SLM (Hsu et al., 2011), which might explain a stronger regulatory effect of albumin in the former. The selective regulation by albumin of Kir4.1 in the SR also indicates heterogeneity among astrocytes (Matyash & Kettenmann, 2010). In this context it is also interesting to note that genetic ablation of astrocytic connexins revealed GJC-dependent K+ buffering in the SLM, whereas in the SR Kir4.1 channels probably mediated K+ clearance through a mechanism called “indirect coupling” (Wallraff et al., 2006). However, the fact that NG2 cells also express Kir4.1 (Schröder et al., 2002) limits interpretation of our transcript data.
We report herein that transient albumin application to the hippocampus entails a decrease in astrocyte gap junction coupling at 1 dpi, which recovered by 5 dpi. This finding is in line with microarray data on the regulation of Cx43 in the cortex (Cacheaux et al., 2009), although in the hippocampus our sqRT-PCR did not reveal changes in Cx43 expression between albumin- and control-injected animals. Posttranslational modification, for example, altered phosphorylation (Solan & Lampe, 2009) rather than changes in transcript levels, might be important in determining the efficiency of coupling. The role of astrocytic GJC in epilepsy is still ambiguous (Seifert et al., 2010). On the one hand, deletion of Cx30/43 impairs K+ buffering and can be expected to exert a proepileptic action (Wallraff et al., 2006), but down-regulation of coupling also inhibits energy supply to neurons that would have antiepileptic effects (Rouach et al., 2008). Therefore, the outcome of changes in coupling may critically depend on the duration/strength of seizure activity and the particular energetic needs of the local networks affected. Our finding of impaired GJC at 1 dpi might be particularly relevant to the chronic phase of human TLE, where strong albumin extravasation in the hippocampus has been found (Van Vliet et al., 2007).
In conclusion, the present study demonstrates that transient exposure of temporal lobe structures to albumin induces transient changes of astrocyte function within the hippocampus, which can be expected to impair ion and transmitter homeostasis and contribute to hyperactivity and epileptogenesis. Extravasal albumin is also present in hippocampal tissue from patients with chronic TLE. Therefore, astrocytes may represent alternative targets for antiepileptic therapeutic approaches. Future work has to reveal how internalization of albumin into astrocytes and NG2 cells contributes to the massive morphologic and functional changes seen in chronic epileptic tissue.
Supplementary Material
Acknowledgments
This work was supported by grants of the German Research Foundation (SFB/TR3, SPP1172) and the European Community (FP7-202167 Neuro-Glia). We thank Jacqueline Trotter (Mainz), for providing NG2kiEYFP mice, Ina Fiedler (Bonn) for excellent technical assistance, and Annamaria Vezzani (Milan) for comments on the manuscript.
Footnotes
Disclosure None of the authors has any conflict of interest to disclose. All the authors have read the Journal’s position on issues involved in ethical publication and affirm that this report is consistent with those guidelines.
Supporting Information Additional Supporting Information may be found in the online version of this article:
Please note: Wiley-Blackwell is not responsible for the content or functionality of any supporting information supplied by the authors. Any queries (other than missing material) should be directed to the corresponding author for the article.
References
- Alonso G. NG2 proteoglycan-expressing cells of the adult rat brain: possible involvement in the formation of glial scar astrocytes following stab wound. Glia. 2005;49:318–338. doi: 10.1002/glia.20121. [DOI] [PubMed] [Google Scholar]
- Bergles DE, Jabs R, Steinhäuser C. Neuron-glia synapses in the brain. Brain Res Rev. 2010;63:130–137. doi: 10.1016/j.brainresrev.2009.12.003. [DOI] [PMC free article] [PubMed] [Google Scholar]
- Bordey A, Sontheimer H. Postnatal development of ionic currents in rat hippocampal astrocytes in situ. J Neurophysiol. 1997;78:461–477. doi: 10.1152/jn.1997.78.1.461. [DOI] [PubMed] [Google Scholar]
- Boucsein C, Kettenmann H, Nolte C. Electrophysiological properties of microglial cells in normal and pathologic rat brain slices. Eur J Neurosci. 2000;12:2049–2058. doi: 10.1046/j.1460-9568.2000.00100.x. [DOI] [PubMed] [Google Scholar]
- Cacheaux LP, Ivens S, David Y, Lakhter AJ, Bar-Klain G, Shapira M, Heinemann U, Friedman A, Kaufer D. Transcriptome profiling reveals TGF-ß signaling involvement in epileptogenesis. J Neurosci. 2009;29:8927–8935. doi: 10.1523/JNEUROSCI.0430-09.2009. [DOI] [PMC free article] [PubMed] [Google Scholar]
- Danbolt NC. Glutamate uptake. Prog Neurobiol. 2001;65:1–105. doi: 10.1016/s0301-0082(00)00067-8. [DOI] [PubMed] [Google Scholar]
- Dimou L, Simon C, Kirchhoff F, Takebayashi H, Götz M. Progeny of Olig2-expressing progenitors in the gray and white matter of the adult mouse cerebral cortex. J Neurosci. 2008;28:10434–10442. doi: 10.1523/JNEUROSCI.2831-08.2008. [DOI] [PMC free article] [PubMed] [Google Scholar]
- Friedman A, Kaufer D, Heinemann U. Blood–brain barrier breakdown-inducing astrocytic transformation: novel targets for the prevention of epilepsy. Epilepsy Res. 2009;85:142–149. doi: 10.1016/j.eplepsyres.2009.03.005. [DOI] [PMC free article] [PubMed] [Google Scholar]
- Hinterkeuser S, Schröder W, Hager G, Seifert G, Blümcke I, Elger CE, Schramm J, Steinhäuser C. Astrocytes in the hippocampus of patients with temporal lobe epilepsy display changes in potassium conductances. Eur J Neurosci. 2000;12:2087–2096. doi: 10.1046/j.1460-9568.2000.00104.x. [DOI] [PubMed] [Google Scholar]
- Hsu MS, Seldin M, Lee DJ, Seifert G, Steinhäuser C, Binder DK. Laminar-specific and developmental expression of aquaporin-4 in the mouse hippocampus. Neuroscience. 2011;178:21–32. doi: 10.1016/j.neuroscience.2011.01.020. [DOI] [PMC free article] [PubMed] [Google Scholar]
- Ivens S, Kaufer D, Flores LP, Bechmann I, Zumsteg D, Tomkins O, Seiffert E, Heinemann U, Friedman A. TGF-beta receptor-mediated albumin uptake into astrocytes is involved in neocortical epileptogenesis. Brain. 2007;130:535–547. doi: 10.1093/brain/awl317. [DOI] [PubMed] [Google Scholar]
- Jabs R, Pivneva T, Hüttmann K, Wyczynski A, Nolte C, Kettenmann H, Steinhäuser C. Synaptic transmission onto hippocampal glial cells with hGFAP promoter activity. J Cell Sci. 2005;118:3791–3803. doi: 10.1242/jcs.02515. [DOI] [PubMed] [Google Scholar]
- Karram K, Goebbels S, Schwab M, Jennissen K, Seifert G, Steinhäuser C, Nave KA, Trotter J. NG2-expressing cells in the nervous system revealed by the NG2-EYFP-knockin mouse. Genesis. 2008;46:743–757. doi: 10.1002/dvg.20440. [DOI] [PubMed] [Google Scholar]
- Kivi A, Lehmann TN, Kovacs R, Eilers A, Jauch R, Meencke HJ, Von Deimling A, Heinemann U, Gabriel S. Effects of barium on stimulus-induced rises of [K+]o in human epileptic non-sclerotic and sclerotic hippocampal area CA1. Eur J Neurosci. 2000;12:2039–2048. doi: 10.1046/j.1460-9568.2000.00103.x. [DOI] [PubMed] [Google Scholar]
- Kofuji P, Newman EA. Potassium buffering in the central nervous system. Neuroscience. 2004;129:1045–1056. doi: 10.1016/j.neuroscience.2004.06.008. [DOI] [PMC free article] [PubMed] [Google Scholar]
- Komitova M, Serwanski DR, Lu QR, Nishiyama A. NG2 cells are not a major source of reactive astrocytes after neocortical stab wound injury. Glia. 2011;59:800–809. doi: 10.1002/glia.21152. [DOI] [PMC free article] [PubMed] [Google Scholar]
- Kressin K, Kuprijanova E, Jabs R, Seifert G, Steinh user C. Developmental regulation of Na+ and K+ conductances in glial cells of mouse hippocampal brain slices. Glia. 1995;15:173–187. doi: 10.1002/glia.440150210. [DOI] [PubMed] [Google Scholar]
- Matthias K, Kirchhoff F, Seifert G, Hüttmann K, Matyash M, Kettenmann H, Steinhäuser C. Segregated expression of AMPA-type glutamate receptors and glutamate transporters defines distinct astrocyte populations in the mouse hippocampus. J Neurosci. 2003;23:1750–1758. doi: 10.1523/JNEUROSCI.23-05-01750.2003. [DOI] [PMC free article] [PubMed] [Google Scholar]
- Matyash V, Kettenmann H. Heterogeneity in astrocyte morphology and physiology. Brain Res Rev. 2010;63:2–10. doi: 10.1016/j.brainresrev.2009.12.001. [DOI] [PubMed] [Google Scholar]
- Nishiyama A, Komitova M, Suzuki R, Zhu X. Polydendrocytes (NG2 cells): multifunctional cells with lineage plasticity. Nat Rev Neurosci. 2009;10:9–22. doi: 10.1038/nrn2495. [DOI] [PubMed] [Google Scholar]
- Oby E, Janigro D. The blood–brain barrier and epilepsy. Epilepsia. 2006;47:1761–1774. doi: 10.1111/j.1528-1167.2006.00817.x. [DOI] [PubMed] [Google Scholar]
- Olsen M, Sontheimer H. Functional implications for Kir4.1 channels in glial biology: from K+ buffering to cell differentiation. J Neurochem. 2008;107:589–601. doi: 10.1111/j.1471-4159.2008.05615.x. [DOI] [PMC free article] [PubMed] [Google Scholar]
- Ozerdem U, Grako KA, Hlin-Huppe K, Monosov E, Stallcup WB. NG2 proteoglycan is expressed exclusively by mural cells during vascular morphogenesis. Dev Dyn. 2001;222:218–227. doi: 10.1002/dvdy.1200. [DOI] [PubMed] [Google Scholar]
- Peterson DA. Quantitative histology using confocal microscopy: implementation of unbiased stereology procedures. Methods. 1999;18:493–507. doi: 10.1006/meth.1999.0818. [DOI] [PubMed] [Google Scholar]
- Raabe A, Schmitz AK, Pernhorst K, Grote A, von der Brelie C, Urbach H, Friedman A, Becker AJ, Elger CE, Niehusmann P. Cliniconeuropathologic correlations show astroglial albumin storage as a common factor in epileptogenic vascular lesions. Epilepsia. 2012;53:539–548. doi: 10.1111/j.1528-1167.2012.03405.x. [DOI] [PMC free article] [PubMed] [Google Scholar]
- Rhodes KE, Raivich G, Fawcett JW. The injury response of oligodendrocyte precursor cells is induced by platelets, macrophages and inflammation-associated cytokines. Neuroscience. 2006;140:87–100. doi: 10.1016/j.neuroscience.2006.01.055. [DOI] [PubMed] [Google Scholar]
- Rouach N, Koulakoff A, Abudara V, Willecke K, Giaume C. Astroglial metabolic networks sustain hippocampal synaptic transmission. Science. 2008;322:1551–1555. doi: 10.1126/science.1164022. [DOI] [PubMed] [Google Scholar]
- Schröder W, Hinterkeuser S, Seifert G, Schramm J, Jabs R, Wilkin GP, Steinhäuser C. Functional and molecular properties of human astrocytes in acute hippocampal slices obtained from patients with temporal lobe epilepsy. Epilepsia. 2000;41:S181–S184. doi: 10.1111/j.1528-1157.2000.tb01578.x. [DOI] [PubMed] [Google Scholar]
- Schröder W, Seifert G, Hüttmann K, Hinterkeuser S, Steinhäuser C. AMPA receptor-mediated modulation of inward rectifier K+ channels in astrocytes of mouse hippocampus. Mol Cell Neurosci. 2002;19:447–458. doi: 10.1006/mcne.2001.1080. [DOI] [PubMed] [Google Scholar]
- Seifert G, Schilling K, Steinhäuser C. Astrocyte dysfunction in neurological disorders: a molecular perspective. Nat Rev Neurosci. 2006;7:194–206. doi: 10.1038/nrn1870. [DOI] [PubMed] [Google Scholar]
- Seifert G, Hüttmann K, Binder DK, Hartmann C, Wyczynski A, Neusch C, Steinh user C. Analysis of astroglial K+ channel expression in the developing hippocampus reveals a predominant role of the Kir4.1 subunit. J Neurosci. 2009;29:7474–7488. doi: 10.1523/JNEUROSCI.3790-08.2009. [DOI] [PMC free article] [PubMed] [Google Scholar]
- Seifert G, Carmignoto G, Steinhäuser C. Astrocyte dysfunction in epilepsy. Brain Res Rev. 2010;63:212–221. doi: 10.1016/j.brainresrev.2009.10.004. [DOI] [PubMed] [Google Scholar]
- Seiffert E, Dreier JP, Ivens S, Bechmann I, Tomkins O, Heinemann U, Friedman A. Lasting blood–brain barrier disruption induces epileptic focus in the rat somatosensory cortex. J Neurosci. 2004;24:7829–7836. doi: 10.1523/JNEUROSCI.1751-04.2004. [DOI] [PMC free article] [PubMed] [Google Scholar]
- Solan JL, Lampe PD. Connexin43 phosphorylation: structural changes and biological effects. Biochem J. 2009;419:261–272. doi: 10.1042/BJ20082319. [DOI] [PMC free article] [PubMed] [Google Scholar]
- Tomkins O, Friedman O, Ivens S, Reiffurth C, Major S, Dreier JP, Heinemann U, Friedman A. Blood–brain barrier disruption results in delayed functional and structural alterations in the rat neocortex. Neurobiol Dis. 2007;25:367–377. doi: 10.1016/j.nbd.2006.10.006. [DOI] [PubMed] [Google Scholar]
- Van Vliet EA, da Costa AS, Redeker S, van Schaik R, Aronica E, Gorter JA. Blood–brain barrier leakage may lead to progression of temporal lobe epilepsy. Brain. 2007;130:521–534. doi: 10.1093/brain/awl318. [DOI] [PubMed] [Google Scholar]
- Wallraff A, Odermatt B, Willecke K, Steinhäuser C. Distinct types of astroglial cells in the hippocampus differ in gap junction coupling. Glia. 2004;48:36–43. doi: 10.1002/glia.20040. [DOI] [PubMed] [Google Scholar]
- Wallraff A, Köhling R, Heinemann U, Theis M, Willecke K, Steinhäuser C. The impact of astrocytic gap junctional coupling on potassium buffering in the hippocampus. J Neurosci. 2006;26:5438–5447. doi: 10.1523/JNEUROSCI.0037-06.2006. [DOI] [PMC free article] [PubMed] [Google Scholar]
Associated Data
This section collects any data citations, data availability statements, or supplementary materials included in this article.