

Abstract
Self-assembling multidomain peptides have been shown to have desirable properties, such as the ability to form hydrogels that rapidly recover following shear-thinning and the potential to be tailored by amino acid selection to vary their elasticity and encapsulate and deliver proteins and cells. Here we describe the effects of substitution of aliphatic hydrophobic amino acids in the central domain of the peptide for the aromatic amino acids phenylalanine, tyrosine and tryptophan. While the basic nanofibrous morphology is retained in all cases, selection of the particular core residues results in switching from anti-parallel hydrogen bonding to parallel hydrogen bonding in addition to changes in nanofiber morphology and in hydrogel rheological properties. Peptide nanofiber assemblies are investigated by circular dichroism polarimetry, infrared spectroscopy, atomic force microscopy, transmission and scanning electron microscopy, oscillatory rheology and molecular dynamics simulations. Results from this study will aid in designing next generation cell scaffolding materials.
INTRODUCTION
Self-assembling peptides have been used to form a variety of novel nanostructures. The large number of amino acids available, both natural and synthetic, allow the utilization of a wide variety of interactions to drive the self-assembly process1–9. Many of these nanostructures result in the formation of hydrogels, which can be used for important biological applications, including tissue engineering scaffolds10 and matrices for drug and cytokine release11. Multidomain peptides in particular have shown promise in both of these areas12–17 and are also able to be crosslinked for improved mechanical properties,18, 19 as well as incorporate enzyme degradation cell recognition sequences12, 20. This flexibility comes from the design criteria for β-sheet based nanofibers which tolerate a broad selection of amino acids.
Multidomain peptides consist of an ABA block motif.21 The primary driving forces for MDP self-assembly is found in the central B block which is composed of alternating hydrophilic and hydrophobic amino acids. From the library of peptides we have previously prepared and related sequences found in the literature, nearly any amino acid can be in this region as long as the alternating preference for water is preserved. 15, 18–21 This alternation creates a facial amphiphile when the peptide is in an extended β-sheet conformation. The formation of a β-sheet hydrogen bonding network is reinforced and stabilized by the packing of the hydrophobic faces of these peptides to one another creating a peptide nanofiber composed of two isolated hydrogen bonding networks. The interface between these hydrogen bonding networks, or tapes, is mediated by the packing of the hydrophobic amino acids. Thus the growth of the fiber is driven by the formation of a hydrogen bond network parallel to the fiber axis and perpendicular to the peptide backbone and is strongly stabilized by the hydrophobic packing between tapes. See scheme 1. The peripheral A block of the MDPs is used to mediate the assembly of the peptide through electrostatic interactions derived from the selection of charged amino acids such as lysine. Without this region the peptide would be highly insoluble and very difficult to work with. At the same time these charges provide a handle to control self-assembly through the use of pH, or complimentary ions. Nanofiber formation of multidomain peptides is a highly conserved characteristic for this design motif and is correlated with a β-sheet secondary structure. However, nanofiber morphology, as well as rheological properties of the peptide hydrogels, can be highly sensitive to specific amino acid selection18. Here we examine the contribution of aromatic amino acids, including phenylalanine, tyrosine and tryptophan in the B block to peptide selfassembly (Table 1).
Scheme 1.
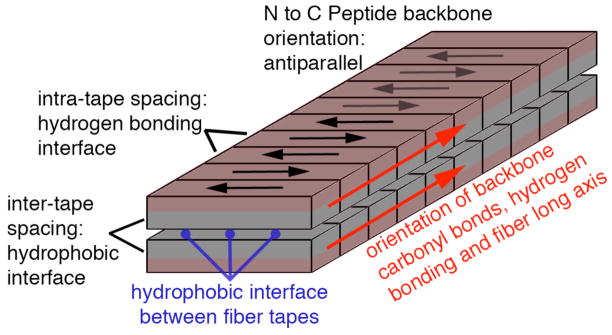
Diagram of the organization of the MDP nanofiber organization. The nanofiber forms through the assembly of peptides stabilized by β-sheet hydrogen bonding down the long axis of the structure. This tape-like structure has a hydrophilic face and hydrophobic face. Two such tapes assemble to bury the hydrophobic interface and present hydrophilic and charged amino acids to the aqueous environment.
Table 1.
Sequences of multidomain peptides studied.
| Peptide | Abbreviation | Sequence |
|---|---|---|
| 1 | QL | K2(QL)6K2 |
| 2 | QFQL | K2(QFQL)3K2 |
| 3 | QF | K2(QF)6K2 |
| 4 | QW | K2(QW)6K2 |
| 5 | QY | K2(QY)6K2 |
Synthetic peptides containing aromatic amino acids have been previously shown to have novel self-assembly properties.22–26 The contribution of phenylalanine residues in particular is of interest because phenylalanine residues are prevalent in amyloid β, a protein that plays a crucial role in the development of Alzheimer’s disease. In these structures, the individual β-sheet peptides (e.g. amyloid β or Aβ) assemble so that the peptide backbones are perpendicular to the fiber axis27, much like in our system. It has been determined that a short region of the amyloid β protein is essential for the nucleation of self-assembled amyloid β fibrils. This region includes residues Aβ 16–20, KLVFF, which is known to self-assemble in a β-sheet fashion to form amyloid fibers28. While the presence of phenylalanine in amyloid β appears to be crucial to fibril nucleation29, its exact contribution is still being investigated 30. Efforts to synthetically recreate amyloid β-like fibrils have lent support to the importance of phenylalanine in the fibril formation process24, 25, 31.
The first generation of multidomain peptides employed lysine residues for the peripheral (A) block of the peptide and a glutamine-leucine repeat for the central (B) block of the peptide (peptide 1, Table 1). It was shown that two lysine residues and six glutamine-leucine repeats afforded optimal self-assembly properties, resulting in the formation of distinct nanofibers21. In this system, charged lysine residues repel one another, while aliphatic leucine residues pack together in the hydrophobic interior of the nanofibers, between tapes, resulting in linear yet relatively short fibers that are visible via vitreous ice cryo-transmission electron microscopy. Here we examine the substitution of leucine residues with the aromatic residues phenylalanine, tyrosine, and tryptophan. The introduction of aromatic amino acids into this design changes the shape and steric bulk of the hydrophobic region and also allows for the possibility of π-π stacking interactions to direct or modify self-assembly. The number and type of charged residues were kept constant to examine the effect of the hydrophobic amino acid alone.
METHODS
Peptide Synthesis and characterization
Multidomain peptides were synthesized by traditional solid-phase peptide synthesis, as reported previously,21 with one modification: a Rink Amide MBHA low loading resin was used in place of a traditional Rink Amide MBHA resin. This resulted in higher yields than those obtained with standard resins. The N-terminus was acetylated with acetic anhydride prior to cleavage from the resin. MALDI-TOF mass spectrometry was performed on the crude products. If the desired product was present without deletions, peptides were purified by dialysis in membranes with a 500–1000 MWCO. These membranes were clipped on both ends with dialysis clips after being filled with an aqueous solution of crude peptide, and the resulting bags were dialyzed for 48 hours. The solution was then drained from the bags and lyophilized. Syntheses that yielded peptides with deletions present were purified by HPLC using a Varian PrepStar. Purified peptides were subsequently characterized by MALDI-TOF mass spectrometry.
Peptide Gelation
A 2 wt% solution of each peptide was prepared and adjusted with NaOH to pH 7. To this solution was added an equal volume of 2x phosphate buffered saline (PBS) to make a final solution of peptide at 1% by weight, pH 7.4. The vial was capped, shaken briefly, and sonicated to obtain a uniform gel. For circular dichroism measurements, phosphate buffer at pH 7.4 alone was used to gel the peptides.
Atomic Force Microscopy
1 wt% peptide solutions at pH 7 were diluted to a concentration of 0.01–0.05 wt% with ultra pure water. Approximately 5–7 μL of these solutions were dropped onto freshly cleaved mica while spinning on a Headway Research, Inc. Photo-resist spinner. The sample was rinsed with deionized water for 4–5 seconds, spun for an additional 10 minutes, and stored in air prior to imaging. AFM images were collected in air, at ambient temperature, on a Digital Instruments Nanoscope IIIa atomic force microscope in tapping mode. Data was collected in height and amplitude channels. Height profiles were taken using Nanoscope software.
Cryo Transmission Electron Microscopy (cryo-TEM)
Vitreous ice cryo-TEM samples were prepared using a controlled environment vitrification system (Vitrobot, FEI). 2.6 μl of 1 wt% peptide solution or peptide gel were pipetted onto a holey carbon grid (Quantifoil R1.2/1.3) and blotted with filter paper (Ted Pella, Inc.) for 1 second. The sample then was quickly plunged into liquid ethane. Next it was transferred from liquid ethane to liquid nitrogen for storage. Finally, it was transferred to a Gatan cryoholder (Gatan626DH) and imaged on a JEOL 2010 TEM at 200.0 kV and −176 °C, equipped with a Gatan CCD camera and Gatan Digital Micrograph.
Circular Dichroism Spectroscopy
CD spectra were recorded using a Jasco-810 spectropolarimeter. For non-gelled peptides, samples at 1 wt% and pH 7 (adjusted with NaOH when necessary) were placed in a quartz cuvette with a path length of 0.001 cm. Gelled samples were measured in phosphate rather than PBS because circular dichroism does not tolerate the high concentrations of PBS in gelled samples. Therefore, gelled samples were made in 10 mM phosphate. Spectra were recorded at room temperature from 250 to 180 nm, with a 0.2 nm data pitch and a scan rate of 50 nm/min. Milidegrees of rotation were converted to molar residual ellipticity (MRE).
Grazing Angle FT-IR
5–10 μL of 1 wt% peptide solution at pH 7 was dried onto a gold mirror. Spectra were then recorded with a 80Spec specular reflectance accessory (PIKE Technologies) on a Jasco FT/IR-660 spectrometer. Collected spectra were linear baseline corrected and subsequently deconvoluted by fitting with a mixed Gaussian/Lorentzian by a least squares method. Assignments of decovoluted peaks are given in the supporting information.
Rheometry
Rheological measurements were taken using a TA Instruments AR-G2 rheometer. Approximately 20 μL of peptide solution were placed within a preset gap of 250 μm on an 8 mm steel parallel plate geometry. Time sweep tests were performed at 25 °C to determine the initial stability of the gels. It was determined that gels were stable over the time period needed to perform subsequent tests. Frequency sweeps were then performed at 25 °C to determine the linear viscoelastic region (LVR). A dynamic strain sweep was performed at a frequency within the LVR to determine the elastic and viscous moduli. Figure 8 reports the G′ and G″ at a frequency of 1 rad/sec and a strain of 1%.
Figure 8.

G′ and G″ for hydrogels prepared from each peptide in10 mM phosphate buffer, and PBS both at pH 7.4. Asterisks indicate a peptide hydrogel that is not time-persistent.
Scanning Electron Microscopy (SEM)
100 μL aliquots of each gel were prepared and placed in a 24 well plate. Gels were dehydrated in a series ethanol/water solutions progressing from 30% ethanol to 100% ethanol over the course of 24 hours. The dehydrated gels were critical point dried using an Electron Microscopy Sciences EMS 850 critical point drier. They were then affixed to SEM pucks using conductive carbon tape. The pucks were sputter coated with 10–15 nm gold using a CRC-150 sputter coater and imaged using an FEI Quanta 400 ESEM at 20.00 kV.
Modeling
Molecular dynamics simulations were performed with Gromacs 4.0 simulation package.32 Temperature was kept constant at 298 K via Berendsen thermostat with a coupling time of τT=0.1 ps. For constant pressure simulations Berendsen barostat33 was used with a coupling time of τP=0.5 ps. GROMOS G53A6 force field,34 which is parameterized to reproduce hydration free energies of amino acid analogs, was used for peptides. Water molecules were modeled with SPC/E,33 which is known to provide accurate hydration free energies. Bond lengths for water molecules and peptides were constrained via SETTLE35 and P-LINCS36 algorithms, respectively. The particle mesh Ewald method (PME)37 was used for electrostatic interactions with a real space cut-off of 1.0 nm and a grid spacing of 0.12 nm. Lennard-Jones interactions were calculated with a twin-range cut-off scheme of 1.0 and 1.4 nm with neighbor list updated every 10 steps. Dispersion correction was used for both energy and pressure beyond the long-range cut-off. A time step of 2 fs was used for the integration. Prior to equilibration MD runs, all systems were energy minimized via steepest descent algorithm to remove possible steric clashes.
Charge state of each residue was assigned according to pH 7.0 resulting in a total charge of +4 per peptide. In accordance with experimental conditions, N-termini and C-termini of the peptides were acetylated and amidated, respectively. A monovalent counter-ion was added for each charged residue of the peptide to maintain neutrality.
For system equilibration a system composed of 16 MDP molecules was set up as follows. A dimer was formed by aligning two MDPs in parallel, their hydrophobic side chains facing towards each other, so that they were shielded from the aqueous environment. Next, 8 such dimers were stacked along the z-direction. Consecutive dimers were stacked in parallel or anti-parallel fashion, depending on the configuration to be tested. Periodic boundary conditions were used in all three dimensions. The z-dimension of the box was chosen so that the molecules at the boundary were in contact with the MDPs in the periodic image. Finally, water and counterions were added to the system to fill up the box. By performing simulated annealing simulations, where the temperature was periodically cycled between 300 K and 550 K, the system was equilibrated. Finally, by performing constant pressure simulations the system was allowed to optimize the box dimensions. Here, semiisotropic pressure coupling was used, with reference pressure values of 1.0, and 0.0 atm. in x/y and z directions, respectively.
For the steered MD simulations a stack of 6 dimers of MDPs were extracted from these equilibrated boxes. This short fiber was placed in a box full of water, where the box dimensions were chosen large enough that at the end of the simulation periodic images of the fiber were further away than the cut-off distance. The fiber axis was oriented along the z-axis, which was also used as the pull direction.
Reference and pulled groups were chosen as the 3rd and the 4th dimers in the fiber, respectively. These groups were pulled away over 400 ps, which was sufficient to remove all contact between these groups. A spring constant of 1000 kJ/(mol nm2), and a pull rate of 0.01 nm/ps were used. Changing the spring constant to 800 or 1200 kJ/(mol nm2) did not change the dissociation profiles of fibers. Steered MD simulations were performed for at least ten different sets for each orientation tested.
DSSP algorithm38, as implemented in Gromacs 4.0 package, was used for secondary structure analysis. For hydrogen bond (H-bond) analysis angle and distance criteria of 30° and 0.35 nm were used, respectively. Visual Molecular Dynamics39 program was used for all molecular graphics.
RESULTS
Secondary Structure
Each peptide was observed in the presence and absence of the gel-inducing counter ion phosphate, since the nature or extent of self-assembly may be altered by its presence. Hydrogels were formed by dissolving lyophilized peptide at 2 wt% in ultrapure water and adding an equal volume of 20 mM phosphate buffer at pH 7 and mixed by pipetting resulting in a 1 wt% gel with 10 mM phosphate buffer. Peptide mixtures without phosphate were dissolved in ultrapure water to a concentration of 1 wt% and adjusted to pH 7 with a minimum of sodium hydroxide. Differences in the CD and IR spectra between the two preparation methods were minor and confined largely to differences in intensity rather than peak position. In contrast, the effect of the hydrophobic amino acid on the circular dichroism of these peptides was significant. While K2(QL)6K2 shows a typical β-sheet conformation via circular dichroism (CD) with a maximum near 198 nm and a minimum near 216 nm, substitution of hydrophobic region with aromatic amino acids introduces new features into the CD spectra (Figure 2). While K2(QF)6K2maintains the characteristic β-sheet minimum near 216nm (in this case slightly blue shifted to 214 nm), a new minimum near 200 nm appears and the maximum blue shifts to 191 nm. The new peak near 200 nm has been reported previously as the result of aromatic stacking interactions24, 25, 40. Other phenylalanine-containing peptides have been shown to have similar CD spectra41. The intensity of this minimum (the strongest signal from this peptide) may shift the apparent peak centers of the adjacent local minimum and maximum. As an intermediate between our previous K2(QL)6K2 peptide and K2(QF)6K2, K2(QFQL)3K2 was synthesized. This peptide shows a more canonical β-sheet signature via CD, with a maximum at 201 nm and a minimum at 220 nm and lacks the aromatic stacking minimum near 200 nm. When the hydrophobic amino acid is changed to a tyrosine in K2(QY)6K2, the additional minimum observed in K2(QF)6K2 near 200 nm shifts to just above 190 nm while the remainder of the spectra retains its β-sheet character. Finally, K2(QW)6K2 displays a CD spectra similar to that observed for K2(QL)6K2 and K2(QFQL)3K2. While the use of aromatic amino acids in the central block of multidomain peptides makes a significant contribution to their CD spectra, particularly the peak believed to be from aromatic stacking interactions in K2(QF)6K2 and K2(QY)6K2, it does not appear that they actually disrupt the β-sheet character of the assembly. To further investigate the peptide secondary structure, we used grazing angle FT-IR.
Figure 2.

CD spectra of peptides (a) K2(QL)6K2, (b) K2(QFQL)3K2, (c) K2(QF)6K2, (d) K2(QW)6K2, (e) K2(QY)6K2. Solid red lines (
 ) indicate low ionic strength while blue diamonds (
 ) indicate the phosphate (a,b,c) or PBS (d,e) buffer.
Previous grazing angle IR studies of multidomain peptides found the peptide strands within the nanofibers to be organized as an anti-parallel β-sheet.21 Grazing angle IR experiments were performed in order to determine the preferred organization of hydrogen bonding when the hydrophobic residues are aromatic. In this set of experiments a thin film of the peptide was dried onto a gold mirror that was placed nearly parallel to the IR beam. Because of the orientation of the IR beam with respect to the orientation of the backbone carbonyls, the amide I⊥ peak found near 1695 cm−1 becomes more clearly visible while the amide I|| is attenuated.21, 42, 43. The amide I⊥ is present in grazing angle spectra for K2(QL)6K2, K2(QFQL)3K2, and K2(QF)6K2 (Figure 3a,b,c). However, the relative intensity of this peak is much less in K2(QY)6K2 and absent in K2(QW)6K2 (figure 3d,e). Therefore, it appears that K2(QY)6K2and K2(QW)6K2 adopt primarily a parallel β-sheet conformation, while K2(QL)6K2, K2(QFQL)3K2, and K2(QF)6K2 reside preferentially in an anti-parallel orientation.
Figure 3.

Grazing angle FT-IR. Baseline corrected data in solid black, data fit overlayed in dotted red. Deconvolutions of grazing angle FT-IR show the variable intensity of the amide I⊥ near 1695 cm−1 (blue) which is characteristic of anti-parallel β-sheet networks. This band is notably reduced or eliminated in K2(QY)6K2 and K2(QW)6K2 which suggests a parallel orientation for the hydrogen bonding network in contrast to what is seen for other MDPs.
To further explore the preferred packing orientation of these peptides and validate grazing angle IR measurements, molecular dynamics simulations were performed. Sixteen peptides were assembled into a short fiber with 8 molecules in each tape. For each multidomain peptide, both parallel and anti-parallel hydrogen bonding arrangements within the tapes were tested. The preformed fiber was placed in a simulation box with periodic boundary conditions, such that the fiber ends are in contact with the periodic images to avoid end-effects. The simulations were performed with explicit water and neutralizing counterions. All systems were equilibrated by using semi-isotropic pressure coupling, so that the inter- and intra-tape spacing between the molecules were equilibrated.
Surprisingly, the intra-tape spacing is determined by hydrogen bonding alone. Despite the differences in side chain bulkiness, the intra-tape spacing between the peptides remained close to 0.48 nm for all multidomain peptides in both parallel and anti-parallel orientation, which allows optimal hydrogen bonding in each case. However, as the bulkiness of the side chains increased inter-tape spacing increased, as shown in Table 2. The inter-tape distances were calculated from the spacing between the density maximum of the backbone atoms of the peptides in different tapes. The hydrogen bonding orientation did not impact inter-tape spacing, therefore for each peptide the average spacing is reported in Table 2.
Table 2.
Inter-tape spacing between the peptides
| Peptide | QL | QFQL | QF | QY | QW |
|---|---|---|---|---|---|
| Inter-tape spacing (nm) | 1.19 | 1.27 | 1.25 | 1.43 | 1.57 |
These results suggest packing considerations alone cannot account for the observed preference of peptides for the parallel vs. anti-parallel hydrogen-bond orientation as seen in FT-IR data. To understand the role of energetic contributions in this preference, the strength of the fibers was tested with steered MD simulations. The initial configurations for the fibers were obtained from the structures equilibrated under periodic boundary conditions. A finite length fiber, composed of 12 MDPs, was aligned along the z-axis and pulled apart by applying a force parallel to the fiber axis. The box size was chosen sufficiently large so that the fiber does not interact with its periodic images, and the box was filled with water and neutralizing counterions. The force was applied in opposite directions to the 3rd and the 4thpeptide-dimers, so that the fiber was pulled apart right from its center. The steered MD simulations were performed with a spring constant of 1000 kJ mol−1 nm−2 and at a constant pulling rate of 0.01 nm/ps. Changing the spring constant to 800 or 1200 kJ mol−1 nm−2 did not significantly change the observed dissociation profiles of fibers. The two groups were pulled apart until the centers of mass of these groups do not interact. Work obtained from a steered MD simulation is non-equilibrium work, and large fluctuations are seen in the measured force values. The average constraint force required for pulling apart the fiber at a constant rate is shown in Figure 4, where the average was calculated over 10 independent steered MD runs for each case tested.
Figure 4.

Average force curves for the parallel and anti-parallel orientations of QL, QFQL, QF, QY, and QW peptides. Black and red curves show the results for anti-parallel and parallel hydrogen bonding within the tapes.
For all five peptides under consideration average force curves are obtained for the parallel and anti-parallel orientation of the molecules. In each case initially the force increases linearly, and within this regime the fiber remains intact. When the force reaches a critical value, the fiber breaks apart abruptly into two parts and the force decreases. This critical force value can be used as a measure of the relative strength of the fibers, larger maximum force indicating higher stability of the fiber configuration. Comparison of parallel and anti-parallel maximum force values for the peptides shows that, in agreement with IR results, QL, QFQL, and QF prefer the anti-parallel orientation, whereas QY and QW prefer the parallel orientation. At the breakage point two events take place almost simultaneously: the hydrogen bond network between 3rd and 4th dimers are broken and hydrophobic side chains become exposed to water.
Comparison of the strength of the preferred peptide fiber orientations for different peptides is also shown in Figure 4 (bottom-right corner). The fiber pulling strength increases with increasing aromaticity. Close investigation of the packing of the molecules for QY fibers, clearly shows the role of the specific chemistry of the side-chains. In Figure 5 QY fibers in anti-parallel and parallel orientation are shown, on the left and right, respectively. The cross section of the fiber is shown looking down the fiber-axis (parts a and c), where only two dimers are shown and water and counterions are hidden for visual clarity. The side-view of the fibers is also shown (parts b and d), where the arrows represent the β-sheet secondary structure of the peptides. The peptides in the front and rear tapes of the fiber are shown with white and blue color, respectively.
Figure 5.
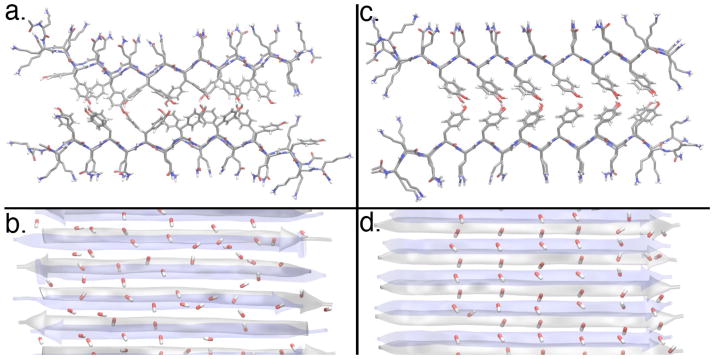
Equilibrium structure of the QY molecules in anti-parallel (left) and parallel (right) hydrogen bonded fiber orientations. Cross-sections of the QY fiber looking down the fiber axis are shown in parts a and c. The side-view of the fibers are shown in parts b and d. The –OH groups at the tip of the tyrosine side chains are also shown in parts b and d.
In the anti-parallel orientation the tyrosine side-chains are highly disordered within the hydrophobic core. The –OH groups at the tip of the tyrosine side-chain are also shown in the side-view (stick representation), and no regular structure can be seen. On the other hand, the parallel orientation clearly shows a regular side-chain packing within the hydrophobic core (Figure 5c). The –OH groups play a major role in this, by forming dipole chains along the fiber axis. These chains are formed by alignment of –OH dipoles from the two sides of the double-tape structure, resulting in a zipper-like motif within the hydrophobic core. The lower dielectric constant in the hydrophobic core may lead to stronger interactions among these dipoles enabling the higher strength of QY fibers.
Nanofiber morphology
Fiber network morphology was examined for all peptides in both the gelled and non-gelled states. Gelation conditions were achieved by the addition of charge-screening salts. For a peptide with positively charged lysine residues on the termini, a negatively charged multivalent salt, such as phosphate, is used. This allows good gel formation at low concentrations of both peptide (1% by weight) and salt. While hydrogels can be formed in the absence of salts, this requires higher concentrations of peptide (in excess of 2% by weight). Monovalent salts such as NaCl can also aid gelation, but much higher concentrations of the salt are required as compared to multivalent salts. Phosphate ions are able to bridge multiple lysine side chains linking peptides to one another leading to hydrogel formation, and are also convenient for their buffering properties and common use in cell culture media.
For the non-gelled state (lacking phosphate anions) AFM and vitreous ice cryo-transmission electron microscopy (cryo-TEM) were used to visualize nanofiber morphology (Figure 6). For the gelled state, cryo-TEM and critical point dried SEM were employed (Figure 7). Peptide QL selfassembles into linear nanofibers that are 6 nm in width, 2 nm in height, and several hundred nanometers in length, as determined by cryo-TEM and AFM. SEM confirms the presence of a nanofiber network in the gelled state. These fibers are visible under both gelling and non-gelling conditions which suggests that the main difference between the two states is the length and entanglement of the fibers while only minimal changes take place at the structural level of the fiber itself. This is backed up by CD measurements under both conditions (figure 2) which show changes in the intensity of the observed bands, but only minor changes in peak position.
Figure 6.
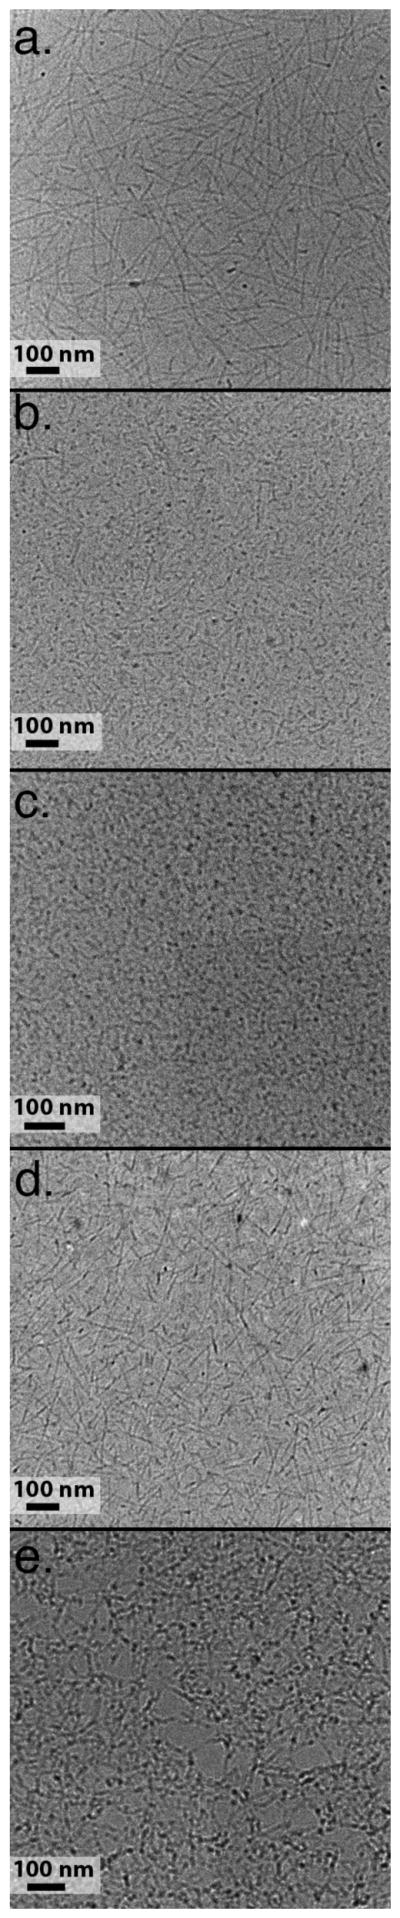
cryo-TEM of peptides in the non-gelled state. a) K2(QL)6K2, b) K2(QFQL)3K2, c) K2(QF)6K2, d) K2(QW)6K2, e) K2(QY)6K2.
Figure 7.

Cryo-TEM and SEM of peptides in the presence of phosphate anions. a, b) K2(QL)6K2, c, d) K2(QFQL)3K2, e, f) K2(QF)6K2, g, h) K2(QW)6K2, i, j) K2(QY)6K2.
The introduction of three phenylalanine residues in QFQL results in a substantially reduced fiber length under phosphate free conditions. Fibers that appear are linear and unbranched as observed by cryo-TEM and AFM (figure 6c,d). Addition of phosphate anions increases the length of the fibers (figure 7c) and results in their entanglement. SEM of a critical point dried gel reveals a spongy nanofiber network (figure 7d). The use of six phenylalanine residues in peptide QF, results in loss of the fibrous structure under phosphate free conditions(figure 6e,f). Instead mostly amorphous aggregates are visualized. Despite this, CD and IR display a β-sheet spectra suggesting that the basic peptide fold is intact while fiber extension is attenuated. In the presence of phosphate counterions, the fibrous morphology returns (figure 7e) though. SEM of this peptide proved difficult due to the apparent fragility of the fiber network to the visualization conditions, but fiber morphology in these gels was still observed. Peptides QY and QW both display fibers with and without phosphate anions, but these systems did not display the highly entangled network in the presence of phosphate that is observed for QL, QLQF and QF by cryo-TEM. These differences were less obvious at the lower resolution of SEM.
Rheology
Hydrogels of each peptide were prepared by dissolving the peptide at 2 wt% in ultrapure water at pH 7. To this solution was added an identical volume of 2x phosphate buffered saline (PBS) or simple phosphate buffer at pH 7. The solution was pipetted up and down several times before the vial was capped and vortexed for several seconds. Only minor differences were observed between PBS and phosphate buffered hydrogels (figure 8). Of the tested peptides, QFQL and QF showed the highest elastic modulus (G′) of just over 200 Pa. QL was intermediate with G′ just below 100 while QY and QW have significantly lower elastic moduli. QY initially forms a weak, milky white gel (the other gels are clear) with an elastic modulus comparable to QW, however, the QY gel is unstable and phase separates over several hours.
DISCUSSION
The modular nature of multidomain peptides allows us to explore the aromatic contribution to self-assembly while keeping other features of the peptide constant. When the charged and hydrophilic residues are held constant, the selection of aromatic amino acids or aliphatic residues has a significant impact on fiber organization at the molecular level (orientation of hydrogen bonding) and these differences work their way up through the structural hierarchy to the level of the fiber and hydrogel elasticity. Hydrophobicity alone cannot account for these differences44, as leucine and phenylalanine have similar hydropathy indices but produce significantly different fiber morphologies. Similarly, tyrosine and tryptophan have similar hydropathy indices but different fiber morphologies. The major difference between the examined peptides appears to be the preference for formation of an anti-parallel vs. a parallel hydrogen bonding network within a given fiber. QL, QFQL and QF all prefer an anti-parallel hydrogen bonding network as observed by grazing angle FT-IR experiments in which the characteristic peak near 1695 cm−1 is clearly visible. In contrast, this peak in peptides QY and QW is altogether absent or highly attenuated suggesting the formation of a parallel hydrogen bonding network. Molecular dynamics simulations also reveal this divergence with peptides QL, QFQL and QF displaying higher pulling strengths associated with the anti-parallel configuration while QY and QW displaying higher pulling strengths with parallel hydrogen bonding. The differences between these two sets of peptides can be observed at the level of fiber morphology in that fibers formed in the presence of phosphate from peptides QY and QW are relatively short and do not effectively entangle while peptides QL, QFQL and QF assemble into much longer fibers that form large entangled networks. The split between these two groups of peptides is also clearly observed by rheometry which shows very poor hydrogel characteristics for peptides which prefer parallel hydrogen bonding, QY and QW, while the anti-parallel hydrogen bonded peptides all form good hydrogels.
Mechanical properties of the fibers and the gelation mechanism, i.e. how the fibers are connected to each other, play an important role on the structural and physical properties of the fibers and the gel state. The increased pulling strength for QY and QW observed in MD simulations stem mostly from the increased order in the hydrophobic core due to increased aromaticity. This could potentially lead to more brittle fibers, hence poor strength gels and short fiber lengths. Unfortunately, the MD simulations measuring the pull strength do not reveal any information regarding the persistence length or bending rigidity of the fibers. Whether these peptides show any difference in their nucleation and gelation mechanisms remains an open question.
CONCLUSION
We have demonstrated that self-assembling multidomain peptides can tolerate a wide variety of amino acids in their hydrophobic core and retain their basic nanofiberous structure. However, the selection of the specific hydrophobe plays a large role in the length and quality of the nanofiber formed as well as the packing of the fiber at the molecular level. Peptides QL, QFQL and QF formed anti-parallel hydrogen bonding networks, long fibers and good hydrogels while peptides QY and QW formed parallel hydrogen bonding networks, short fibers and poor hydrogels.
Supplementary Material
Figure 1.
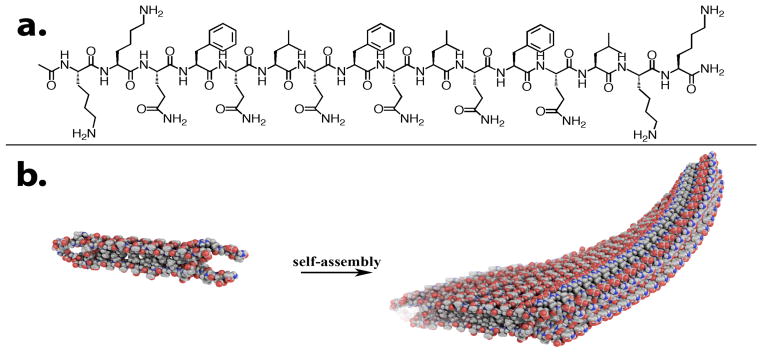
a) Structure of K2(QFQL)3K2 and b) self-assembly of multidomain peptides into nanofibers.
Acknowledgments
This work was funded in part by National Science Foundation CAREER Award (DMR-0645474), the Robert A. Welch Foundation (Grant No. C1557), the NIH (R01 DE021798-01A1) and TUBITAK (Project No: 112T496).
Footnotes
MALDI-TOF characterization of peptides and high resolution presentation of figures 6 and 7. This material is available free of charge via the Internet at http://pubs.acs.org.
References
- 1.Zhang S, Holmes T, Lockshin C, Rich A. Proc Natl Acad Sci USA. 1993;90:3334–3338. doi: 10.1073/pnas.90.8.3334. [DOI] [PMC free article] [PubMed] [Google Scholar]
- 2.Holmes TC, Lacalle Sd, Su X, Liu G, Rich A, Zhang S. Proc Natl Acad Sci USA. 2000;97:6728–6733. doi: 10.1073/pnas.97.12.6728. [DOI] [PMC free article] [PubMed] [Google Scholar]
- 3.Branco MC, Pochan DJ, Wagner NJ, Schneider JP. Biomaterials. 2009;30:1339–1347. doi: 10.1016/j.biomaterials.2008.11.019. [DOI] [PMC free article] [PubMed] [Google Scholar]
- 4.Altunbas A, Pochan DJ. Top Curr Chem. 2012;310:135–167. doi: 10.1007/128_2011_206. [DOI] [PubMed] [Google Scholar]
- 5.Yan CQ, Pochan DJ. Chem Soc Rev. 2010;39:3528–3540. doi: 10.1039/b919449p. [DOI] [PMC free article] [PubMed] [Google Scholar]
- 6.Lashuel HA, LaBrenz SR, Woo L, Serpell LC, Kelly JW. J Am Chem Soc. 2000;122:5262–5277. doi: 10.1021/ja9937831. [DOI] [PubMed] [Google Scholar]
- 7.Hartgerink JD, Beniash E, Stupp SI. Science. 2001;294:1684–1688. doi: 10.1126/science.1063187. [DOI] [PubMed] [Google Scholar]
- 8.Koga T, Higuchi M, Kinoshita T, Higashi N. Chem Eur J. 2006;12:1360–1367. doi: 10.1002/chem.200500611. [DOI] [PubMed] [Google Scholar]
- 9.Petka WA, Harden JL, McGrath KP, Wirtz D, Tirrell DA. Science. 1998;281:389–392. doi: 10.1126/science.281.5375.389. [DOI] [PubMed] [Google Scholar]
- 10.Hoffman AS. Adv Drug Delivery Rev. 2002;54:3–12. doi: 10.1016/s0169-409x(01)00239-3. [DOI] [PubMed] [Google Scholar]
- 11.Naigai Y, Unsworth LD, Koutsopoulos S, Zhang S. J Controlled Release. 2006;115:18–25. doi: 10.1016/j.jconrel.2006.06.031. [DOI] [PubMed] [Google Scholar]
- 12.Galler KM, Aulisa L, Regan KR, D’Souza RN, Hartgerink JD. J Am Chem Soc. 2010;132:3217–3223. doi: 10.1021/ja910481t. [DOI] [PMC free article] [PubMed] [Google Scholar]
- 13.Wang Y, Bakota E, Chang BH, Entman M, Hartgerink JD, Danesh FR. J Am Soc Nephrol. 2011;22:704–717. doi: 10.1681/ASN.2010040403. [DOI] [PMC free article] [PubMed] [Google Scholar]
- 14.Galler KM, D’Souza RN, Hartgerink JD, Schmalz G. Adv Dent Res. 2011;23:333–339. doi: 10.1177/0022034511405326. [DOI] [PubMed] [Google Scholar]
- 15.Bakota EL, Wang Y, Danesh FR, Hartgerink JD. Biomacromolecules. 2011;12:1651–1657. doi: 10.1021/bm200035r. [DOI] [PMC free article] [PubMed] [Google Scholar]
- 16.Galler KM, D’Souza RN, Federlin M, Cavender AC, Hartgerink JD, Hecker S, Schmalz G. J Endod. 2011;37:1536–1541. doi: 10.1016/j.joen.2011.08.027. [DOI] [PubMed] [Google Scholar]
- 17.Galler KM, Hartgerink JD, Cavender AC, Schmalz G, D’Souza RN. Tissue Eng Part A. 2012;18:176–184. doi: 10.1089/ten.tea.2011.0222. [DOI] [PMC free article] [PubMed] [Google Scholar]
- 18.Aulisa L, Dong H, Hartgerink JD. Biomacromolecules. 2009;10:2694–2698. doi: 10.1021/bm900634x. [DOI] [PubMed] [Google Scholar]
- 19.Bakota EL, Aulisa L, Galler KM, Hartgerink JD. Biomacromolecules. 2011;12:82–87. doi: 10.1021/bm1010195. [DOI] [PubMed] [Google Scholar]
- 20.Bakota EL, Aulisa L, Tsyboulski DA, Weisman RB, Hartgerink JD. Biomacromolecules. 2009;10:2201–2206. doi: 10.1021/bm900382a. [DOI] [PMC free article] [PubMed] [Google Scholar]
- 21.Dong H, Paramonov SE, Aulisa L, Bakota EL, Hartgerink JD. J Am Chem Soc. 2007;129:12468–12472. doi: 10.1021/ja072536r. [DOI] [PubMed] [Google Scholar]
- 22.Gupta M, Bagaria A, Mishra A, Mathur P, Basu A, Ramakumar S, Chauhan VS. Adv Mater. 2007;19:858–861. [Google Scholar]
- 23.Caplan MR, Moore PN, Zhang SG, Kamm RD, Lauffenburger DA. Biomacromolecules. 2000;1:627–631. doi: 10.1021/bm005586w. [DOI] [PubMed] [Google Scholar]
- 24.Bowerman CJ, Ryan DM, Nissan DA, Nilsson BL. Mol BioSyst. 2009;5:1058–1069. doi: 10.1039/b904439f. [DOI] [PubMed] [Google Scholar]
- 25.Bowerman CJ, Nilsson BL. J Am Chem Soc. 2010;132:9526–9527. doi: 10.1021/ja1025535. [DOI] [PubMed] [Google Scholar]
- 26.Ma ML, Kuang Y, Gao Y, Zhang Y, Gao P, Xu B. J Am Chem Soc. 2010;132:2719–2728. doi: 10.1021/ja9088764. [DOI] [PubMed] [Google Scholar]
- 27.Hamley IW. Angew Chem Int Ed. 2007;46:8128–8147. doi: 10.1002/anie.200700861. [DOI] [PubMed] [Google Scholar]
- 28.Krysmann MJ, Castelletto V, Hamley IW. Soft Matter. 2007;3:1401–1406. doi: 10.1039/b709889h. [DOI] [PubMed] [Google Scholar]
- 29.Makin OS, Atkins E, Sikorski P, Johansson J, Serpell LC. Proc Natl Acad Sci USA. 2005;102:315–320. doi: 10.1073/pnas.0406847102. [DOI] [PMC free article] [PubMed] [Google Scholar]
- 30.Saiani A, Mohammed A, Frielinghaus H, Collins R, Hodson N, Kielty CM, Sherratt MJ, Miller AF. Soft Matter. 2009;5:193–202. [Google Scholar]
- 31.Marini DM, Hwang W, Lauffenburger DA, Zhang SG, Kamm RD. Nano Lett. 2002;2:295–299. [Google Scholar]
- 32.Hess B, Kutzner C, van der Spoel D, Lindahl E. J Chem Theory Comput. 2008;4:435–447. doi: 10.1021/ct700301q. [DOI] [PubMed] [Google Scholar]
- 33.Berendsen HJC, Postma JP, van Gunsteren WF, Dinola A, Haak JR. J Chem Phys. 1984;81:3684–3690. [Google Scholar]
- 34.Oostenbrink C, Villa A, Mark AE, van Gunsteren WF. J Comput Chem. 2004;25:1656–1676. doi: 10.1002/jcc.20090. [DOI] [PubMed] [Google Scholar]
- 35.Miyamoto S, Kollman PA. J Comput Chem. 1992;13:952–962. [Google Scholar]
- 36.Hess B. J Chem Theory Comput. 2008;4:116–122. doi: 10.1021/ct700200b. [DOI] [PubMed] [Google Scholar]
- 37.Darden T, York D, Pedersen L. J Chem Phys. 1993;98:10089–10092. [Google Scholar]
- 38.Kabsch W, Sander C. Biopolymers. 1983;22:2577. doi: 10.1002/bip.360221211. [DOI] [PubMed] [Google Scholar]
- 39.Humphrey W, Dalke A, Schulten K. J Mol Graphics. 1996;14:33–38. doi: 10.1016/0263-7855(96)00018-5. [DOI] [PubMed] [Google Scholar]
- 40.Wang K, Keasling JD, Muller SJ. Int J Biol Macromol. 2005;36:232–240. doi: 10.1016/j.ijbiomac.2005.06.006. [DOI] [PubMed] [Google Scholar]
- 41.Padmanabhan S, Marqusee S, Ridgeway T, Laue TM, Baldwin RL. Nature. 1990;344:268–270. doi: 10.1038/344268a0. [DOI] [PubMed] [Google Scholar]
- 42.Paramonov SE, Jun HW, Hartgerink JD. J Am Chem Soc. 2006;128:7291–7298. doi: 10.1021/ja060573x. [DOI] [PubMed] [Google Scholar]
- 43.Kim HS, Hartgerink JD, Ghadiri MR. J Am Chem Soc. 1998;120:4417–4424. [Google Scholar]
- 44.Kyte J, Doolittle RF. J Mol Biol. 1982;157:105–132. doi: 10.1016/0022-2836(82)90515-0. [DOI] [PubMed] [Google Scholar]
Associated Data
This section collects any data citations, data availability statements, or supplementary materials included in this article.