Abstract
Objective:
Neuromyelitis optica and its spectrum disorder (NMOSD) can present similarly to relapsing-remitting multiple sclerosis (RRMS). Using a quantitative lesion mapping approach, this research aimed to identify differences in MRI brain lesion distribution between aquaporin-4 antibody–positive NMOSD and RRMS, and to test their diagnostic potential.
Methods:
Clinical brain MRI sequences for 44 patients with aquaporin-4 antibody–positive NMOSD and 50 patients with RRMS were examined for the distribution and morphology of brain lesions. T2 lesion maps were created for each subject allowing the quantitative comparison of the 2 conditions with lesion probability and voxel-wise analysis.
Results:
Sixty-three percent of patients with NMOSD had brain lesions and of these 27% were diagnostic of multiple sclerosis. Patients with RRMS were significantly more likely to have lesions adjacent to the body of the lateral ventricle than patients with NMOSD. Direct comparison of the probability distributions and the morphologic attributes of the lesions in each group identified criteria of “at least 1 lesion adjacent to the body of the lateral ventricle and in the inferior temporal lobe; or the presence of a subcortical U-fiber lesion; or a Dawson's finger-type lesion,” which could distinguish patients with multiple sclerosis from those with NMOSD with 92% sensitivity, 96% specificity, 98% positive predictive value, and 86% negative predictive value.
Conclusion:
Careful inspection of the distribution and morphology of MRI brain lesions can distinguish RRMS and NMOSD.
Neuromyelitis optica (NMO) is an inflammatory demyelinating condition of the CNS with a predilection for the optic nerves and spinal cord. NMO spectrum disorder (NMOSD) is a term used to encompass NMO (with both optic neuritis and myelitis)1 and limited phenotypes such as recurrent optic neuritis or myelitis. It is an autoimmune disorder, mediated in most cases by antibodies to the aquaporin-4 (AQP4) water channel,2,3 and for the majority of patients serum AQP4 antibodies (AQP4-abs) can be detected with an immunoassay.4 Making a definitive diagnosis of antibody-negative NMOSD can be challenging because the more prevalent relapsing-remitting multiple sclerosis (RRMS) can present similarly (e.g., with attacks of optic neuritis and myelitis).1,5,6 It is vitally important to distinguish these 2 conditions: patients with NMOSD require long-term immunosuppression to prevent devastating relapses, and disease-modifying treatments for RRMS such as β-interferon can worsen NMOSD.7,8 Hence, we need other markers to help promptly identify those who should be antibody tested, and to diagnose seronegative disease.
MRI is the best noninvasive tool we have for visualizing the pathology of neuroinflammatory diseases in vivo, and has proven particularly useful in identifying patients with longitudinally extensive transverse myelitis (LETM), which is highly suggestive of NMOSD.1 The objective of this study was to examine the utility of brain MRI in the diagnosis of NMOSD, which would be particularly relevant to patients who present with a spatially limited phenotype.9,10 A quantitative probability analysis approach was used to document the brain lesion distribution in a relatively large cohort of AQP4-ab–positive patients with NMOSD, comparing and contrasting with RRMS.
METHODS
The study dataset consisted of conventional MRI examinations that were cross-sectional in nature.
Standard protocol approvals, registrations, and patient consents.
MRI scan and clinical data were collected in adherence to regulations from the U.K. National Research Ethics Service. All patients were consented for the use of their anonymized MRI examinations and clinical details for research purposes.
Subjects.
All subjects included in this study were older than 18 years, had available a good quality clinical (conventional) MRI brain examination as assessed by a neuroradiologist (with the inclusion of T1 weighting, T2 weighting, and fluid-attenuated inversion recovery [FLAIR] sequences), and before the assessment of their MRI scans were not known to have any other medical condition that may result in hyperintense lesions on the T2/FLAIR sequences. MRI data were contributed from the University of Oxford, University of Siena, University of Nottingham, and Cardiff University.
NMOSD cohort.
Only subjects who were AQP4-ab positive (all tested in Oxford with a cell-based assay technique)4,11,12 were included. Twenty-eight fulfilled Wingerchuk criteria for NMO with both optic neuritis and myelitis, 11 had relapsing LETM, 1 patient had monophasic LETM, and 4 had relapsing optic neuritis. Of these 44 patients, 29 were identified to have T2 hyperintense lesions on brain MRI. Three of these patients had a vascular-like lesion distribution as determined by an experienced neuroradiologist without knowledge of the diagnosis or the age of the patient. When unblinded, it was apparent that these patients were older than the remaining NMOSD cohort (with ages 72, 76, and 77 years), in keeping with the likelihood of finding incidental vascular lesions. These subjects were excluded from the group used to create the lesion probability distribution. Their scans are shown in figure e-1 on the Neurology® Web site at www.neurology.org.
RRMS cohort.
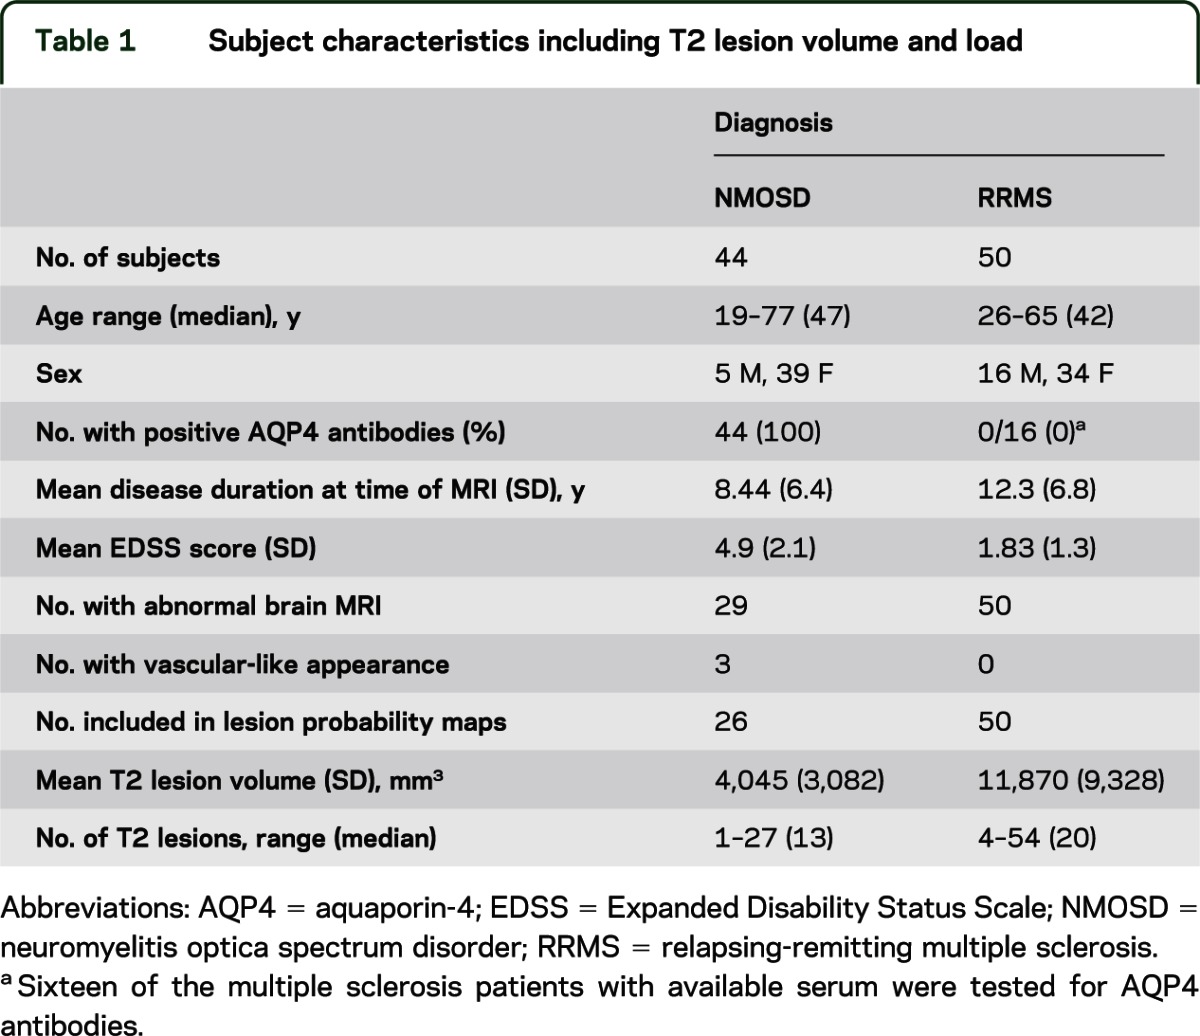
Fifty subjects with the diagnosis RRMS who fulfilled McDonald clinical criteria were included as a comparator cohort.13 Among the 50 patients with multiple sclerosis (MS), 16 from Oxford who had consented to be tested for AQP4-abs were all found to be negative. Because of the retrospective nature of the data collection from Nottingham and Siena, these patients were not tested. Table 1 summarizes the characteristics of the subjects including T2 lesion number and volume.
Table 1.
Subject characteristics including T2 lesion volume and load
Lesion probability maps.
Imaging data were analyzed using the FMRIB Software Library of tools (University of Oxford, UK).14,15 For each subject, hyperintense T2 lesions were segmented manually on an axial FLAIR image, in native space, with simultaneous reference to the T2 scan. This process was conducted independently on every scan by 2 researchers, 1 with 3 years experience in T2 lesion mapping (L.M.) and 1 neuroradiologist (R.M.). The FLAIR images were then registered to the Montreal Neurological Institute (MNI) 2-mm standard space template using a nonlinear transformation method (FNIRT [FMRIB’s nonlinear image registration tool]).16 The nonlinear transformation matrix was then applied to the respective lesion segmentation masks to transform them into the space of the standard template. After transformation, the lesion masks were thresholded at 50% and binarized again to avoid the volume increase caused by the trilinear interpolation. They were then summed and averaged for each subject group to create lesion probability maps. A group-level comparison of lesion distribution was conducted using the nonparametric permutation testing tool Randomise with cluster-based thresholding and corrected for multiple comparisons.14
Description of lesion distribution in the NMOSD cohort.
T2 lesions were counted, and the lesion location and characteristics were documented. Barkhof criteria for the dissemination of MS lesions in space were applied to the unenhanced brain scans alone (spinal cord scans not available).17 These criteria are a) at least 9 lesions on T2-weighted images, b) at least 3 periventricular lesions, c) at least 1 juxtacortical lesion, and d) at least 1 infratentorial lesion. The cutoff for positivity is 3 of 4 criteria. The NMOSD scans were also examined for lesion morphology typical of MS, namely, juxtacortical lesions in the U-fiber (with a curved/s-shaped morphology) and ovoid perpendicular lesions adjacent to the body of the lateral ventricles often described as Dawson's fingers.
RESULTS
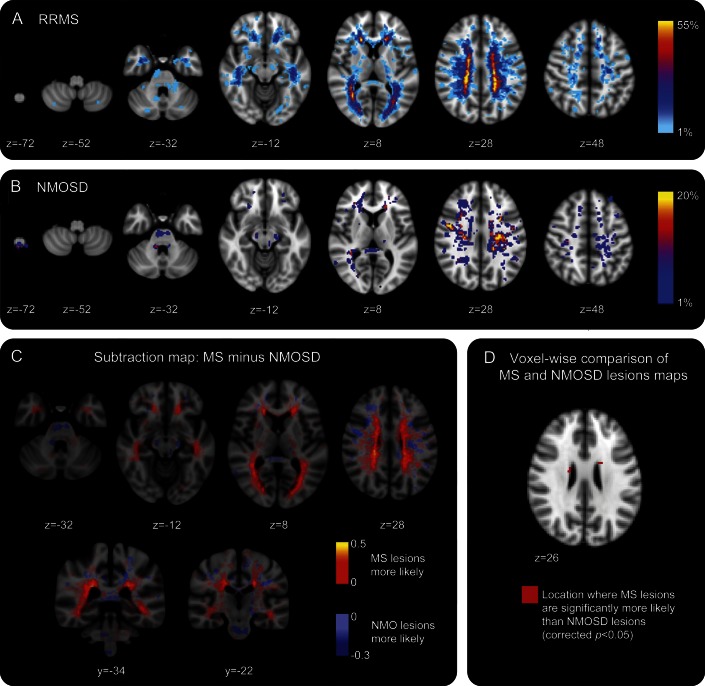
Cross-sectional examination of the brain MRI scans from the cohort of 41 UK seropositive NMOSD patients (excluding those with lesions consistent with cerebrovascular disease) demonstrated T2 hyperintense lesions in 26 of 41 (63.4%). The lesion probability distributions for the RRMS and NMOSD patient groups are shown in figure 1, A and B. The majority of lesions in the patients with NMOSD were smaller in size and fewer in number compared with patients with MS. The distribution throughout the brain tissue was also widely variable: this is reflected in the low probability of lesions occurring in the same spatial location in more than 2 patients. The area of highest probability of a lesion occurring in the NMOSD group was within the frontal deep white matter (MNI coordinate −24 mm, 8 mm, 20 mm at a probability of 20%). Conversely, the most likely place for an RRMS lesion to occur was adjacent to the posterior of the body of the lateral ventricle in the parietal white matter (MNI coordinate 30 mm, −50 mm, 14 mm), at a high probability of 54% indicating greater lesion load and coherence of lesion location among patients in the RRMS group. Figure 1C shows a subtraction map in which the average NMOSD lesion map has been subtracted from the average RRMS lesion map to allow direct comparison of the distributions. Lesions in NMOSD and RRMS are found throughout the supra- and infratentorial white and gray matter. However, distinguishing features of note were more NMOSD lesions in the medulla oblongata, whereas in the RRMS group, more lesions were noted within the cerebellum, bordering the lateral aspect of the body of the lateral ventricles (including within the periventricular gray matter) and in the temporal lobes. Both conditions were associated with lesions in the corpus callosum. Figure 1D shows the voxel-wise permutation-testing comparison of the lesion distributions in each group. RRMS lesions are significantly more likely than NMOSD lesions to be adjacent to the body of the lateral ventricle (corrected p < 0.05). The lesional region with the greatest likelihood to be within the NMOSD and not the RRMS group was adjacent to the fourth ventricle within the pons. This did not reach statistical significance (corrected p = 0.35) because of the lower lesion load in NMOSD.
Figure 1. Visual comparison of lesion probability distributions in neuromyelitis optica spectrum disorder (NMOSD) and relapsing-remitting multiple sclerosis (RRMS).
(A) Lesion probability distribution for 50 subjects with RRMS. The color scale (from 0% to 55%) represents the minimum to maximum probability of a lesion occurring in a particular spatial location. Montreal Neurological Institute (MNI) standard space template Z coordinate is shown in millimeters. (B) Lesion probability distribution for 26 subjects with aquaporin-4 antibody–positive NMOSD. The color scale (from 0% to 20%) represents the minimum to maximum probability of a lesion occurring in a particular spatial location. MNI standard space Z coordinate is shown in millimeters. (C) Subtraction map in which the average NMOSD lesion map has been subtracted from the average RRMS map to allow direct comparison of the lesion distributions. Red to yellow represents where RRMS lesions are more likely than NMOSD, and light blue to dark blue where NMOSD lesions are more likely than RRMS. (D) Voxel-wise comparison of lesion probability maps reveals that RRMS lesions are significantly more likely than NMOSD lesions to be adjacent to the body of the lateral ventricle, shown here in red (corrected p < 0.05). MS = multiple sclerosis; NMO = neuromyelitis optica.
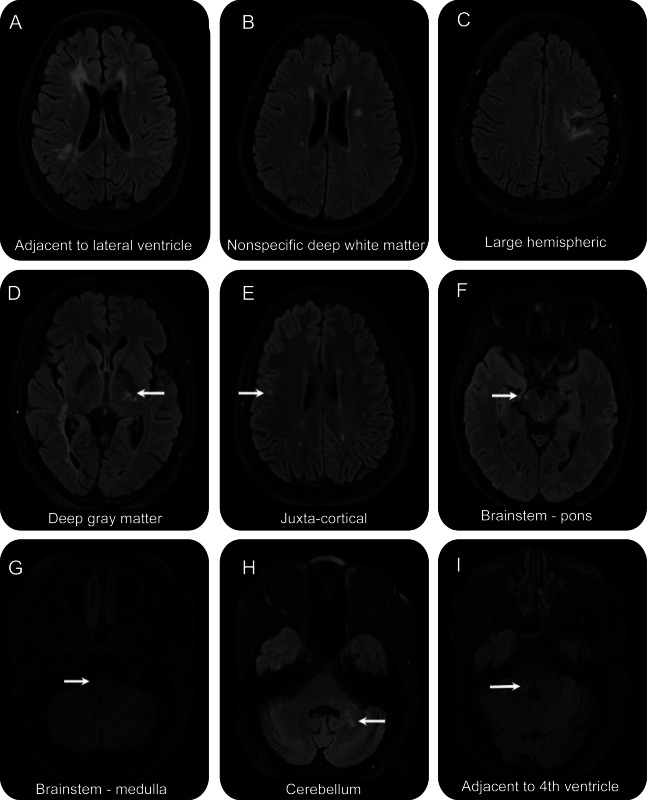
The proportion of NMOSD T2 lesions occurring in specific spatial locations within the brain is shown in table 2. Examples of these patterns are shown in figure 2. Of note, the most common distribution for patients with NMOSD is supratentorial deep white matter lesions.
Table 2.
Lesion location for 26 patients with NMOSD who tested positive for aquaporin-4 antibodies
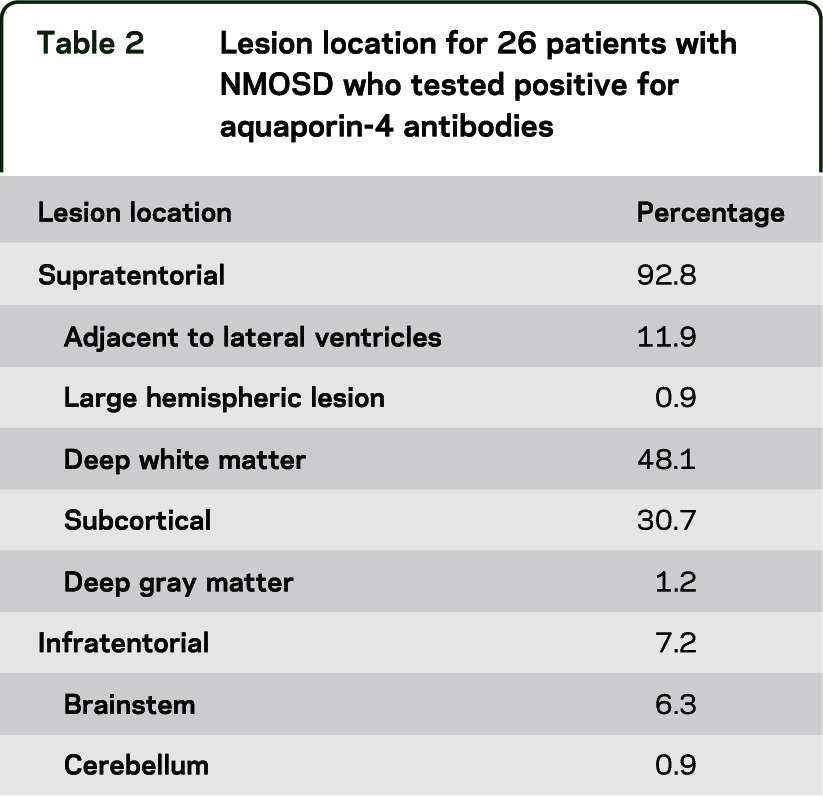
Figure 2. Neuromyelitis optica spectrum disorder (NMOSD) lesions.
Examples of NMOSD (all with positive aquaporin-4 antibody) fluid-attenuated inversion recovery scans showing lesions in locations corresponding to table 2. (A) Adjacent to the lateral ventricle. (B) Nonspecific white matter. (C) Large hemispheric lesion that had been biopsied. (D) Thalamic. (E) Juxtacortical. (F) Pontine. (G) Medullar oblongata. (H) Cerebellar. (I) Adjacent to the fourth ventricle.
Seven of 26 patients with NMOSD who had brain lesions, or 15.9% of all patients with NMOSD, fulfilled Barkhof criteria for the dissemination of RRMS lesions in space,17 based on unenhanced brain MRI alone. There are important differences, however, in the morphology of the lesions. None of the patients with NMOSD had juxtacortical T2 hyperintensities with morphology suggestive of location in the U-fiber, unlike the RRMS cohort. It is also of note that lesions adjacent to the lateral ventricles in NMOSD tend to be located at the anterior and posterior horns (figure 2A), and that no patients had ovoid lesions in a perpendicular alignment (Dawson's fingers).
CSF examination had been performed in 34 of the patients with NMOSD. Of those, 9 tested positive for oligoclonal bands. Of the 7 patients who fulfilled Barkhof criteria, 1 tested positive for oligoclonal bands; therefore, there is no increased likelihood within this subgroup. The clinical phenotypes of this group of patients were 5 with NMO as described by the 2006 Wingerchuk criteria,1 and 2 with relapsing LETM.
Within the NMOSD cohort, colocalized T1 hypointensity was found in 0% to 83.3% of T2 lesions (38% of all T2 lesions). This compares with 25% to 95% of MS lesions (53.4% of all T2 lesions).
Formulation of criteria for the separation of RRMS and NMOSD.
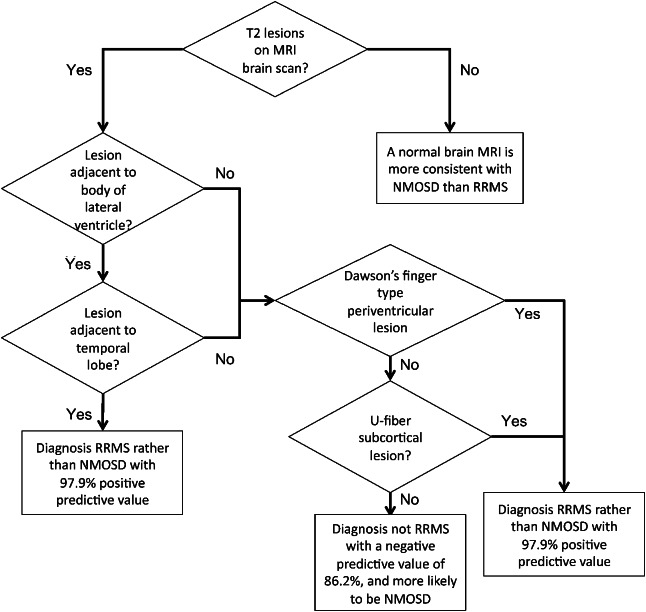
Using the findings summarized above, we were able to hypothesize that RRMS could be distinguished from NMOSD on the basis of T2 brain lesion distribution. We tested criteria of having at least 1 lesion adjacent to the body of the lateral ventricle and at least 1 lesion in the inferior temporal lobe for the identification of RRMS. This was able to identify RRMS with 78% sensitivity, 96.2% specificity, 97.5% positive predicative value, and 69.4% negative predictive value (table 3). Of the patients with RRMS who did not fulfill both criteria, 7 of 11 had either an ovoid lesion perpendicular to a lateral ventricle or a subcortical lesion with morphology suggestive of location in the U-fiber (examples of these lesions are shown in figure e-2). Adding this as a further criterion resulted in a 92% sensitivity, 96.2% specificity, 97.9% positive predictive value, and 86.2% negative predictive value. A flow diagram summarizing the way in which these criteria should be applied is given in figure 3.
Table 3.
Numbers of subjects fulfilling and the sensitivity and specificity of each criterion/combination of criteria for the separation of RRMS from NMOSD
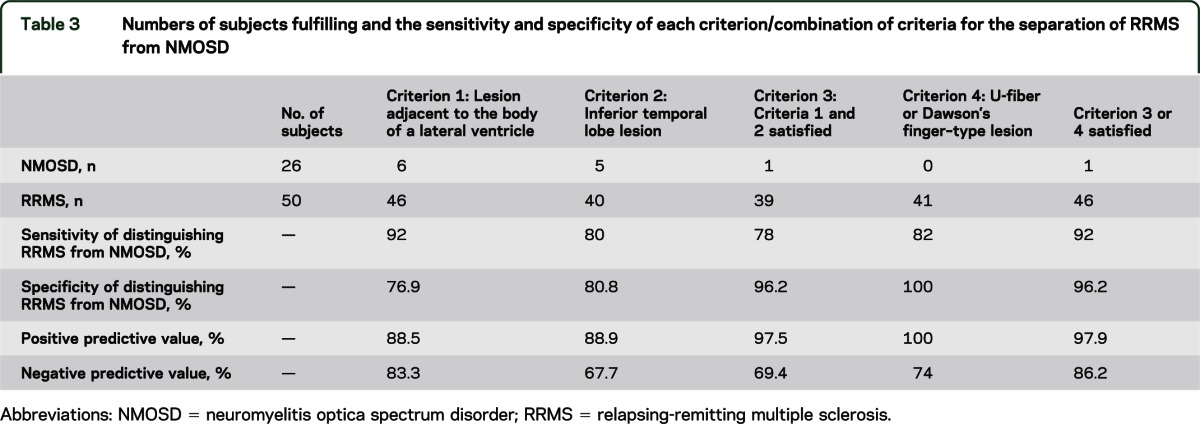
Figure 3. Flow diagram summarizing application of criteria for the separation of relapsing-remitting multiple sclerosis (RRMS) and neuromyelitis optica spectrum disorder (NMOSD).
The definition of an NMO typical brain lesion (e.g., a lesion that occurs in the periependymal brain tissue or hypothalamus)18 is relatively subjective and RRMS lesions can also occur in these locations. The criteria are designed to be used objectively by nonexperts and therefore the term “NMO typical” has been avoided in this study. However, we investigated whether a lesion adjacent to the fourth ventricle could help to correctly identify NMOSD. This did not improve the accuracy of the criteria—in fact, only 9% of patients with NMOSD who were AQP4-ab positive in this study had lesions that may be considered NMO typical, consistent with previous literature.19
DISCUSSION
By applying a quantitative lesion probability mapping approach to a large cohort of AQP4-ab–positive NMOSD patients and RRMS patients, we have been able to identify important differences in brain lesion distribution. Consequently, we propose criteria to aid the diagnostic separation of RRMS and NMOSD. These are at least 1 lesion on a T2-weighted scan (which could be T2 spin echo or fluid-attenuated imaging) in both the inferior temporal lobe and adjacent to the body of the lateral ventricle, or either a subcortical lesion with a U-fiber–type morphology (s-shaped or curved) or an ovoid lesion perpendicular to the lateral ventricle (Dawson's fingers). This identifies RRMS with 92% sensitivity and 96.2% specificity. The criteria therefore are very useful in making a definitive diagnosis of RRMS when faced with a patient with a borderline clinical presentation. If a patient does not fulfill the criteria, this is suggestive but not diagnostic of NMOSD and can be used in conjunction with evidence from clinical assessment and other investigations such as CSF examination.
The criteria have been formed from an approximately 2:1 RRMS:NMOSD cohort. In our clinical experience, this is a similar mix to those patients presenting with an RRMS/NMOSD overlap syndrome for diagnosis. Increasing the proportion of NMOSD patients would increase the accuracy and vice versa. Hence, these are not suitable for screening an unselected population of patients with MS. Of note, the criteria's ability to separate the 2 conditions is strong despite only using NMOSD patients who have T2 lesions—a normal brain scan (in this cohort found in 34% of subjects) is highly in favor of a diagnosis of NMOSD over RRMS, as previously reported.1,5,19
We have shown that in NMOSD patients with brain lesions, the distribution is variable and can be disseminated throughout the cerebral gray and white matter, as can be found in patients with MS. Consequently, 27% of NMOSD patients with brain lesions fulfilled Barkhof criteria for the dissemination of MS lesions in space,17 and it is likely that the addition of gadolinium-enhanced scans and spinal cord imaging would have increased the proportion further, so careful localization and consideration of the morphology is important. None of the patients with NMOSD had ovoid lesions in a perpendicular alignment to the lateral ventricles, and none had U-fiber–shaped subcortical lesions.
The probability distribution map for our cohort of patients with RRMS, showing that lesions are most likely to occur adjacent to the lateral ventricles, is consistent with previous findings.20,21 Also consistent with previous case studies is our observation that the most common location for an NMOSD lesion is deep white matter.19,22,23 We also show that medullary lesions are more common in NMOSD than RRMS. These lesions may be contiguous with a high cervical spinal cord lesion.
Three patients with NMOSD were excluded because they had brain lesions compatible with vascular pathology. They are acknowledged in this report (figure e-1) to highlight that one must be aware of possible comorbid causes of brain MRI abnormalities because NMOSD can present for the first time in older people. Deep white matter lesions documented in the 26 patients with NMOSD used in our lesion distribution analysis were found in patients with an age range of 19 to 66 years, indicating that they are unlikely to be due to a non-AQP4-ab–mediated vascular cause.
To truly characterize the lesion distribution of patients with NMOSD, it has been necessary to only include AQP4-ab–positive patients in our study cohort, i.e., so that the diagnosis is not in doubt. The RRMS patient data included was collected retrospectively and therefore it was not possible to test all of them for AQP4-abs. Sixteen of the 50 patients with RRMS were tested using the Oxford cell-based assay and found to be negative. During previous validation of this assay, no patients with MS were found to have AQP4-abs.4,12
The next stage of this work is to validate our proposed criteria in an independent cohort and to prospectively test their utility in the management of antibody-negative patients who present with an opticospinal syndrome.
Supplementary Material
ACKNOWLEDGMENT
The authors acknowledge the National Commissioning Group funding for the UK NMO service from which some of the patients were recruited. The authors thank Prof. Angela Vincent, Dr. Paddy Waters, and Dr. Mark Woodhall for their work in developing and validating the AQP4-ab assay and testing the study cohort.
GLOSSARY
- AQP4
aquaporin-4
- AQP4-abs
aquaporin-4 antibodies
- FLAIR
fluid-attenuated inversion recovery
- FMRIB
Functional Magnetic Resonance Imaging of the Brain
- LETM
longitudinally extensive transverse myelitis
- MNI
Montreal Neurological Institute
- MS
multiple sclerosis
- NMO
neuromyelitis optica
- NMOSD
neuromyelitis optica spectrum disorder
- RRMS
relapsing-remitting multiple sclerosis
Footnotes
Supplemental data at www.neurology.org
AUTHOR CONTRIBUTIONS
Dr. Matthews: study concept and design, acquisition and analysis of data, preparation of manuscript including figures. Dr. Marasco, Dr. Jenkinson, and Dr. Küker: data analysis and interpretation. Dr. Luppe: acquisition and preparation of data. Dr. Leite: acquisition of data, interpretation and critical revision of manuscript. Dr. Giorgio: acquisition and preparation of data, data analysis, critical revision. Prof. De Stefano: acquisition and preparation of data, data analysis, critical revision of manuscript. Prof. Robertson: acquisition of data. Prof. Johansen-Berg: data analysis and interpretation, critical revision. Prof. Evangelou: study concept and design, data acquisition and interpretation, critical revision. Dr. Palace: study concept and design, data acquisition and interpretation, critical revision, study supervision.
STUDY FUNDING
This work was supported by the Medical Research Council, UK (G0901996 to L.M.), Wellcome Trust (H.J.-B.), and the NIHR Biomedical Research Centre, Oxford (H.J.-B.). The authors acknowledge the National Commissioning Group funding for the UK NMO service from which the patients were recruited.
DISCLOSURE
L. Matthews and R. Marasco report no disclosures relevant to the manuscript. M. Jenkinson receives royalties from ISIS Innovation for FMRIB Software Library (FSL). W. Küker and S. Luppe report no disclosures relevant to the manuscript. M.I. Leite has received funding from the Sir Halley Stewart Trust and payments for lectures and travel expenses from Biogen Idec, Japan and UK. A. Giorgio reports no disclosures relevant to the manuscript. N. De Stefano is on the Scientific Advisory Board for Merck Serono and receives research support from the Italian MS Society. He has received speaker honoraria from Teva Pharmaceutical Industries Ltd., BioMS Medical, Biogen-Dompe, AG, Bayer Schering Pharma, and Merck Serono, and funding for travel from Teva Pharmaceutical Industries Ltd. and Merck Serono. N. Robertson reports no disclosures relevant to the manuscript. H. Johansen-Berg is funded by a fellowship from the Wellcome Trust and is also supported by a grant from the NIHR. She receives royalties from Elsevier for edited volume Diffusion MRI. N. Evangelou is on the advisory boards of Genzyme, Novartis, and Bayer. He has received grants from the MS Society UK and support to attend conferences from Merck Serono and Novartis. J. Palace is on the advisory boards of Biogen Idec, Merck Serono, Teva Aventis, Bayer Schering, and Novartis. She has received funding from the MS Society UK and the Medical Research Council, UK. She has a patent pending with ISIS Innovation (Oxford University). She has received conference support from Merck Serono and Novartis. Go to Neurology.org for full disclosures.
REFERENCES
- 1.Wingerchuk DM, Lennon VA, Pittock SJ, Lucchinetti CF, Weinshenker BG. Revised diagnostic criteria for neuromyelitis optica. Neurology 2006;66:1485–1489 [DOI] [PubMed] [Google Scholar]
- 2.Lennon VA, Wingerchuk DM, Kryzer TJ, et al. A serum autoantibody marker of neuromyelitis optica: distinction from multiple sclerosis. Lancet 2004;364:2106–2112 [DOI] [PubMed] [Google Scholar]
- 3.Lennon VA, Kryzer TJ, Pittock SJ, Verkman AS, Hinson SR. IgG marker of optic-spinal multiple sclerosis binds to the aquaporin-4 water channel. J Exp Med 2005;202:473–477 [DOI] [PMC free article] [PubMed] [Google Scholar]
- 4.Waters P, Jarius S, Littleton E, et al. Aquaporin-4 antibodies in neuromyelitis optica and longitudinally extensive transverse myelitis. Arch Neurol 2008;65:913–919 [DOI] [PubMed] [Google Scholar]
- 5.Wingerchuk DM, Hogancamp WF, O'Brien PC, Weinshenker BG. The clinical course of neuromyelitis optica (Devic's syndrome). Neurology 1999;53:1107–1114 [DOI] [PubMed] [Google Scholar]
- 6.McDonald WI, Compston A, Edan G, et al. Recommended diagnostic criteria for multiple sclerosis: guidelines from the International Panel on the Diagnosis of Multiple Sclerosis. Ann Neurol 2001;50:121–127 [DOI] [PubMed] [Google Scholar]
- 7.Palace J, Leite MI, Nairne A, Vincent A. Interferon beta treatment in neuromyelitis optica: increase in relapses and aquaporin 4 antibody titers. Arch Neurol 2010;67:1016–1017 [DOI] [PubMed] [Google Scholar]
- 8.Kim SH, Kim W, Li XF, Jung IJ, Kim HJ. Does interferon beta treatment exacerbate neuromyelitis optica spectrum disorder? Mult Scler 2012;18:1480–1483 [DOI] [PubMed] [Google Scholar]
- 9.Sellner J, Boggild M, Clanet M, et al. EFNS guidelines on diagnosis and management of neuromyelitis optica. Eur J Neurol 2010;17:1019–1032 [DOI] [PubMed] [Google Scholar]
- 10.Matthews LA, Baig F, Palace J, Turner MR. The borderland of neuromyelitis optica. Pract Neurol 2009;9:335–340 [DOI] [PubMed] [Google Scholar]
- 11.Takahashi T, Fujihara K, Nakashima I, et al. Anti-aquaporin-4 antibody is involved in the pathogenesis of NMO: a study on antibody titre. Brain 2007;130(pt 5):1235–1243 [DOI] [PubMed] [Google Scholar]
- 12.Waters PJ, McKeon A, Leite MI, et al. Serologic diagnosis of NMO: a multicenter comparison of aquaporin-4-IgG assays. Neurology 2012;78:665–671 [DOI] [PMC free article] [PubMed] [Google Scholar]
- 13.Polman CH, Reingold SC, Edan G, et al. Diagnostic criteria for multiple sclerosis: 2005 revisions to the "McDonald Criteria." Ann Neurol 2005;58:840–846 [DOI] [PubMed] [Google Scholar]
- 14.Smith SM, Jenkinson M, Woolrich MW, et al. Advances in functional and structural MR image analysis and implementation as FSL. Neuroimage 2004;23(suppl 1:S208–S219 [DOI] [PubMed] [Google Scholar]
- 15.Woolrich MW, Jbabdi S, Patenaude B, et al. Bayesian analysis of neuroimaging data in FSL. Neuroimage 2009;45(1 suppl):S173–S186 [DOI] [PubMed] [Google Scholar]
- 16.Jenkinson M, Bannister P, Brady M, Smith S. Improved optimization for the robust and accurate linear registration and motion correction of brain images. Neuroimage 2002;17:825–841 [DOI] [PubMed] [Google Scholar]
- 17.Barkhof F, Filippi M, Miller DH, et al. Comparison of MRI criteria at first presentation to predict conversion to clinically definite multiple sclerosis. Brain 1997;120(pt 11):2059–2069 [DOI] [PubMed] [Google Scholar]
- 18.Pittock SJ, Weinshenker BG, Lucchinetti CF, Wingerchuk DM, Corboy JR, Lennon VA. Neuromyelitis optica brain lesions localized at sites of high aquaporin 4 expression. Arch Neurol 2006;63:964–968 [DOI] [PubMed] [Google Scholar]
- 19.Pittock SJ, Lennon VA, Krecke K, Wingerchuk DM, Lucchinetti CF, Weinshenker BG. Brain abnormalities in neuromyelitis optica. Arch Neurol 2006;63:390–396 [DOI] [PubMed] [Google Scholar]
- 20.Lee MA, Smith S, Palace J, et al. Spatial mapping of T2 and gadolinium-enhancing T1 lesion volumes in multiple sclerosis: evidence for distinct mechanisms of lesion genesis? Brain 1999;122(pt 7):1261–1270 [DOI] [PubMed] [Google Scholar]
- 21.Kincses ZT, Ropele S, Jenkinson M, et al. Lesion probability mapping to explain clinical deficits and cognitive performance in multiple sclerosis. Mult Scler 2011;17:681–689 [DOI] [PubMed] [Google Scholar]
- 22.Cabrera-Gomez J, Saiz-Hinarejos A, Graus F, et al. Brain magnetic resonance imaging findings in acute relapses of neuromyelitis optica spectrum disorders. Mult Scler 2008;14:248–251 [DOI] [PubMed] [Google Scholar]
- 23.Kim JE, Kim SM, Ahn SW, et al. Brain abnormalities in neuromyelitis optica. J Neurol Sci 2011;302:43–48 [DOI] [PubMed] [Google Scholar]
Associated Data
This section collects any data citations, data availability statements, or supplementary materials included in this article.


