

Abstract
The rate of any chemical reaction or process occurring in the brain depends on temperature. While it is commonly believed that brain temperature is a stable, tightly regulated homeostatic parameter, it fluctuates within 1–4 °C following exposure to salient arousing stimuli and neuroactive drugs, and during different behaviors. These temperature fluctuations should affect neural activity and neural functions, but the extent of this influence on neurochemical measurements in brain tissue of freely moving animals remains unclear. In this Review, we present the results of amperometric evaluations of extracellular glutamate and glucose in awake, behaving rats and discuss how naturally occurring fluctuations in brain temperature affect these measurements. While this temperature contribution appears to be insignificant for glucose because its extracellular concentrations are large, it is a serious factor for electrochemical evaluations of glutamate, which is present in brain tissue at much lower levels, showing smaller phasic fluctuations. We further discuss experimental strategies for controlling the nonspecific chemical and physical contributions to electrochemical currents detected by enzyme-based biosensors to provide greater selectivity and reliability of neurochemical measurements in behaving animals.
Keywords: Brain metabolism, amperometry, enzyme-based sensors, glutamate, glucose, neuronal activity, cerebral blood flow
Although microdialysis is still widely used in assessing the dynamics of neurochemical changes in the brain, this technique is essentially slow, placing significant constraints for revealing rapid drug- and behavior-associated fluctuations in extracellular levels of neuroactive substances in brain tissue. Electrochemical techniques, due to their excellent temporal and better spatial resolution, provide an important addition to microdialysis. However, as with any indirect technique, the selectivity of these measurements remains a troublesome problem. Electrochemical techniques were originally employed for evaluating changes in extracellular levels of oxidizable substances (i.e., ascorbate, monoamine neurotransmitters and their metabolites), which generate oxidation (and reduction) currents by an applied potential. Since different electroactive substances are oxidized (and reduced) at different voltages, further sophistication of this approach by using fast-cyclic voltammetery has made it possible to reveal relatively small but highly phasic fluctuations in extracellular dopamine levels in brain regions receiving dense dopamine innervation.1−7 Using this approach, significant progress has been made to clarify the functional role of dopamine in regulating natural motivated behavior and its involvement in the action of various neuroactive drugs.
However, many important brain substances are not electroactive, necessitating alternative electrochemical techniques for their detection in brain tissue. One such strategy is through the use of enzyme-based biosensors, which convert nonoxidizable substances of interest into oxidizable products that are subsequently quantified based on changes in oxidation current. While this approach is based on the premise that the detected oxidation current is overwhelmingly due to changes in the levels of the measured compound of interest, real-life measurements in awake, behaving animals are more complex, requiring the resolution of different technical problems and conducting multiple controls.
In this Review, we present several sets of our recently published and unpublished data dealing with the evaluation of physiological fluctuations in extracellular brain levels of glutamate and glucose, and discuss different issues related to the sensitivity and selectivity of these measurements. Our specific focus is on brain temperature, a basic parameter related to metabolic neural activity and a significant contributor to the changes in electrochemical currents recorded in behaving animals. Despite the widely held view that temperature in the brain is highly stable, it in fact fluctuates in freely moving rats within 3–4 °C over the continuum of normal physiological activity (see ref (8) for review). While most technical development in detection has focused on improving sensitivity and selectivity with respect to chemical interferents, naturally occurring temperature fluctuations also affect all basic aspects of electrochemical measurements, including substrate-specific enzymatic reactions, basal electrochemical currents, and stimulus- and drug-induced current alterations. While several aspects of this influence are common for any electrochemical measurement, the impact of this influence differs for various substances depending upon their basal brain levels and the range of concentration change. Finally, we consider experimental strategies for controlling and minimizing these nonspecific chemical and physical contributions to electrochemical currents detected by enzyme-based biosensors to provide greater selectivity and reliability of neurochemical measurements in behaving animals.
1. Physiological Fluctuations in Brain Temperature
In contrast to skeletal muscles, which change their energetic requirements depending upon their activity, the living brain is metabolically active all the time, with relatively small fluctuations in energy use between sleep and wakefulness. Although the brain represents only ∼2% of the human body’s mass, it accounts for ∼20% of the organism’s total oxygen consumption.9,10 While most of the energy used for neuronal metabolism is spent restoring membrane potentials after electrical discharges,10−15 significant energy is also used for neural processes not directly related to electrical activity, including synthesis of macromolecules, transport of protons across mitochondrial membranes, and functioning of multiple transporters on neural and glial cells that move various molecules across biological membranes. Since all of the energy used for brain metabolism is finally transformed into heat, (10) intense intracerebral heat production occurs during normal brain activity.
To maintain temperature homeostasis, intracerebral heat production must be balanced by heat dissipation from the brain. Since the brain is well protected from mechanical damage and external temperature impact by the skull, the only way for the brain to lose metabolic heat is to dissipate it to the blood, which is continuously flowing to and from brain tissue. Paralleling its high oxygen consumption, the brain receives a disproportionally large amount (15–20%) of the body’s blood supply (see ref (16) for review). To allow heat dissipation to the blood and then to the external environment, arterial blood arriving to the brain after its oxygenation and cooling in the lungs must always have a lower temperature than that of brain tissue. This has been confirmed experimentally in several animal species, including humans.17−23
However, while intense intracerebral heat production is compensated by efficient heat outflow from the brain, direct recordings in animals have revealed relatively large increases in brain temperature induced by various arousing stimuli and during different behaviors.17,24−28 In our studies, brain temperature was recorded by miniature copper-constantan thermocouple sensors chronically implanted in different brain structures. Monitoring of brain temperature was supplemented by simultaneous temperature recordings from temporal muscle, skin, and other body locations, thus providing essential information on the mechanisms responsible for brain temperature fluctuations (see ref (8) for review). For example, the mean temperature in the nucleus accumbens (NAcc), a ventrally located brain structure critical for regulating motivated behavior, greatly varies in rats under different experimental conditions (Figure 1). While the “normal” daytime NAcc temperature in well habituated and resting rats is 36.7 ± 0.1 °C (i.e., very close to “normal” human temperature), during slow-wave sleep it phasically falls at least 1 °C (35.3 ± 0.1 °C29) while it phasically increases at least 2 °C at the moment of male ejaculation during copulatory behavior (38.8 ± 0.1 °C30). Thus, a 3.5–4.0 °C variation (from 35.5 to 38.8 °C) appears to represent a measured range of physiological fluctuations in brain temperature. However, rats can tolerate brain temperatures that exceed this range. For example, mean NAcc temperature during pentobarbital anesthesia (50 mg/kg, ip) falls to 32.8 ± 0.3 °C (or ∼5 °C below “normal” baseline), with decreases down to 30 °C observed in individual animals31 (see also refs (32 and 33)). In contrast, psychomotor stimulants induce robust increases in brain temperature.34,35 For example, methamphetamine (METH) dose-dependently increases NAcc temperature, reaching mean values of ∼39.9 ± 0.1 °C with a 9 mg/kg sc dose (see Figure 1). While some animals show slightly higher peak temperature increases (∼40.5 °C), they typically tolerate METH at this large dose, with no lethality and obvious delayed behavioral abnormalities. Brain temperatures also strongly increase during drug self-administration behavior. During cocaine self-administration, NAcc temperatures rapidly rise at the beginning of the session and then remain relatively stable and elevated (38.2 ± 0.1 °C) during subsequent cyclical drug-taking behavior. (36) A similar dynamic has been seen during heroin self-administration; in this case, NAcc temperatures stabilized at higher levels (39.5 ± 0.1 °C), suggesting that the upper limits of apparently “safe” temperature increases could be close to 40 °C.37 Surprisingly, lipopolysaccharides, which are bacterial endotoxins that trigger a fever response, produced weaker but more prolonged increases in NAcc temperature38 than those induced by natural arousing stimuli and neuroactive drugs (see Figure 1).
Figure 1.

Mean (±SEM) values of brain temperature (directly recorded from the NAcc shell) in different experimental conditions in rats. Green hatched line shows the limits of physiological temperature fluctuations (3.4–4.0 °C), the blue vertical line shows the survivability limits (32–40 °C, or 8 °C), and the red line shows the threshold of pathological brain hyperthermia. Compiled from previously published data.30,31,34−38
In contrast to brain region-specific changes in neuronal electrical activity, brain temperature fluctuations induced by arousing stimuli, drugs, and motivated behavior are generally similar across different regions. However, quantitative analyses reveal weak but important between-region differences (see ref (8) for review). Within the same brain, temperature also follows a dorso-ventral differential, with higher values in more ventrally located structures and lower values in more superficially located structures.17,39−43 Typically, the difference between cortical and deep subcortical structures in humans and monkeys is less than 1 °C,25,41 but it is often larger in the small brains of rats and mice, especially in anesthetized preparations. (44) Brain temperature responses induced by arousing stimuli are also slower and more prolonged than changes in neuronal activity and greatly exceed the duration of stimuli. For example, during a 3 min tail-pinch, NAcc temperature rapidly increases, peaks at ∼10 min, and slowly decreases back to the prestimulus baseline over 30–40 min (Figure 2A). By simultaneous recording of arterial blood temperature in freely moving rats, (20) it has been demonstrated that increases in brain temperature induced by various arousing stimuli are due to intracerebral heat production. Although arterial blood temperature also increased during tail-pinch, NAcc temperature increases are always more rapid and stronger than in arterial blood, resulting in a significant rise in brain-blood temperature differentials (Figure 2B). Similar changes, with stronger and more rapid temperature increases in brain versus peripheral locations, are observed with other arousing stimuli. This differential, while weaker and more transient than absolute temperature increases, is a true measure of metabolic brain activation triggered by various arousing stimuli. (8) While they clearly occur more slowly than neuronal responses, changes in brain temperature are still relatively quick, becoming significant versus baseline at ∼10 s after the onset of stimuli (Figure 2C).
Figure 2.

Mean changes in NAcc and arterial blood temperatures (A) and their difference (B) during 3-min tail-pinch in freely moving rats. Panel (C) shows the initial component of NAcc and blood temperature response assessed at high temporal resolution (2 s bins). Vertical hatched lines show onset and offset of tail-pinch, and horizontal hatched lines show basal values. Values significantly different from baseline are shown as filled symbols. Data obtained in 4 rats during 37 tail-pinch trials in 19 daily sessions. Data in (A) show mean ± SEM. Based on original data presented in ref (20).
Therefore, brain temperatures in awake, freely moving rats vary within 35.5–39.0 °C during the normal physiological and behavioral continuum. However, brain temperature can fall well below the lower physiological range during general anesthesia (without body warming) and can increase above the upper limit following exposure to different neuroactive drugs at large doses. While metabolic neural activation is the primary source of intracerebral heat accumulation, brain temperature is also strongly modulated by the efficiency of cerebral blood flow that removes metabolic heat to the blood, body, and then to the external environment.
2. Temperature Dependence of Neural Activity
Heat release is an obvious “by-product” of metabolic activity, but the changes in brain temperature it induces can directly affect various neural processes and functions. It is generally believed that most physical and chemical processes governing neuronal activity are modulated by temperature with the average van’t Hoff coefficient Q10 = 2–3 (i.e., doubling or tripling with 10 °C change45). However, experiments using in vitro slices have revealed widely varying effects of temperature on passive membrane properties, single spikes and spike bursts, as well as the neuronal responses (i.e., EPSPs and IPSPs) induced by electric stimulation of tissue or its afferents.15,46−50 While confirming that synaptic transmission is more temperature-dependent than the generation of action potentials,51 these studies have shown that temperature dependence varies greatly for each individual neural parameter, the type of cells under study, and the nature of their afferent input.
Although changes in brain temperature should affect the activity and responsiveness of all neurons, a special subgroup of temperature-sensitive neurons was first described in the preoptic/anterior hypothalamus.52−54 However, further work has revealed that cells in many other structures (i.e., visual, motor and somato-sensory cortex, hippocampus, medullary brain stem, thalamus, spinal cord) also show dramatic modulation of impulse activity by temperature. Many of these cells, moreover, have a Q10 similar to classic warm-sensitive hypothalamic neurons. In the medial thalamus, for example, 22% of cells show a positive thermal coefficient of >0.8 imp/s/°C, (55) exceeding the number of temperature-modulated cells found in both anterior (8%) and posterior (11.5%) hypothalamus. About 18% of neurons in the suprachiasmatic nucleus are warm-sensitive, (56) while >70% of these cells decrease their activity rate with cooling below physiological baseline (37–25 °C). (57) Finally, electrophysiologically identified substantia nigra dopamine (DA) neurons have been found to be highly temperature-sensitive in vitro. (58) Within the physiological range (34–39 °C), their discharge rate increases with warming (Q10 = 3.7) and dramatically decreases (Q10 = 8.5) with cooling below physiological range (34–29 °C). This temperature dependence could explain, at least in part, the dramatic differences in electrophysiological properties of DA neurons found between in vitro, anesthetized, and awake, freely moving animal preparations (see ref (59) for review).
Since temperature affects discharge rate and evoked synaptic responses, transmitter release should be also strongly temperature-dependent, and indeed the Q10 for K+-induced glutamate and GABA release is within 3.6–5.5 and 3.5–6.3, respectively, (60) and the Q10 for K+- and capsaicin-induced release of calcitonin gene-related peptide is 11.3–37.7. (61) However, in vivo, temperature-dependent changes in transmitter release are opposed by changes in transmitter uptake. For example, within the physiological range, DA uptake almost doubles with a 3 °C temperature increase (Q10 = 3.5–5.962), a change easily achieved in the brain under conditions of physiological activation. Therefore, increases in transmitter release during metabolic neural activation appear to be compensated by increases in transmitter reuptake, thus making neurotransmission more efficient but more energy consuming.
3. Electrochemical Evaluations of Physiological Changes in Extracellular Glutamate and Glucose
Glutamate is the major excitatory neurotransmitter essential for maintaining and regulating central activational processes. Despite extensive research regarding the action of glutamate on central neurons,63,64 its functional role in behavioral processes remains less clear. Glutamate is usually viewed as a rapidly acting neurotransmitter that is released at high concentrations (∼1 mM) into synaptic gaps to interact with low-affinity glutamate receptors located on the postsynaptic membrane within the synaptic gap.65,66 However, glutamate also spills over from synapses and is also released from boutons that do not make synaptic contacts, where it diffuses outward to interact with high-affinity nonsynaptic (perisynaptic or extrasynaptic) glutamate receptors. (67) In this case, distances between release sites and receptors could be from a few hundreds of nanometers to a few hundred micrometers and the effective glutamate concentrations in the extracellular space could be much lower, between 0.1 and 3.0 μM. Glutamate is also released by glial cells (see ref (68) for review) to interact with extrasynatic glutamate receptors located on both neural and glial cells. (67) In contrast to synaptic glutamate transmission, which is involved in rapid information transfer between neural cells, the functional role of nonsynaptic glutamate transmission that may exert effects on a slower time scale remains unclear. Although in vivo microdialysis has been widely used for measuring changes in glutamate transmission,69,70 the low temporal resolution of this technique (on the order of minutes) places significant constraints on revealing rapid drug- and behavior-associated fluctuations, despite recent advances in more rapid detection.71 In contrast, direct electrochemical detection methods have much better temporal resolution, but their measurement selectivity in vivo is always problematic. While glutamate-selective, enzyme-based electrochemical sensors were developed in the 1990s72−74 and their selectivity validated by subsequent work,68,75−79 the use of these sensors in awake, behaving animals has thus far been limited. Among physiological parameters, several recent studies have focused on glutamate fluctuations during the sleep–wake cycle,80−82 an activity accompanied by relatively large (1–2 °C) brain temperature fluctuations (see above).
Although glucose is the primary source of energy for the brain and its proper delivery to brain cells is essential for normal brain functions,10,83 our knowledge of how and why its brain levels change remains controversial. It is known that neural activation results in enhanced glucose utilization in brain cells,10,84 suggesting possible decreases in its extracellular levels. On the other hand, neural activation is accompanied by rapid increases in local cerebral blood flow,83,85−90 pointing to enhanced entry of glucose into brain tissue from the peripheral blood, where its concentration is much higher.91−93 However, it remains unclear how this balance is maintained under physiologically relevant conditions and how it is changed during neural activation. Previous microdialysis studies have revealed that arousing stimuli such as tail-pinch and restraint increase extracellular glucose levels in various brain structures,91,94,95 suggesting that the inflow of glucose into the brain during neural activation overcomes its consumption. In this regard, electrochemical studies have produced controversial results; increases, decreases, and down–up glucose fluctuations were found in the striatum and hippocampus following arousing stimulation.96−98 While the reasons for these differential responses are not clear, they could be related to structure-specific differences in neuronal activity. Since local cerebral blood flow could change in brain tissue on a scale of seconds,99,100 area-specific differences in glucose response could be related at least in part to differences in temporal resolution of measurements. Electrochemical techniques, due to their high temporal resolution, might be used to clarify this issue by assessing patterns of extracellular glucose levels in individual brain structures under physiologically relevant conditions.
A. Strategies for the Detection of Nonoxidizable Neuroactive Compounds
Unlike some neurochemical compounds, such as monoamine neurotransmitters that are easily oxidizable and can be detected by cyclic voltammetry,3−5 both glutamate and glucose are not natively oxidizable. Enzyme-based biosensors overcome this problem by chemically converting nonoxidizable compounds into oxidizable substances. In the case of glutamate sensors, glutamate oxidase coverts glutamate into α-ketoglutarate and oxidizable H2O2, (73) while in glucose sensors glucose oxidase converts glucose into glucono-1,5-lactone and H2O2. (101) In both cases, H2O2 is detected amperometrically as an oxidation current. Therefore, the change in oxidation current is a correlated measure of change in the extracellular levels of each of these substances. The commercially produced Pt–Ir glutamate and glucose sensors used in our studies (Pinnacle Technology, Lawrence, KS) have a 180 μm × 1000 μm sensing area and showed high sensitivity to these substances and relatively high selectivity against other potential chemical interferents (i.e., other readily oxidizable neurochemicals that can evoke a current response such as ascorbate, dopamine, DOPAC, and urate; see refs (102 and 103)).
When tested in vitro before in vivo recording (Figure 3A), glutamate sensors produced an ∼0.32 nA increase in oxidation current with addition of 1 μM glutamate. The detection threshold of these sensors was ∼0.02 nA, thus allowing detection of ∼58 nM glutamate during a single test. It is known that the detection limit progressively increases with an increase in the number of superimposed tests as √n. Taking into account microdialysis estimates suggesting that basal extracellular glutamate levels in awake, freely moving rats are within 0.5–3.0 μM,67,68,104 these sensors appear to be sufficiently sensitive to detect physiological fluctuations in extracellular glutamate levels. Glucose sensors (Figure 3B) during prerecording in vitro tests showed ∼7.11 nA current increase with addition of 1 mM glucose, thus allowing detection of ∼3 μM of this substance during one test. These sensitivity values are also sufficient to detect physiological levels of extracellular glucose, which based on microdialysis data are within 0.5–2.0 mM,91,96,105−107 about 3 orders of magnitude higher than those for glutamate. Glutamate sensors decreased their substrate sensitivity ∼50% after ∼8 h in vivo use (Figure 3A). While this change could reflect a decrease in the enzyme’s activity while in the brain, it could also be related to contamination of the active area by albumin and other brain substances during in vivo recording. In contrast, glucose sensors did not change their substrate sensitivity after ∼8-h in vivo recording (see Figure 3B).
Figure 3.
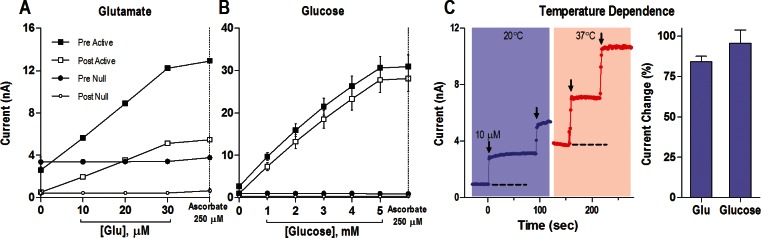
In vitro current response of glutamate (A) and glucose (B) substrate-specific (Active) and substrate-null (Null) biosensors to different concentrations of substrate before (Pre) and after (Post) an in vivo recording. Panel (C) shows the current response of an example glutamate biosensor at 20 °C versus 37 °C. Dashed lines represent the baseline current in vitro at each temperature, and each arrow indicates the time when 10 μM glutamate was added. Note that the baseline at 37 °C is approximately equivalent to the current response to 10 μM glutamate at 20 °C. Right bar graph indicates the percent increase in current between 20 and 37 °C for the glutamate and glucose sensors tested. Based on original data presented in refs (102 and 103).
B. Temperature Dependence of Electrochemical Currents: In Vitro Tests
Since enzyme-based biosensors essentially employ a chemical strategy for detection, they should be sensitive to changes in temperature. While basal temperatures in the brains of freely moving rats fluctuate around 37 °C, sensitivity tests in electrochemical studies are often conducted at room temperature (22–23 °C). Since this temperature difference could have strong effects on the enzymatic oxidation of glutamate and glucose, we conducted sensitivity tests at 37 °C and compared the results with those obtained at room temperatures. Indeed, these tests revealed that the sensitivity of both types of sensors at 37 °C is about 2-fold greater than that measured at room temperature. For glutamate sensors, the current response increased 84.1 ± 3.5% with a 14 °C temperature increase, and for glucose sensors it grew 95.6 ± 8.3% for a 15 °C temperature increase (see Figure 3C and D). Therefore, substrate sensitivity of both types of sensors is temperature dependent, increasing ∼6.0–6.2% for every 1 °C. While these differences could be viewed as small, they could result in an almost 2-fold overestimation of basal concentrations and concentration changes in both molecules during in vivo experiments if the sensors are calibrated at room temperature. Therefore, calculations of concentrations from raw current data in our studies were conducted with a correction of sensitivity values by these temperature coefficients, thus resulting in a new, higher sensor sensitivity of ∼0.59 nA for 1 μM glutamate and ∼13.90 nA for 1 mM glucose.
We also examined how changes in temperature affect basal electrochemical currents. For this test, we monitored background electrochemical currents in vitro following warming and subsequent cooling of the testing solution within 3–5 °C (33–38 °C). During this test, we found that basal electrochemical currents in both types of sensors change ∼0.091 ± 0.009 nA with each 0.5 °C temperature increase. Therefore, if brain temperature during in vivo recording increases 0.5 °C, electrochemical currents detected by glucose and glucose sensors could increase up to 0.09 nA, creating an artifactual rise in concentration, which for glutamate could reach ∼152 nM and for glucose ∼6.5 μM. By correlating these values with reported basal levels of extracellular glutamate and glucose (∼1 μM and ∼1 mM, respectively), it is evident that the temperature contribution during in vivo recording should be much stronger for glutamate (up to 15% of basal levels) than for glucose (0.5–1.0%).
Taking into account the possibility of a strong confound of nonspecific chemical and physical interference to currents detected by glutamate and glucose sensors in vivo, both our studies incorporated null sensors that are identical to the active sensors in their construction but lack specific enzymes and are thus fully insensitive to either substrate (see Figure 3A and B). Null sensors provide the best possible control for substrate specificity because they are equally sensitive to all physical and chemical interferents (i.e., temperature, ascorbate, dopamine, etc.) except the substance of interest. It should be noted that the use of null sensors cannot control for changes in the rates of enzymatic oxidation of the substance of interest in the active sensor due to physiological changes in temperature. However, since the amplitude of these changes is relatively small (±0.5–1.0 °C), the resulting change in sensor sensitivity due to this single factor is approximately 3–6%. Taking into account the maximal stimulus-induced changes in oxidation currents produced by glutamate sensors (0.15 nA), the possible contribution of this factor is within 0.003–0.006 nA, well below the typical noise levels of these sensors in vivo. Therefore, the difference in currents detected by active and null sensors under the same conditions could be a much more accurate measure of true stimulus-induced fluctuations in either glutamate or glucose.
C. Basal Levels of Glutamate and Glucose in the Extracellular Space
It is commonly believed that electrochemical techniques cannot provide reliable information on basal levels of neuroactive substances in the brain’s extracellular space. Typically, data are shown as either current or concentration change with respect to undefined basal levels. Although microdialysis data regarding basal levels of neuroactive substances vary, for glutamate they are typically in the low micromolar range (0.5–3.0 μM67,68,104,108). This high variability of values could be in part related to differences in substance recovery of dialysis probes, which is typically 20–25%109 but can greatly vary depending upon the technique, size of the probe, and perfusion rates.110 Importantly, this recovery is also highly temperature dependent, varying for monoamines from 18% at 24 °C to 45% at 37.5 °C or ∼18%/1 °C. (111) The most recent and accurate estimate of basal extracellular glutamate levels in the striatum obtained by no-net flux analysis is 1.0 ± 0.4 μM,110 below early estimates (3.6 μM108) but still larger than ambient glutamate levels (50–200 nM) suggested by electrophysiological studies.112
Measurements obtained with glutamate sensors typically have produced larger values, varying from 1 to 2 μM113,114 to 20–45 μM.68,78,115−117 Moreover, there are significant differences in these values in different brain structures.78,118 These values have been typically larger in early studies than those in more recent studies, which have employed self-referencing recording with sentinel electrodes. Using this approach, basal glutamate levels in anesthetized rats have been estimated to be ∼1.6 μM in the frontal cortex, 1.4 μM in the striatum, and 2.5–3.4 μM in the hippocampus.118 Since general anesthesia appears to decrease basal glutamate levels (∼60% in the striatum78), they could be larger under awake, freely moving conditions.
To evaluate basal levels of extracellular glutamate, we examined basal electrochemical currents detected by glutamate and glutamate-null sensors during long-duration in vivo recording (∼8 h) in awake, freely moving rats. Since glutamate-null sensors are exposed to the same physical and chemical influences as glutamate sensors, the current difference between two recordings should reflect the contribution of glutamate. As can be seen in Figure 4A, the mean values of both currents recorded from the NAcc changed similarly but currents detected by glutamate sensors were consistently larger than those detected by null sensors. Taking into account the substrate sensitivity of glutamate sensors at 37 °C (∼0.59 nA/1 μM), the apparent mean basal levels of extracellular glutamate in the NAcc are ∼0.96 μM, closely matching the most recent data obtained by no-net-flux microdialysis (1.0 μM110). Although basal currents for both glutamate and glutamate-null sensors slowly decreased during the session, reflecting a well-known property of electrochemical baseline changes, the decrease was similar for both types of sensors, suggesting that extracellular glutamate levels in the NAcc remain relatively stable during long-term in vivo recordings.
Figure 4.

Slow changes (mean ± SEM) in amperometric currents detected by substrate-specific and substrate-null sensors during long-term recordings in freely moving rats. As can be seen, for both glutamate (A) and glucose (B), currents slowly decreased during ∼8-h recording. A similar decrease, but at lower absolute levels, occurred with both types of null sensors recorded during the same time in vitro at 22–23 °C. Since active sensors differ from null sensors only by the presence of a specific enzyme (glutamate oxidase or glucose oxidase), the difference in currents detected by these sensors reflects the glutamate or glucose contribution (red vertical lines in A and B). Open and closed circles in (A) show current values in the NAcc shell and core, while a solid line shows their average. Panel (C) compares the proportion of the specific contribution of glutamate and glucose (in red) with respect to nonspecific contributions (gray and blue) to the overall recorded current. While these nonspecific contributions are similar for both glutamate and glucose sensors, the specific component is much larger for glucose than for glutamate. n shows number of trials averaged. Original data were reported in refs (102 and 103).
Electrochemical currents recorded by glutamate-null sensors also decreased during a similar recording interval in vitro at 22 °C, suggesting that this change is related to a physical property of both types of sensors following long-term recording but not the result of physiological changes in brain tissue. However, absolute values of these currents were much lower than those recorded by the same electrodes in vivo. This current difference reflects total nonspecific (nonglutamate-related) chemical and physical in vivo contributions to electrochemical currents. As shown in Figure 4C, these nonspecific contributions to the current (blue and gray areas) are proportionally much greater than those contributed by glutamate (red area). By comparing this current difference (∼3.7 nA at the session end) with current increase that should occur in vitro with a 15 °C temperature increase (∼2.7 nA), it is evident that temperature alone makes a larger contribution to electrochemical currents than all other chemical factors (i.e., dopamine, DOPAC, ascorbate, urate, etc.) combined.
Therefore, our values of basal extracellular glutamate levels in the ventral striatum of awake rats are close to data obtained with microdialysis but lower than those found in most electrochemical studies. Two factors could be important reasons for these differences. First, our data were obtained by analyzing currents recorded by glutamate and glutamate-null sensors in independent recording sessions. While the simultaneous recording of both currents from the same animal is usually viewed as an important condition to reveal the glutamate contribution, our tests revealed the existence of a persistent electrical cross-talk between two simultaneously used sensors. In contrast to single-sensor recording, when “all” current generated between the active and reference electrodes is detected by a potentiostat, two sensors inserted in the same brain are electrically connected and a certain amount of current generated by one sensor flows to the reference electrode of another sensor and vice versa, thus affecting both currents. Moreover, this interaction depends upon the distance between the two sensors and is stronger with short between-sensor distances. It is quite difficult to detect this interaction in vitro because it requires independent controls, but it becomes evident during in vivo recordings when the specific currents generated by glutamate oxidation are much smaller than those produced by glutamate during prerecording calibrations. Possibly, this problem could be resolved with sensors of another design or by some engineering solutions (i.e., periodic recording switching from one sensor to another), but at present the issue for us remains unresolved.
To overcome the influence of cross-talk, our recordings with glutamate-null sensors were conducted in the same brain areas using the same protocol but in a separate group of animals. Although this alternative approach made it possible to make the recordings from active and null sensors fully independent, it was much more effort-consuming, requiring equally important control data. This approach also introduces a new problem of between-subject variability, requiring a large number of trials to detect current differences between active and null recordings. The Pinnacle sensors used in our studies are relatively large in size (∼180 μm in diameter with ∼1 mm length), closer to the dimensions of a microdialysis probe than to the tips of smaller electrochemical sensors used in some studies. For example, glutamate-oxidase-coated ceramic microelectrode arrays have a sensing area of 100 μm × 50 μm,118 while the sensors used in our studies have sensing areas of 1000 μm × 560 μm, that is, ∼100-fold larger. While a smaller sensing area could be viewed as a better approach to identify rapid events with high spatial resolution, small ceramic sensors produce much smaller currents (5.4 pA/1 μM vs 590 pA/1 μM for our sensors), thus making the recordings more susceptible to various types of artifacts, especially in freely moving animals. Moreover, in sensors with larger sensing areas, glutamate detection is integrated over relatively large areas, possibly resulting in lower basal values and smaller phasic fluctuations. Finally, any sensor, especially a larger one, produces a certain amount of damage to neural tissue in the recording area. However, this cellular and vascular damage would theoretically result in larger but not smaller glutamate values.119,120 This factor could explain consistently larger values of ambient glutamate measured by both microdialysis and electrochemistry versus electrophysiological estimates based on glutamate efficiency to stimulate high-affinity nonsynaptic NMDA receptors.67,112,121
A similar analysis, comparing currents detected by glucose and glucose-null sensors during long-duration in vivo recording, was conducted to evaluate basal levels of extracellular glucose (see Figure 4B). In this case, basal currents detected by glucose sensors were also consistently larger than those detected by null sensors. Taking into account these differences (∼8.0 nA) and in vitro sensor sensitivity corrected for recordings at 37 °C (14.84 nA/1 mM), the mean values of basal glucose concentrations in the NAcc were ∼540 μM. These current differences remained similar (<10% difference) during ∼8-h in vivo recording, pointing to a relative stability of extracellular glucose levels in awake, freely moving rats. A similar analysis conducted for data obtained from the substantia nigra pars reticulata revealed similar, albeit slightly lower mean values of extracellular glucose (∼407 μM103). These concentration values are in line with microdialysis evaluations of extracellular glucose levels, which varied in different structures from 0.35 to 1.5 mM.91,94,96,105,107 As shown in Figure 4C, actual glucose (red area) contributes much more to the measured glucose current than that of all other nonspecific chemical and physical factors.
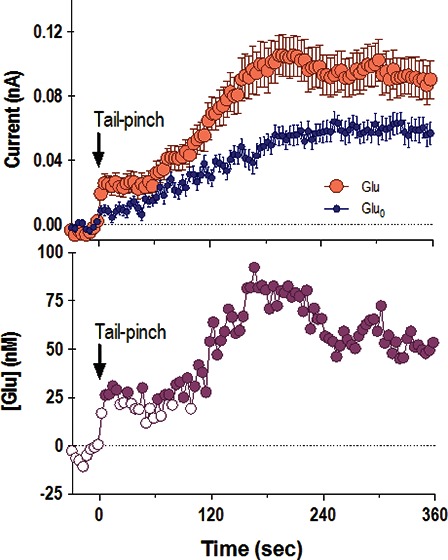
D. NAcc Glutamate Response Elicited by Tail-Pinch: Specific and Nonspecific Contributions
Figure 5 shows slow (1 min bin) changes in electrochemical currents detected by glutamate and glutamate-null sensors during a 3 min tail-pinch. Data are shown separately for two compartments of the NAcc: the shell (A–C) and the core (D–F). In both brain areas, glutamate currents showed a similar response, with a robust increase (0.10–0.12 nA) during the tail-pinch procedure and a slower decrease below the prestimulus baseline (A, D). However, glutamate-null sensors also produced a significant current increase, confirming that not all changes detected by glutamate sensors represented actual changes in glutamate levels. The subtraction procedure revealed (B and E) that the glutamate changes are significant only in the NAcc shell and are not significant in the NAcc core. In the NAcc shell, glutamate levels rapidly rose during the tail-pinch, peaked at its end, and returned to baseline at ∼12 min after the start of the procedure. This increase was relatively small, on average 90–100 nM or ∼10% of baseline glutamate levels. A small increase was also seen at the same time intervals in the NAcc core, but it did not reach statistical significance. By analyzing the rate of glutamate change (C), it is evident that glutamate increased only during the tail-pinch and the rate of change was maximal (∼40 nM/min) during the last minute of tail-pinch, when the rats usually showed robust behavioral response (e.g., chewing the wooden clothepin). Similar data, suggesting regional specificity of the glutamate response within the NAcc, were obtained for other arousing stimuli and cocaine.102
Figure 5.

Slow changes in electrochemical currents detected by glutamate and glutamate-null sensors in the NAcc shell (left panel) and NAcc core (right panel) during a 3 min tail-pinch in freely moving rats. Top row (A and D) shows mean (±SEM) changes in currents detected by both types of sensors. Middle row (B and E) shows current differences calibrated in nM glutamate concentrations. Bottom row (C and F) shows rate of changes in glutamate concentration. The two vertical hatched lines in each graph show onset and offset of tail-pinch and horizontal hatched lines show baselines. Two diagonal lines in (A) show the trend in current baselines calculated for glutamate and glutamate-null sensors from Figure 4. Asterisk in (A) shows the period of significant differences in currents (current × time interaction assessed with two-way ANOVA). Significant differences in currents (active – null) are shown in (B) as filled symbols. n indicates the number of trials analyzed. Data with glutamate sensors were obtained in 12 (NAcc shell) and 8 (NAcc core) rats, and data with null sensors were obtained in 7 (shell) and 6 (core) rats. Original data were reported in ref (102).
Since glutamate currents increased significantly during the first min of tail-pinch, we also analyzed the initial components of the glutamate response in the NAcc shell using high temporal resolution (4 s bins; Figure 6). In this case, current increases were also evident for both glutamate and glutamate-null sensors, but significant between-group differences existed across the entire analysis interval (A). In this case, extracellular glutamate levels increased rapidly at the start of tail-pinch (first significant value at 6 s), grew to their peak levels (75–80 nM) at the end of tail-pinch, and were maintained at enhanced levels for the entire duration of analysis (B). While slightly slower in its time-course, the glutamate rise at the start of tail-pinch was comparable to the excitation of striatal and accumbal neurons induced by this stimulus in awake rats.122
Figure 6.

Rapid changes in electrochemical currents (4 s bins) detected in the NAcc shell by glutamate and glutamate-null sensors following 3 min tail-pinch (A) and resulting changes in extracellular glutamate levels (B). Two vertical hatched lines at 0 and 180 s show onset and offset of tail-pinch. Horizontal hatched line in each graph show basal levels. The period of significant current × time interaction between the two currents is shown in (A) by a solid horizontal line labeled with an asterisk. Data in (A) represent mean ± SEM, and n indicates the number of averaged trials obtained in 23 and 15 rats with glutamate and glutamate-null sensors, respectively. Within this interaction, significant differences are shown in (B) as filled symbols. Data were partially presented in ref (102).
Therefore, these data suggest the importance of null sensors as a critical tool to exclude nonspecific contributions to electrochemical currents recorded by glutamate sensors in vivo. This approach reveals much weaker but highly phasic and brain-region specific changes in extracellular glutamate levels induced by arousing stimuli. This procedure also makes it possible to eliminate the negative trend in baseline currents typical of long-term (i.e., 8–10 h) amperometric recording.
E. NAcc Glucose Response to Tail-Pinch
A similar approach was used to examine physiological changes in extracellular glucose levels.103 Figure 7 shows changes in electrochemical currents detected by glucose and glucose-null sensors in the NAcc shell during 3 min tail-pinch analyzed with slow (1 min bin) and rapid (4 s) temporal resolution. In contrast to the relatively weak current increases detected by glutamate sensors (0.1–0.2 nA), tail-pinch induced much larger increases in glucose currents (0.6–1.0 nA) that greatly exceeded the currents detected by glucose-null sensors. Subtraction of these nonspecific currents revealed that glucose levels rapidly jump at the start of tail-pinch (∼50 μM), maintain at high levels for ∼10 min, and decrease to baseline afterward (B). The rapid time-course of glucose increase was confirmed when these same data were analyzed at high temporal resolution (4 s bins; C). In this case, glucose concentrations in the NAcc increased significantly within the first 4 s interval, peaked at ∼14 s (∼60 μM), and were maintained at high levels during the entire duration of analysis (D). Similar rapid glucose increases were found in the NAcc with other arousing stimuli.103 Interestingly, a randomly delivered audio tone, acting as a weak sensory stimulus, evoked a phasic increase in glucose levels in the NAcc but did not impact glutamate levels in this structure.102
Figure 7.

Slow (A) and rapid (C) changes in electrochemical currents (mean ± SEM) detected in the NAcc shell by glucose and glucose-null sensors following 3 min tail-pinch (A) and resulting changes in extracellular glucose levels (B and D). Two vertical lines at 0 and 3 min show onset and offset of tail-pinch. Horizontal hatched lines in each graph show basal levels. Active and null values significantly different from each other are shown as filled symbols. Data were obtained in 6 rats (n = number of trials). Based on original data presented in ref (103).
Therefore, the glucose-specific contribution to electrochemical currents greatly exceeds nonspecific contributions detected by glucose-null sensors. In this case, the use of glucose-null sensors appears less critical compared to glutamate-null sensors because of the high basal levels of glucose in brain tissue and relatively large changes induced by arousing stimuli. Due to high glucose levels, current changes induced by its enzymatic oxidation are much larger than those induced by all other physical and chemical contributors.
F. The nature of Nonspecific Contributions to Electrochemical Currents Detected by Glutamate and Glucose Sensors
As shown above, enzyme-free sensors produce consistent and significant increases in electrochemical currents during tail-pinch. The dynamics of these currents for both glutamate- and glucose-null sensors was very similar (Figure 8A and B), showing a slow onset, peak (∼0.10 nA) at 10–15 min, and a slow decrease below prestimulus baselines. The increases in electrochemical currents detected by glutamate- and glucose-null sensors during tail-pinch showed similar dynamics with increases in NAcc temperature directly recorded in a similar experiment in a separate group of animals (Figure 8C). These two parameters were tightly correlated for both types of sensors (glutamate-null, r = 0.920; glucose-null, 0.849; p < 0.001 for both cases), suggesting temperature as a major factor responsible for increases in electrochemical currents detected by enzyme-free null biosensors.
Figure 8.
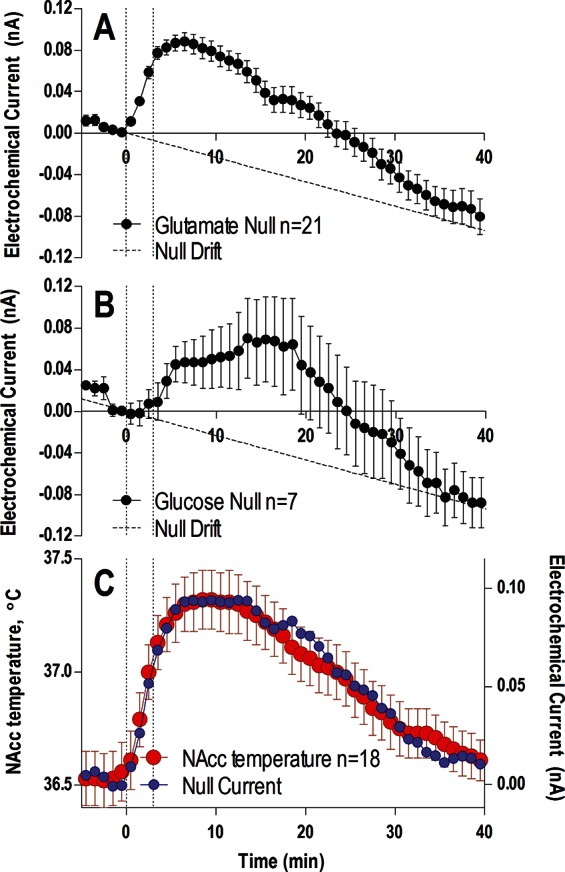
Changes in electrochemical currents (mean ± SEM) detected in the NAcc by glutamate-null (A) and glucose-null sensors (B) during a 3 min tail-pinch (vertical hatched lines). Diagonal hatched lines in both (A) and (B) represent the known drift in baseline calculated from Figure 4. For this analysis, data from shell and core recordings were combined (for glutamate-null sensors: n = 21 trials in 13 rats; for glucose-null sensors: n = 7 trials in 4 rats). Panel (C) shows the associated change in NAcc temperature (mean ± SEM, red) during the same tail-pinch protocol conducted in a separate experiment (18 tests in 12 rats), and compares it to the mean of all null currents from (A) and (B) (blue). For clarity, the null currents in (C) are corrected for the known drift in baseline and are shown without error bars.
Although a high correlation between two dynamic parameters recorded from the same brain area could suggest their interdependence, causality cannot be directly inferred. On one hand, changes in brain temperature could directly affect the sensors, increasing the observed electrochemical current. The importance of this direct influence is supported by our in vitro tests, which revealed an ∼0.08 nA increase in electrochemical current with each 0.5 °C temperature increase. Taking into account a ∼0.1 nA current increase detected during tail-pinch by both glutamate- and glucose-null sensors, a direct increase in NAcc temperature appears to be the major factor. If the sensors are temperature-dependent in vitro, why should they lose their temperature sensitivity in vivo? On the other hand, the relationships between nonspecific currents and temperature could be in part indirect, reflecting the increase in several metabolism-related electroactive substances (i.e., urate, DOPAC, ascorbate, etc.), which could likewise correlate with temperature increases.
It is important to emphasize that a brain temperature increase is a reflection of metabolic brain activation, which should induce multiple neurochemical changes. Both glutamate and glucose sensors, as well as their null analogues, are not only equally temperature sensitive but are also sensitive to other substances that are oxidized at working potentials (+0.6 V) used to detect either glutamate or glucose. While this neurochemical component could be effectively eliminated by the subtraction of currents generated by null sensors, a certain component of current changes detected by these null sensors should reflect neurochemical changes. While it is difficult to speculate on the nature of these substances, DOPAC, ascorbate, and urate could be possible candidates. All these substances are contained in the extracellular space at relatively high concentrations [2–20 μM for DOPAC, urate and ascorbate,123,124 with some electrochemical determinations of ascorbate ranging up to 300–400 μM125], their levels should increase tonically during metabolic neural activation, and their oxidation could contribute to electrochemical currents despite relatively small percent contributions to the overall current change. However, this chemical contribution appears to be much less than the direct temperature contribution.
4. Conclusions
The basic premise of any type of electrochemical sensor is that it should detect fluctuations in the concentration of a substance of interest and to be insensitive to all other nonspecific influences. While this goal could be approached by the creation of highly sensitive and selective sensors, there are natural limitations to this approach when used in awake, behaving animals. As shown in this Review, the performance of a neurochemical sensor is affected by temperature, which influences both background currents and current changes produced by the enzymatic oxidation of the substance of interest. The latter influence can be minimized by calibrating sensors at 37 °C, thus decreasing errors resulting from the calculation of concentration values from current change. It is more difficult, however, to exclude the contribution of temperature to changes in electrochemical currents because brain temperature also fluctuates robustly under physiological conditions and is affected by different neuroactive drugs (see ref (126) for review). If this is not given due consideration, regardless of the sensor’s chemical sensitivity and selectivity, current changes detected under certain conditions could be erroneously attributed to increases or decreases in the extracellular levels of the substance of interest. To combat this issue, the use of substrate-null sensors appears to be a valuable approach to exclude most nonspecific chemical and physical confounds. Importantly, this strategy appears to be more critical for measuring extracellular glutamate than glucose, because while both types of null sensors produce very similar nonspecific current changes, their contribution is much greater for glutamate because its concentration is much lower than that of glucose. Using this approach, we were able to reveal weaker yet more phasic changes in NAcc extracellular glutamate levels, which better correlated with stimulus-induced phasic excitation of accumbal cells.
While control recordings with substrate-null sensors could greatly improve the reliability of glutamate measurements in behavioral experiments, it should be noted that the results of these measurements also depend on the size of the enzyme-coated sensing area. Glutamate sensors with relatively large sensing areas such as those used here integrate multiple local concentrations, providing a measure of extracellular glutamate changes averaged over a larger brain area. These larger sensors lack the spatial resolution needed to accurately capture glutamate release related to synaptic activity, which is much faster, much more local, and can be studied by other techniques. The glutamate values estimated in our study are well within the range of presumed extracellular concentrations detected by microdialysis, and would be sufficient to affect high-affinity extrasynaptic glutamate receptors in both neural and glial cells. Therefore, it is important to consider extracellular glutamate fluctuations as a complex interplay between neural and glial processes, as well as synaptic and nonsynaptic sources of release and uptake. Although larger sensing devices conceivably blunt the measured dynamics of glutamate, possibly decreasing its peak amplitudes, high-resolution data analysis reveals a rapid, second-scale fluctuation in extracellular glutamate that correlates with neuronal activity. Therefore, while some care should be taken to adequately ensure the reliability of measurements in question, enzyme-based sensors appear to be valuable tools for evaluating rapid changes in neurochemical processes under physiologically relevant conditions.
Author Contributions
K.T.W.: primarily responsible for glutamate experiments, writing the manuscript; M.L.: primarily responsible for glucose experiments, writing the manuscript; E.A.K.: participation in experiments, primarily responsible for writing the manuscript.
Supported by the National Institute on Drug Abuse - Intramural Research Program, NIH.
The authors declare no competing financial interest.
Funding Statement
National Institutes of Health, United States
References
- Stamford J. A.; Kruk Z. L.; Millar J.; Wightman R. M. (1984) Striatal dopamine uptake in the rat: in vivo analysis by fast cyclic voltammetry. Neurosci. Lett. 28, 133–138. [DOI] [PubMed] [Google Scholar]
- Garris P. A.; Kilpatrick M.; Bunin M. A.; Michael D.; Walker Q. D.; Wightman R. M. (1999) Dissociation of dopamine release in the nucleus accumbens from intracranial self-stimulation. Nature 398, 67–69. [DOI] [PubMed] [Google Scholar]
- Phillips P. E.; Stuber G. D.; Heien M. L.; Wightman R. M.; Carelli R. M. (2003) Subsecond dopamine release promotes cocaine seeking. Nature 422, 614–618. [DOI] [PubMed] [Google Scholar]
- Heien M. L.; Johnson M. A.; Wightman R. M. (2004) Resolving neurotransmitters detected by fast-cyclic voltammetry. Anal. Chem. 76, 5697–5704. [DOI] [PubMed] [Google Scholar]
- Robinson D. L., and Wightman R. M. (2007) Rapid dopamine release in freely moving rats. In Electrochemical Methods in Neuroscience (Michael A. C., Borland L. M., Eds.), pp 17–34, CRC Press, Boca Raton, FL. [PubMed] [Google Scholar]
- Howard C. D.; Keefe K. A.; Garris P. A.; Deberkow D. P. (2011) Methamphetamine neurotoxicity decreases phasic, but not tonic, dopaminergic signaling in the rat striatum. J. Neurochem. 118, 668–676. [DOI] [PMC free article] [PubMed] [Google Scholar]
- Deberkow D. P.; Brown H. D.; Bunner K. D.; Kratiotis S. A.; Doellman M. A.; Rigozzino M. E.; Garris P. A.; Roithman M. F. (2013) Amphetamine paradoxically augments exocytic dopamine release and Phasic dopamine signals. J. Neurosci. 33, 452–463. [DOI] [PMC free article] [PubMed] [Google Scholar]
- Kiyatkin E. A. (2010) The brain’s temperature homeostasis: physiological fluctuations and pathological shifts. Front. Biol. Sci. 15, 73–92. [DOI] [PMC free article] [PubMed] [Google Scholar]
- Schmidt-Nielsen K. (1997) Animal Physiology. Adaptation and Environment, 5th ed., Cambridge University Press, Cambridge. [Google Scholar]
- Siesjo B. (1978) Brain Energy Metabolism, Wiley, New York. [Google Scholar]
- Hodgkin A. L. (1967) The Conduction of the Nervous Impulse, Liverpool University Press, Liverpool. [Google Scholar]
- Ritchie J. M. (1973) Energetic aspects of nerve conduction: The relationships between heat production, electrical activity and metabolism. Prog. Biophys. Mol. Biol. 26, 147–87. [DOI] [PubMed] [Google Scholar]
- Sokoloff L. (1999) Energetics of functional activation in neural tissues. Neurochem. Res. 24, 321–329. [DOI] [PubMed] [Google Scholar]
- Karbowski J. (2009) Thermodynamic constraints on neural dimensions, firing rates, brain temperature and size. J. Comput. Neurosci. 27, 415–436. [DOI] [PubMed] [Google Scholar]
- Yu Y.; Hill A. P.; McCormick D. A. (2012) Warm body temperature facilitates energy efficient cortical action potentials. PLoS Comput. Biol. 8, e1002456. [DOI] [PMC free article] [PubMed] [Google Scholar]
- Phillis G. (1993) The Regulation of Cerebral Blood Flow, CRC Press, Boca Raton, FL. [Google Scholar]
- Delgado J. M. R.; Hanai T. (1966) Intracerebral temperatures in free-moving cats. Am. J. Physiol. 211, 755–769. [DOI] [PubMed] [Google Scholar]
- Feitelberg S.; Lampl H. (1935) Warmetonung der Grosshirnrinde bei Erregung und Ruhe. Functionshemmung. Arch. Exp. Path. Pharmakol. 177, 726–736(in German). [Google Scholar]
- Hayward J. N.; Baker M. A. (1968) Role of cerebral blood flow in the regulation of brain temperature In the monkey. Am. J. Physiol. 215, 389–403. [DOI] [PubMed] [Google Scholar]
- Kiyatkin E. A.; Brown P. L.; Wise R. A. (2002) Brain temperature fluctuation: a reflection of functional neural activation. Eur. J. Neurosci. 16, 164–168. [DOI] [PubMed] [Google Scholar]
- McElligott J. C.; Melzack R. (1967) Localized thermal changes evoked in the brain by visual and auditory stimulation. Exp. Neurol. 17, 293–312. [DOI] [PubMed] [Google Scholar]
- Nybo L.; Secher N. H.; Nielson B. (2002) Inadequate heat release from the human brain during prolonged exercise with hyperthermia. J. Physiol. 545, 697–704. [DOI] [PMC free article] [PubMed] [Google Scholar]
- Serota H. M.; Gerard R. M. (1938) Localized thermal changes in cat’s brain. J. Neurophysiol. 1, 115–124. [Google Scholar]
- Abrams R.; Hammel H. T. (1964) Hypothalamic temperature in unanesthetized albino rats during feeding and sleeping. Am. J. Physiol. 206, 641–646. [DOI] [PubMed] [Google Scholar]
- Baker M. A.; Frye F. M.; Millet V. E. (1973) Origin of temperature changes evoked in the brain by sensory stimulation. Exp. Neurol. 38, 502–519. [DOI] [PubMed] [Google Scholar]
- Sundgren-Andersson A. K.; Ostlund P.; Bartfai T. (1998) Simultaneous measurement of brain and core temperature in the rat during fever, hyperthermia, hypothermia and sleep. Neuroimmunomodulation 5, 241–247. [DOI] [PubMed] [Google Scholar]
- Kiyatkin E. A. (2005) Brain hyperthermia as physiological and pathological phenomena. Brain Res. Rev. 50, 27–56. [DOI] [PubMed] [Google Scholar]
- Marcangione C.; Constantin A.; Clarke P. B. S. (2010) Lack of effect of dopaminergic denervation on caudate-putamen hyperthermia or hypothermia induced by drugs and mild stressors. Pharmacol., Biochem. Behav. 96, 32–39. [DOI] [PubMed] [Google Scholar]
- Smirnov M. S.; Kiyatkin E. A. (2008) Fluctuations in central and peripheral temperatures associated with feeding behavior in rats. Am. J. Physiol. 295, R1414–R1424. [DOI] [PMC free article] [PubMed] [Google Scholar]
- Kiyatkin E. A.; Mitchum R. (2003) Fluctuations in brain temperatures during sexual behavior in male rats: An approach for evaluating neural activity underlying motivated behavior. Neuroscience 119, 1169–1183. [DOI] [PubMed] [Google Scholar]
- Kiyatkin E. A.; Brown P. L. (2005) Brain and body temperature homeostasis during sodium pentobarbital anesthesia with and without body warming in rats. Physiol. Behav. 84, 563–570. [DOI] [PubMed] [Google Scholar]
- Grant R. J.; Clarke P. B. S. (2002) Subceptibility of ascending dopamine projections to 6-hydroxydopamine in rats: effect of hypothermia. Neuroscience 115, 1281–1294. [DOI] [PubMed] [Google Scholar]
- Erickson K. M.; Lanier W. L. (2003) Anesthetic technique influences brain temperature, independently of core temperature, during craniotomy in cats. Anesth. Analg. 96, 1460–1466. [DOI] [PubMed] [Google Scholar]
- Brown P. L.; Wise R. A.; Kiyatkin E. A. (2003) Brain hyperthermia is induced by methamphetamine and exacerbated by social interaction. J. Neurosci. 23, 3924–3929. [DOI] [PMC free article] [PubMed] [Google Scholar]
- Brown P. L.; Kiyatkin E. A. (2004) Brain hyperthermia induced by MDMA (“ecstasy”): modulation by environmental conditions. Eur. J. Neurosci. 20, 51–58. [DOI] [PubMed] [Google Scholar]
- Kiyatkin E. A.; Brown P. L. (2003) Fluctuations in neural activity during cocaine self-administration: clues provided by brain thermorecording. Neuroscience 116, 525–538. [DOI] [PubMed] [Google Scholar]
- Kiyatkin E. A.; Wise R. A. (2002) Brain and body hyperthermia associated with heroin self-administration in rats. J. Neurosci. 22, 1072–1080. [DOI] [PMC free article] [PubMed] [Google Scholar]
- Tang J. S.; Kiyatkin E. A. (2011) Fluctuations in brain temperatures induced by lypopolysaccharides: Central and peripheral contributions. Oxid. Med. Cell. Longevity 3, 332–341. [DOI] [PMC free article] [PubMed] [Google Scholar]
- Serota H. M. (1939) Temperature changes in the cortex and hypothalamus during sleep. J. Neurophysiol. 2, 42–47. [Google Scholar]
- Horvath T. L.; Warden C. H.; Hajos M.; Lombardi A.; Goglia F.; Diano S. (1999) Brain uncoupling protein 2: Uncoupled neuronal mitochondria predict thermal synapses in homeostatic centers. J. Neurosci. 19, 10417–10427. [DOI] [PMC free article] [PubMed] [Google Scholar]
- Mellergard P.; Nordstrom C. H. (1990) Epidural temperatures and possible intracerebral temperature gradients in man. Br. J. Neurosurg. 4, 31–38. [DOI] [PubMed] [Google Scholar]
- Rumana C. S.; Gopinath S. P.; Uzura M.; Valadka A. B.; Robertson C. S. (1998) Brain temperatures exceed systemic temperatures in head-injured patients. Clin. Care Med. 26, 562–567. [DOI] [PubMed] [Google Scholar]
- Schwab S.; Spranger M.; Aschoff A.; Steiner T.; Hacke W. (1997) Brain temperature monitoring and modulation in patients with severe MCA infarction. Neurology 48, 762–767. [DOI] [PubMed] [Google Scholar]
- Zhu M.; Nehra D.; Ackerman J. H.; Yablonskiy D. A. (2004) On the role of anesthesia on the body/brain temperature differential in rats. J. Thermal Biol. 29, 599–603. [Google Scholar]
- Swan H. (1974) Thermoregulation and Bioenergetics, Elsevier, New York. [Google Scholar]
- Lee J. C. F.; Callaway J. C.; Foehring R. C. (2005) Effects of temperature on calcium transients and Ca2+-dependent afterhyperpolarizations in neocortical pyramidal neurons. J. Neurophysiol. 93, 2012–20. [DOI] [PubMed] [Google Scholar]
- Thompson K. W.; Wasterlain C. G. (2001) Urethane anesthesia produces selective damage in the piriform cortex of the developing brain. Dev. Brain Res. 130, 167–171. [DOI] [PubMed] [Google Scholar]
- Tryba A. K.; Ramirez J.-M. (2004) Hyperthermia modulates respiratory pacemaker bursting properties. J. Neurophysiol. 92, 2844–2852. [DOI] [PubMed] [Google Scholar]
- Volgushev M.; Vidyasagar T. R.; Chistiakova M.; Yousef T.; Eysel U. T. (2000) Membrane properties and spike generation in rat visual cortical cells during reversible cooling. J. Physiol. 522, 59–76. [DOI] [PMC free article] [PubMed] [Google Scholar]
- Kim J. A., and Connors B. W. (2012) High temperature alters physiological properties of pyramidal cells and inhibitory interneurons in hippocampus. Front. Cell. Neurosci. 4, doi: 10.3389/fncel.2012.00027. [DOI] [PMC free article] [PubMed] [Google Scholar]
- Katz B.; Miledi R. (1965) The effect of temperature on the synaptic delay at the neuromuscular junction. J. Physiol. 181, 656–670. [DOI] [PMC free article] [PubMed] [Google Scholar]
- Berner N. J.; Heller H. C. (1998) Does the preoptic anterior hypothalamus receive thermoafferent information?. Am. J. Physiol. 274, R9–R18. [DOI] [PubMed] [Google Scholar]
- Boulant J. A. (2000) Role of the preoptic anterior hypothalamus in thermoregulation and fever. Clin. Infect. Dis. 31(Suppl. 5), S157–S161. [DOI] [PubMed] [Google Scholar]
- Nadel E. (2003) Regulation of body temperature. In Medical Physiology (Boron W. F., and Boulpaep E. L., Eds.), pp 1231–1241, Saunders, Philadelphia. [Google Scholar]
- Travis K. A.; Bockholt H. J.; Zardetto-Smith A. M.; Johnson A. K. (1995) In vitro thermosensitivity of the midline thalamus. Brain Res. 686, 17–22. [DOI] [PubMed] [Google Scholar]
- Burgoon P. W.; Boulant J. A. (2001) Temperature-sensitive properties of rat suprachiasmatic nucleus neurons. Am. J. Physiol. 281, R706–R715. [DOI] [PubMed] [Google Scholar]
- Ruby N. F.; Heller H. C. (1996) Temperature sensitivity of the suprachiasmatic nucleus of ground squirrels and rats in vitro. J. Biol. Rhythms 11, 126–136. [DOI] [PubMed] [Google Scholar]
- Guatteo E.; Chung K. K.; Bowala T. K.; Bernardi G.; Mercuri N. B.; Lipski J. (2005) Temperature sensitivity of dopaminergic neurons of the substantia nigra pars compacta: involvement of TRP channels. J. Neurophysiol. 94, 3069–3080. [DOI] [PubMed] [Google Scholar]
- Kiyatkin E. A. (2002) Dopamine in the nucleus accumbens: cellular actions, drug- and behavior-associated fluctuations, and a possible role in an organism’s adaptive activity. Behav. Brain Res. 137, 27–46. [DOI] [PubMed] [Google Scholar]
- Nakashima K.; Todd M. M. (1996) Effects of hypothermia on the rate of excitatory amino acid release after ischemic depolarization. Stroke 27, 913–918. [DOI] [PubMed] [Google Scholar]
- Vizi E. S. (1998) Different temperature dependence of carrier-mediated (cytoplasmic) and stimulus-evoked (exocytotic) release of transmitter: a simple method to separate the two types of release. Neurochem. Int. 33, 359–356. [DOI] [PubMed] [Google Scholar]
- Xie T.; McGann U. D.; Kim S.; Yuan J.; Ricaurte G. A. (2000) Effect of temperature on dopamine transporter function and intracellular accumulation of methamphetamine: Implications for methamphetamine-induced dopaminergic neurotoxicity. J. Neurosci. 20, 7838–7845. [DOI] [PMC free article] [PubMed] [Google Scholar]
- Krnjevic K. (1970) Glutamate and gamma-aminobutyric acid in brain. Nature 228, 119–124. [DOI] [PubMed] [Google Scholar]
- Moult P. R. (2009) Neuronal glutamate and GABA-A receptor function in health and disease. Biochem. Soc. Trans. 37, 1317–1322. [DOI] [PubMed] [Google Scholar]
- Clements J. D.; Lester R. A.; Tong G.; Jahr C. E.; Westbrook G. L. (1992) The time-course of glutamate in the synaptic cleft. Science 258, 1498–1501. [DOI] [PubMed] [Google Scholar]
- Scimemi A.; Tian H.; Diamond J. S. (2009) Neuronal transporters regulate glutamate clearance, NMDA receptor activation, and synaptic plasticity in the hippocampus. J. Neurosci. 29, 14581–14595. [DOI] [PMC free article] [PubMed] [Google Scholar]
- Vizi E. A.; Fekete A.; Karoly R.; Mike A. (2010) Non-synaptic receptors and transporters involved in brain functions and targets of drug treatment. Br. J. Pharmacol. 160, 785–809. [DOI] [PMC free article] [PubMed] [Google Scholar]
- Van der Zeyden M.; Oldenziel W. H.; Rea K.; Cremers T. I.; Westerink B. H. (2008) Microdialysis of GABA and glutamate: analysis, interpretation and comparison with microsensors. Pharmacol., Biochem. Behav. 90, 135–147. [DOI] [PubMed] [Google Scholar]
- Tossman U.; Jonsson G.; Ungerstedt U. (1986) Regional distribution and extracellular levels of amino acids in rat central nervous system. Acta Physiol. Scand. 127, 533–545. [DOI] [PubMed] [Google Scholar]
- You Z. B.; Chen Y. Q.; Wise R. A. (2001) Dopamine and glutamate release in the nucleus accumbens and ventral tegmental area of rat following lateral hypothalamic self-stimulation. Neuroscience 107, 629–639. [DOI] [PubMed] [Google Scholar]
- Perry M.; Li Q.; Kennedy R. T. (2009) Review of recent advances in analytical techniques for the determination of neurotransmitters. Anal. Chim. Acta 653, 1–22. [DOI] [PMC free article] [PubMed] [Google Scholar]
- Cooper J. M.; Pritchard D. J. (1994) Biomolecular sensors for neurotransmitter determination: electrochemical immobilization of glutamate oxidase at microelectrodes in a poly(o-phenylenediamine) film. J. Mater. Sci.: Mater. Electron 5, 111–116. [Google Scholar]
- Hu Y.; Mitchell K. M.; Albahadily F. N.; Michaelis E. K.; Wilson G. S. (1994) Direct measurement of glutamate release in the brain using a dual enzyme-based electrochemical sensor. Brain Res. 659, 117–125. [DOI] [PubMed] [Google Scholar]
- Wilson G. S.; Gifford R. (2005) Biosensors for real-time in vivo measurements. Biosens. Bioelectron. 20, 2388–2403. [DOI] [PubMed] [Google Scholar]
- Oldenziel W. H.; Dijkstra G.; Cremers T. I.; Westerink B. H. (2006) In vivo monitoring of extracellular glutamate in the brain with a microsensor. Brain Res. 1118, 34–42. [DOI] [PubMed] [Google Scholar]
- Hascup E. R.; Hascup K. N.; Stephens M.; Pomerleau F.; Huettl P.; Gratton A.; Gerhardt G. A. (2010) Rapid microelectrode measurements and the origin and regulation of extracellular glutamate in rat prefrontal cortex. J. Neurochem. 115, 1608–1620. [DOI] [PMC free article] [PubMed] [Google Scholar]
- Agnesi F.; Blaha C. D.; Lin J.; Lee K. H. (2010) Local glutamate release in the rat ventral lateral thalamus evoked by high-frequency stimulation. J. Neural Eng. 7, 26–29. [DOI] [PMC free article] [PubMed] [Google Scholar]
- Rutherford E. C.; Pomerleau F.; Huettl P.; Stromberg I.; Gerhardt G. A. (2007) Chronic second-by-second measures of L-glutamate in the central nervous system of freely moving rats. J. Neurochem. 102, 712–722. [DOI] [PMC free article] [PubMed] [Google Scholar]
- Wassum K. M.; Tolosa V. M.; Tseng T. C.; Balleine B. W.; Monbouquette H. G.; Maidment N. T. (2012) Transient extracellular glutamate events in the basolateral amygdala track reward-seeking actions. J. Neurosci. 32, 2734–2746. [DOI] [PMC free article] [PubMed] [Google Scholar]
- John J.; Ramanathan L.; Siegel J. M. (2008) Rapid changes in glutamate levels in the posterior hypothalamus across sleep-wake states in freely behaving rats. Am. J. Physiol.: Regul., Integr. Comp. Physiol. 295, R2041–R2049. [DOI] [PMC free article] [PubMed] [Google Scholar]
- Dash M. B.; Douglas C. L.; Vyazovskiy V. V.; Cirelli C.; Tononi G. (2009) Long-term homeostasis of extracellular glutamate in the rat cerebral cortex across sleep and waking states. J. Neurosci. 29, 620–629. [DOI] [PMC free article] [PubMed] [Google Scholar]
- Naylor E.; Aillon D. V.; Gabbert S.; Harmon H.; Johnson D. A.; Wilson G. S.; Petillo P. A. (2011) Simultaneous real-time measurement of EEG/EMG and L-glutamate in mice: A biosensor study of neuronal activity during sleep. J. Electroanal. Chem. 656, 106–113. [DOI] [PMC free article] [PubMed] [Google Scholar]
- Fox P. T.; Raichle M. E. (1986) Focal physiological uncoupling of cerebral blood flow and oxidative metabolism during somatosensory stimulation in human subjects. Proc. Natl. Acad. Sci. U.S.A. 83, 1140–1144. [DOI] [PMC free article] [PubMed] [Google Scholar]
- Sokoloff L.; Reivich M.; Kennedy C.; Des Rosiers M. H.; Patlak C. S.; Pettigrew K. D.; Sakurada O.; Shinohara M. (1977) The [14C]deoxyglucose method for the measurement of local cerebral glucose utilization: theory, procedure, and normal values in the conscious and anesthetized albino rat. J. Neurochem. 28, 897–916. [DOI] [PubMed] [Google Scholar]
- Grubb R. L.; Raichle M. E.; Eichling J. O.; Ter-Pogossian M. M. (1974) The effects of changes in PaCO2 on cerebral blood volume, blood flow, and vascular mean transit time. Stroke 5, 630–639. [DOI] [PubMed] [Google Scholar]
- Hamadate N.; Yamaguchi T.; Sugawara A.; Tsujimatsu A.; Izumi T.; Yoshida T.; Ohmura Y.; Yoshioka M. (2011) Regulation of cerebral blood flow in the hippocampus by neuronal activation through the perforant path: Relationship between hippocampal blood flow and neuronal plasticity. Brain Res. 1415, 1–7. [DOI] [PubMed] [Google Scholar]
- Hoge R. D.; Franceschini M. A.; Covolan R. J.; Huppert T.; Mandeville J. B.; Boas D. A. (2005) Simultaneous recording of task-induced changes in blood oxygenation, volume, and flow using diffuse optical imaging and arterial spin-labeling MRI. NeuroImage 25, 701–707. [DOI] [PubMed] [Google Scholar]
- Kong Y.; Zheng Y.; Johnston D.; Martindale J.; Jones M.; Billing S.; Mayhew J. (2004) A model of the dynamic relationship between blood flow and volume changes during brain activation. J. Cereb. Blood Flow Metab. 1382–92. [DOI] [PubMed] [Google Scholar]
- Martin C.; Martindale J.; Berwick J.; Mayhew J. (2006) Investigating neural-hemodynamic coupling and the hemodynamic response function in the awake rat. Neuroimage 32, 33–48. [DOI] [PubMed] [Google Scholar]
- Paulson O. B.; Hasselbalch S. G.; Rostrup E.; Knudsen G. M.; Pelligrino D. (2010) Cerebral blood flow response to functional activation. J. Cereb. Blood Flow Metab. 2–14. [DOI] [PMC free article] [PubMed] [Google Scholar]
- Fellows L. K.; Boutelle M. G. (1993) Rapid changes in extracellular glucose levels and blood flow in the striatum of the freely moving rat. Brain Res. 604, 225–231. [DOI] [PubMed] [Google Scholar]
- Silver I. A.; Erecinska M. (1994) Extracellular glucose concentration in mammalian brain: continuous monitoring of changes during increased neuronal activity and upon limitation in oxygen supply in normo- hypo- and hyperglycemic animals. J. Neurosci. 14, 5068–5076. [DOI] [PMC free article] [PubMed] [Google Scholar]
- De Vries M. G.; Arseneau L. M.; Lawson M. E.; Beverly J. L. (2003) Extracellular glucose in rat ventromedial hypothalamus during acute and recurrent hypoglycemia. Diabetes 52, 2767–2773. [DOI] [PubMed] [Google Scholar]
- Fellows L. K.; Boutelle M. G.; Fillenz M. (1993) Physiological stimulation increases nonoxidative glucose metabolism in the brain of the freely moving rat. J. Neurochem. 60, 1258–1263. [DOI] [PubMed] [Google Scholar]
- Osborne P. G.; Niwa O.; Kato T.; Yamamoto K. (1997) On-line, continuous measurement of extracellular striatal glucose using microdialysis sampling and electrochemical detection. J. Neurosci. Meth. 77, 143–150. [DOI] [PubMed] [Google Scholar]
- Lowry J. P.; O’Neill R. D.; Boutelle M. G.; Fillenz M. (1998) Continuous monitoring of extracellular glucose concentrations in the striatum of freely moving rats with an implanted glucose biosensor. J. Neurochem. 70, 391–396. [DOI] [PubMed] [Google Scholar]
- Lowry J. P.; Fillenz M. (1997) Evidence for uncoupling of oxygen and glucose utilization during neuronal activation in rat striatum. J. Physiol. 498, 497–501. [DOI] [PMC free article] [PubMed] [Google Scholar]
- Newman L. A.; Korol D. L.; Gold P. E. (2011) Lactate produced by glycogenolysis in astrocytes regulates memory processing. PlosOne 6, e28427. [DOI] [PMC free article] [PubMed] [Google Scholar]
- Devor A.; Sakadzic S.; Saisan P. A.; Yaseen M. A.; Roussakis E.; Srinivasan V. J.; Vinogradov S. A.; Rosen B. R.; Buxton R. B.; Dale A. M.; Boas D. A. (2011) “Overshoot” of O2 is required to maintain baseline tissue oxygenation at locations distal to blood vessels. J. Neurosci. 31, 13676–13681. [DOI] [PMC free article] [PubMed] [Google Scholar]
- Hirano Y.; Stefanovic B.; Silva A. C. (2011) Spatiotemporal evolution of the functional magnetic resonance imaging response to ultra-short stimuli. J. Neurosci. 31, 1440–1447. [DOI] [PMC free article] [PubMed] [Google Scholar]
- Hu Y.; Wilson G. S. (1997) Rapid changes in local extracellular rat brain glucose observed with an in vivo glucose sensor. J. Neurochem. 68, 1745–1752. [DOI] [PubMed] [Google Scholar]
- Wakabayashi K.; Kiyatkin E. A. (2012) Rapid changes in extracellular glutamate induced by natural arousing stimuli and intravenous cocaine in the nucleus accumbens shell and core. J. Neurophysiol. 108, 285–299. [DOI] [PMC free article] [PubMed] [Google Scholar]
- Kiyatkin E. A.; Lenoir M. (2012) Rapid fluctuations in extracellular brain glucose levels induced by natural arousing stimuli and intravenous cocaine: Fueling the brain during neural activation. J. Neurophysiol. 108, 1669–1684. [DOI] [PMC free article] [PubMed] [Google Scholar]
- Barbour B.; Keller B. U.; Llano I.; Marty A. (1994) Prolonged presence of glutamate during excitatory synaptic transmission to cerebellar Purkinje cells. Neuron 12, 1331–1343. [DOI] [PubMed] [Google Scholar]
- Dunn-Meynell A. A.; Sanders N. M.; Compton D.; Becker T. C.; Eiki J.; Zhang B. B.; Levin B. E. (2009) Relationship among brain and blood glucose levels and spontaneous and glucoprivic feeding. J. Neurosci. 29, 7015–7022. [DOI] [PMC free article] [PubMed] [Google Scholar]
- Fellows L. K.; Boutelle M. G.; Fillenz M. (1992) Extracellular brain glucose levels reflect local neuronal activity: a microdialysis study in awake, freely moving rats. J. Neurochem. 59, 2141–2147. [DOI] [PubMed] [Google Scholar]
- McNay E. C.; McCarty R. C.; Gold P. E. (2001) Fluctuations in brain glucose concentration during behavioral testing: dissociations between brain areas and between brain and blood. Neurobiol. Learn. Mem. 75, 325–337. [DOI] [PubMed] [Google Scholar]
- Miele M.; Boutellew M. G.; Fillenz M. (1996) The sourse of physiologically stimulated glutamate efflux from the striatum of conscious rats. J. Physiol. 497, 745–751. [DOI] [PMC free article] [PubMed] [Google Scholar]
- Nyitrai G.; Kekesi K. A.; Juhasz G. (2006) Extracellular level of GABA and Glu: In vivo microdialysis-HPLC measurements. Curr. Top. Med. Chem. 6, 935–940. [DOI] [PubMed] [Google Scholar]
- Hershey N. D.; Kennedy R. T. (2013) In vivo calibration of microdialysis using infusion of stable-isotope labeled neurotransmitters. ASC Chem. Neurosci. 10.1021/cn300199m. [DOI] [PMC free article] [PubMed] [Google Scholar]
- Zhang H. Y.; Shi H. Y.; Wang E. Y. (2009) Effect of environmental temperature on the recovery of microdialysis probe for monoamine neurotransmitter. Zhejiang Da Xue Xue Bao Yi Xue Ban 38, 271–275. [DOI] [PubMed] [Google Scholar]
- Herman M. A.; Nahir B.; Jahr C. E. (2011) Distribution of extracellular glutamate in the neuropil of hippocampus. Plos One 6, e26501. [DOI] [PMC free article] [PubMed] [Google Scholar]
- Day B. K.; Pomerleau F.; Burmeister J. J.; Huettl P.; Gerhardt G. A. (2006) Microelectrode array studies of basal and potassium-evoked release of l-glutamate in the anesthetized rat brain. J. Neurochem. 96, 1625–1635. [DOI] [PubMed] [Google Scholar]
- Rahman A.; Kwon N. H.; Won M. S.; Choe E. S.; Shim Y. B. (2005) Functionalized conducting polymer as an enzyme-immobilizing substrate: an amperometric glutamate microsensor for in vivo measurement. Anal. Chem. 77, 4854–4860. [DOI] [PubMed] [Google Scholar]
- Kulagina N. V.; Shankar L.; Michael A. C. (1999) Monitoring glutamate and ascorbate in the extracellular space of brain tissue with electrochemical microsensors. Anal. Chem. 71, 5093–5100. [DOI] [PubMed] [Google Scholar]
- Quintero J. E.; Pomerleau F.; Huettl P.; Johnson K. W.; Offord J.; Gergardt G. A. (2011) Methodology for rapid measurements of glutamate release in rat brain slices using ceramic-based microelectrode arrays: basic characterization and drug pharmacology. Brain Res. 1401, 1–9. [DOI] [PMC free article] [PubMed] [Google Scholar]
- Onifer S. M.; Quintero J. E.; Gerhardt G. A. (2012) Cutaneous and electrically evoked glutamate signaling in the adult rat somatosensory system. J. Neurosci. Methods 208, 146–154. [DOI] [PubMed] [Google Scholar]
- Mattinson C. E.; Burmeister J. J.; Quintero J. E.; Pomerleau F.; Huettl P.; Gerhardt G. A. (2011) Tonic and phasic release of glutamate and acetylcholine neurotransmission in sub-regions of the rat prefrontal cortex using enzyme-based microelectrode arrays. J. Neurosci. Methods 202, 199–208. [DOI] [PMC free article] [PubMed] [Google Scholar]
- Benveniste H.; Drejer J.; Schoesboe A.; Diemer N. H. (1984) Elevation of the extracellular concentrations of glutamate and aspartate in rat hippocampus during transient cerebral ischemia monitored by intracerebral microdialysis. J. Neurochem. 43, 1369–1374. [DOI] [PubMed] [Google Scholar]
- Paschen W. (1996) Glutamate excitotoxicity in transient global cerebral ischemia. Acta Neurobiol. Exp. 56, 313–322. [DOI] [PubMed] [Google Scholar]
- Le Meur K.; Galante M.; Angulo M. C.; Audinat E. (2007) Tonic activation of NMDA receptors by ambient glutamate of non-synaptic origin in the rat hippocampus. J. Physiol. 580, 373–383. [DOI] [PMC free article] [PubMed] [Google Scholar]
- Kiyatkin E. A.; Brown P. L. (2007) I.v. cocaine induces rapid, transient excitation of striatal neurons via its action on peripheral neural elements: single-cell, iontophoretic study in awake and anesthetized rats. Neuroscience 148, 978–996. [DOI] [PMC free article] [PubMed] [Google Scholar]
- Zetterstrom T.; Sharp T.; Marsden C. A.; Ungerstedt U. (1983) In vivo measurements of dopamine and its metabolites by intracerebral dialysis: Changes after d-amphetamine. J. Neurochem. 41, 1769–1773. [DOI] [PubMed] [Google Scholar]
- Miele M.; Mura M. A.; Enrici P.; Esposito G.; Serra P. A.; Migneli R.; Zangani D.; Miele E.; Desole M. S. (2000) On the mechanism of d-amphetamine induced changes in glutamate, ascorbic acid and uric acid in the striatum of freely moving rats. Br. J. Pharmacol. 129, 582–588. [DOI] [PMC free article] [PubMed] [Google Scholar]
- Rebec G. V. (2007) From interferant anion to neuromodulator: ascorbate oxidizes its way to respectability. In Electrochemical Methods in Neuroscience (Michael A. C., and Borland L. M., Eds.), pp 149–165, CRC Press, Boca Raton, FL. [PubMed] [Google Scholar]
- Kiyatkin E. A. (2013) The hidden side of drug action: Brain temperature changes induced by neuroactive drugs. Psychopharmacology 225, 765–780. [DOI] [PMC free article] [PubMed] [Google Scholar]