Abstract
The use of critical-for-life organs (e.g., liver or lung) for systemic gene therapeutics can lead to serious safety concerns. To circumvent such issues, we have considered salivary glands (SGs) as an alternative gene therapeutics target tissue. Given the high secretory abilities of SGs, we hypothesized that administration of low doses of recombinant adeno-associated virus (AAV) vectors would allow for therapeutic levels of transgene-encoded secretory proteins in the bloodstream. We administered 109 particles of an AAV vector encoding human erythropoietin (hEPO) directly to individual mouse submandibular SGs. Serum hEPO reached maximum levels 8-12 weeks after gene delivery and remained relatively stable for 54 weeks (longest time studied). Hematocrit levels were similarly increased. Moreover, these effects proved to be vector dose-dependent, and even a dosage as low as 108 particles per animal led to significant increases in hEPO and hematocrit levels. Vector DNA was detected only within the targeted SGs, and levels of AAV copies within SGs were highly correlated with serum hEPO levels (r = 0.98). These results show that SGs appear to be promising targets with potential clinical applicability for systemic gene therapeutics.
Gene therapeutics, use of the gene as a drug, was initially proposed as a highly promising clinical application of gene transfer (1, 2). Currently, most therapeutic transgenes intended for correction of systemic single-protein deficiency disorders are delivered to either a major critical-for-life organ, e.g., liver or lung (3, 4), or a tissue not physiologically intended for secretion, e.g., muscle (5, 6). Both approaches, although useful, can be unsatisfactory, because they can require relatively high vector doses to achieve effective therapy (3-6). Furthermore, targeting a critical organ such as liver or lung can lead to serious safety concerns (7, 8). An ideal target tissue for gene therapeutics should be readily accessed, ensure safety, and lead to adequate as well as stable transgenic protein production.
The quest for a better gene therapeutics target tissue led us to consider an unusual candidate: the salivary glands (SGs). Human SGs consist of extremely active secretory cells, able to produce 0.75-1.5 liters of saliva daily, as well as to secrete considerable amounts of protein into both the gastrointestinal tract and bloodstream (9). Importantly, SGs are well encapsulated, not critical-for-life organs. Therefore, it seemed to us reasonable to try to take advantage of their potential utility for gene therapeutics.
Gene transfer to SGs is accomplished in a relatively noninvasive manner by intraoral cannulation of the main excretory ducts (10). In earlier experiments, we used recombinant serotype 5 adenoviral vectors for gene transfer and demonstrated successful vector administration and subsequent protein production and secretion of several therapeutic proteins, albeit for a limited time (e.g., refs. 11-13). Very recently, we demonstrated that adeno-associated virus (AAV) vectors can be used for gene transfer to SGs (14). In the present study, we use AAV vectors in SGs in an attempt to circumvent some important existing obstacles to successful gene therapeutics. Specifically, we evaluated the hypothesis that the administration of low doses of AAV vectors to SGs can lead to stable long-term secretion of a therapeutic protein into the bloodstream for systemic disease applications. Our experiments clearly demonstrate proof of this hypothesis and strongly support the notion that SGs may be valuable gene transfer targets for gene therapeutics with potential clinical significance.
Materials and Methods
Construction of AAVhEPO and AAVLacZ. Generation of AAV vectors was performed as described (14-16). Briefly, 293T cells were cotransfected with the trans plasmids pMMTV2.1 (provides the Rep and Cap genes), pAd12 (provides adenoviral helper genes), and the cis plasmid containing either the Escherichia coli β-galactosidase (LacZ) or human erythropoietin (hEPO) cDNA flanked by the AAV inverted terminal repeats (Fig. 1) at a ratio of 1:1:1 by calcium phosphate precipitation to generate the recombinant vector AAVLacZ or AAVhEPO, respectively. Transgene expression in both recombinant AAV vectors was driven by the Rous sarcoma virus (RSV) promoter. Y. Terada (Tokyo Medical and Dental University, Tokyo) generously provided the hEPO cDNA. The cells were harvested 48 h posttransfection and a crude viral lysate (CVL) obtained after three freeze-thaw cycles. The lysate was treated with benzonase (100 units/ml CVL; 37°C for 45 min), adjusted to a refractive index of 1.372 by addition of CsCl, and centrifuged (SW41 rotor) at 38,000 rpm for 65 h at 20°C. Equilibrium density gradients were fractionated, and fractions with a refractive index of 1.369-1.375 were collected and stored at 4°C and assayed for infectious activity. The number of AAV genomes was estimated by using quantitative real-time PCR (QPCR) (Applied Biosystems; see below). Immediately before experiments, viral fractions were dialyzed against 0.9% NaCl.
Fig. 1.
AAVhEPO construct. The vector AAVhEPO was constructed as described in Materials and Methods. Inverted terminal repeat (ITR), Rous sarcoma virus promoter (RSV), hEPO cDNA, and polyadenylation signal (Poly-A) are shown. Arrows indicate restriction enzyme sites: SmaI (red arrows) and BssH II (blue arrows). Black line at top indicates the probe used in the Southern hybridization blot (see Fig. 7). Red and blue lines connecting arrows indicate the DNA fragments observed in the Southern hybridization blot after digestion with the specific enzymes.
Mice, Gene Transfer, Saliva, and Serum Collections. Animal studies were approved by the National Institute of Dental and Craniofacial Research Animal Care and Use Committee and the National Institutes of Health Biosafety Committee. All procedures were conducted in accordance with International Association for the Study of Pain standards. Male BALB/c mice were obtained from the Division of Cancer Treatment, National Cancer Institute (Bethesda). Mice (four groups, n = 5 each) were administered 109 particles (suspended in 50 μl of 0.9% NaCl) of either AAVLacZ (n = 10) or AAVhEPO (n = 10) by retrograde ductal delivery to their submandibular SGs (10, 17). Two additional groups of BALB/c mice (n = 5 each) were also used for a vector dose-response evaluation and received 108 or 5 × 10⁹ AAVhEPO particles, respectively. An additional group (n = 5) of naïve mice (administered with 50 μl of 0.9% NaCl) was included. Mild anesthesia was induced with 1 μl/g of body weight of a 60 mg/ml ketamine (Phoenix Scientific, St. Joseph, MO) and 8 mg/ml xylazine (Phoenix Scientific) solution given intramuscularly. One cohort of mice, administered either AAVLacZ (n = 5) or AAVhEPO (n = 4; one animal died), and the naïve group (n = 4; one animal died) were killed 8 weeks after viral administration. Blood and tissue (submandibular glands, liver, spleen, and testis) samples were collected. The other mice (AAVLacZ and AAVhEPO, n = 5 each) were maintained throughout the experiment (up to 54 weeks). Blood samples were obtained by orbital bleeding. Whole saliva was collected as described (14) after stimulation of secretion using 0.5 mg of pilocarpine/kg body weight administered s.c. Hcts were determined by using microhematocrit capillary tubes (Fisher Scientific).
Quantification of hEPO. Secretion of hEPO in mouse serum and saliva was determined by an ELISA by using commercial assay kits (R & D Systems). The lower limit of detection was 0.6 milliunits/ml. Assays were performed according to the manufacturer's instructions.
QPCR. Genomic DNA was isolated from submandibular glands, liver, spleen, and testes of treated and untreated mice (week 8) by using the DNeasy isolation kit (Qiagen, Chatsworth, CA). QPCR amplification (20-μl final volume) of the DNA (100 ng) was performed with the ABI PRISM 7700 Sequence Detection System (Applied Biosystems) by using the SYBR Green PCR Master Mix (Applied Biosystems) and a specific 5′ and 3′ primer pair appropriate (0.3 μM; 5′, GATGAGTTAGCAACATGCCTTACAA; 3′, TCGTACCACCTTACTTCCACCAA) for the Rous sarcoma virus promotor. A PCR thermal profile of holding at 95°C for 10 min, denaturing at 95°C for 15 s, and annealing and extending at 60°C for 1 min was performed for 40 cycles. A standard curve, using the AAVhEPO plasmid and including 100 ng of genomic DNA of untreated animals for each specific tissue, was included for each QPCR. Triplicate samples were assayed in a single run.
Histologic Assessment of Submandibular Glands. Submandibular glands were removed for histologic analyses from AAVLacZ-treated mice (n = 5) at the time of death (week 8), embedded in medium for frozen tissue specimens (OCT compound, Sakura Finetek, Torrance, CA) and placed on dry ice. Sections were cut to 5-μm thickness. Infected cells were detected by immunohistochemical analyses (β-galactosidase-positive nuclear staining) by using the streptavidin-biotin peroxidase complex method. Frozen sections from animals administered AAVhEPO served as controls for the β-galactosidase staining experiment. Briefly, after endogenous peroxidase, streptavidin and biotin activities were blocked (Streptavidin/Biotin Blocking Kit SP-2002, Vector Laboratories, Burlingame, CA), and sections were incubated overnight at 4°C with a polyclonal primary antibody against β-galactosidase (B59136, Biodesign, Saco, ME; 1:500) raised in rabbits. Staining was developed by using a biotinylated goat antibody (Vector Laboratories) directed against the primary antibody and the avidin-biotin peroxidase complex followed by 3,3′-diaminobenzidine (SK-4100; Vector Laboratories) and counterstained with hematoxylin.
Southern Hybridization. Hirt extracted DNA, from submandibular glands of both treated and naïve animals (week 8), was used in the Southern hybridization analyses (18). Briefly, tissue samples were incubated in Hirt buffer (10 mM Tris, pH 8.0/10 mM EDTA/1% SDS/10 μg of DNase-free Rnase/0.5 mg/ml proteinase K) at 37°C overnight. NaCl was added to the digestion mixture at a final concentration of 1.0 M. After overnight incubation at 4°C, samples were centrifuged at 8,000 × g for 20 min. The supernatant, containing low-molecular-weight DNA, was phenol-chloroform-extracted, ethanol-precipitated, and the DNA dissolved in TE buffer. The pellet, containing high-molecular-weight genomic DNA, was washed several times with 75% ethanol and finally dissolved in TE buffer (10 mM Tris/1 mM EDTA, pH 8.0). Low-molecular-weight DNA was either undigested or digested with SmaI, BssH II, or Plasmid Safe DNase (Epicentre Technologies, Madison, WI), an enzyme-cutting linear DNA forms (19), whereas high-molecular-weight DNA was digested with SmaI. DNA from each sample (30 μg) was separated on 1% agarose gels, transferred to nylon membranes, and hybridized with an [α-32P]dCTP-radiolabeled Rous sarcoma virus-hEPO probe (a 1,264-bp SmaI fragment from the AAVhEPO plasmid; Fig. 1).
Results
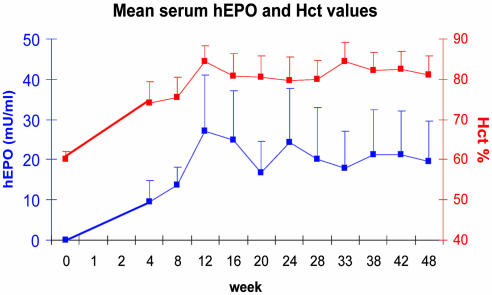
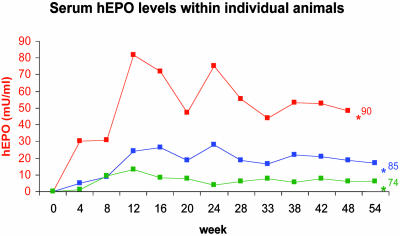
Serum hEPO and Hct Levels. Mean serum hEPO levels were nondetectable and mean Hct levels (±SE) were 60.2 ± 2% before administration (week 0) for all animals used in our experiments. In the AAVhEPO-treated group (109 particles/animal; n = 5) serum hEPO levels gradually increased for a 12-week period (Fig. 2; mean ± SE, 27.1 ± 13.9 milliunits/ml) and remained relatively stable thereafter with respect to each individual mouse (Fig. 3; week 54; longest time studied). For example, in week 28, serum hEPO levels averaged 20.2 ± 12 milliunits/ml, whereas in week 48, serum hEPO levels averaged 19.5 ± 10.1 milliunits/ml (Fig. 2). Hct levels increased in parallel with the serum hEPO levels (84.4 ± 4% in week 12), and remained elevated until the end of the experiment (80 ± 4.8 and 81.2 ± 4.5 in weeks 28 and 48, respectively; Fig. 2). Serum hEPO levels in the AAVLacZ-administered group (control group) remained undetectable throughout the 54 weeks of the experiment (data not shown). No change was observed in the Hct levels in the control group, which remained ≈60% until the end of the experiment (data not shown). The levels of hEPO detected in saliva were minimal (0.6 ± 0.6 milliunits/ml; n = 5) in mice treated with AAVhEPO.
Fig. 2.
Serum hEPO and Hct levels in AAVhEPO-treated mice. Vector (AAVhEPO; 109 particles per animal) was administered to BALB/c mouse submandibular SGs (n = 5) by retrograde ductal delivery as described in Materials and Methods. Data shown are the mean (+SE) serum hEPO (blue line, left y axis), and Hct (red line, right y axis) levels measured over a 48-week period.
Fig. 3.
Serum hEPO levels in three individual mice after AAVhEPO administration. Vector (109 particles per animal) was delivered as in Fig. 2, and hEPO was measured over a 54-week period; longest time studied [*, animal died at 48 weeks, apparently of a stroke (hemiparesis observed shortly before death) or was killed at indicated time points]. Hct levels at the time of death or euthanasia for each individual mouse are shown after the last measurement point.
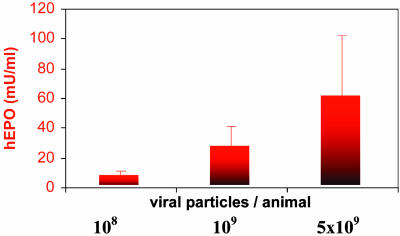
Serum hEPO levels in the other two dosage groups tested (n = 5 each; receiving either 108 or 5 × 10⁹ particles per animal) gradually increased from nondetectable in week 0 to 7.8 ± 3.8 milliunits/ml (n = 3) and 60.5 ± 42.1 milliunits/ml (n = 4) in week 12, respectively (Fig. 4). Hct levels in the same groups in week 12 were 72.3 ± 7.2% and 87.7 ± 2.5%, respectively.
Fig. 4.
hEPO expression is viral vector dose-dependent. Three groups of BALB/c mice received 108, 109, or 5 × 10⁹ particles per animal of the AAVhEPO vector via retrograde ductal cannulation of the submandibular SGs, as described in Fig. 2. Bars represent mean (+SE) serum hEPO levels 12 weeks after vector administration for each dosage group (n = 3, 5, and 4 animals per group, respectively).
Three groups of mice were killed in week 8 of these experiments. In the group administered AAVhEPO (n = 4, 109 particles per animal), mean serum hEPO levels were 15.2 ± 5.1 milliunits/ml (Hct, 77.5 ± 5.2). Conversely, serum hEPO levels remained nondetectable in both the AAVLacZ (n = 5, 109 particles per animal) and naïve (n = 4; 0.9% NaCl) groups, as observed in week 0 (data not shown).
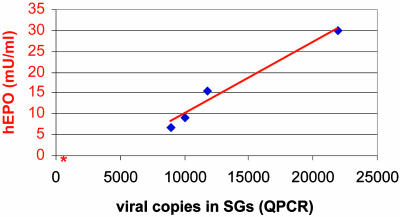
QPCR. QPCR was performed by using DNA extracted from submandibular glands, liver, spleen, and testis, to evaluate the number of viral copies present. Samples were obtained from the AAVhEPO group (n = 4; 109 particles per animal) and the naïve animal group (n = 4; 0.9% NaCl), killed in week 8. QPCR results are depicted in Table 1. Viral DNA was present only in the SGs of AAVhEPO-treated animals (13,185 ± 2,963 copies/100 ng of extracted DNA; n = 4). Naïve animals yielded background levels of 480 ± 32 copies/100 ng of DNA extracted from their SGs. There were no differences detected in the viral DNA present in the liver, spleen, and testis between AAVhEPO-treated and naïve animals. Furthermore, the correlation between viral copies present in the SGs of the AAVhEPO-treated animals and serum hEPO levels was highly significant (r = 0.98; Fig. 5).
Table 1. Number of viral copies in tissues after AAV vector administration to mouse submandibular glands.
| Tissue | AAVhEPO | Control |
|---|---|---|
| Salivary glands | 13,185 | 480 |
| Spleen | 336 | 303 |
| Liver | 567 | 511 |
| Testis | 183 | 204 |
AAVhEPO (109 particles per animal suspended in 50 μl of 0.9% NaCl) was delivered to mouse submandibular glands by means of intraductal cannulation. Control (naïve) animals were administered 50 μl of 0.9% NaCl via the same route. After 8 weeks, animals (n = 4 per group) were killed, the indicated tissues were obtained, and DNA was extracted, as described in Materials and Methods. Viral copy number was determined by QPCR as described in Materials and Methods.
Fig. 5.
Relationship between hEPO expression in serum and viral copies present in SGs in treated and naïve animals. Mice were killed 8 weeks after administration (n = 4; 109 particles of AAVhEPO per treated animal or 50 μl 0.9% normal saline per naïve animal), and viral copies present in the SGs and serum hEPO levels were measured as described in Materials and Methods. The correlation between viral copies present and serum hEPO levels was highly significant (r = 0.98). The red asterisk indicates the mean hEPO serum levels and mean number of viral copies present in SGs of naïve animals (n = 4).
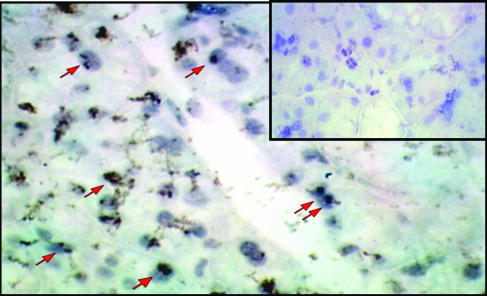
Histologic Assessment of Submandibular Glands. Immunocytochemistry assays were performed on SG tissue sections from AAVLacZ- (n = 5; 109 particles per animal) and AAVhEPO- (n = 4; 109 particles per animal) treated animals, killed in week 8 (Fig. 6). β-Galactosidase expression was observed only in the AAVLacZ-treated group. The AAVs infected 10-15% of the SG cells. Only ductal cells had positive nuclear staining (no staining was observed in the acinar cells). Additionally, no inflammatory infiltrate or structural abnormality was observed in the gland sections from mice treated with AAV vectors. No nuclear staining was observed in the tissue sections obtained from AAVhEPO-treated animals by using the same immunocytochemistry procedure (Fig. 6 Inset).
Fig. 6.
Immunocytochemical detection of β-galactosidase expression in mouse submandibular glands. Cryosections were prepared 8 weeks after AAVLacZ administration to mouse submandibular SGs (n = 5, 109 particles per animal), and β-galactosidase expression was detected by using an anti-β-galactosidase antibody. Sections were counterstained with hematoxylin. The β-galactosidase cDNA used contains a nuclear localization signal. Red arrows indicate representative cells with nuclear localized β-galactosidase. Staining was observed only in salivary ductal cells. No staining was detected in the control cryosections obtained from an animal receiving AAVhEPO by using the same immunocytochemistry procedure, as shown (Inset).
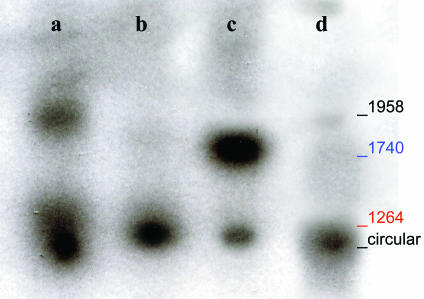
Southern Hybridization. Southern hybridization analysis was performed to examine the form of viral DNA present in SGs (Fig. 7). Hirt-extracted DNA, either undigested or digested with either SmaI, BssH II, or Plasmid Safe DNase, was examined. DNA was obtained from submandibular glands of both AAVhEPO-treated (n = 4; 109 particles per animal) and naïve animals (n = 4; 0.9% NaCl) killed in week 8. Plasmid Safe DNase cuts only linear forms of DNA, circular forms remaining intact (19). Undigested low-molecular-weight DNA from the AAVhEPO-treated group showed two hybridization positive bands (Fig. 7, lane a). The larger band corresponded to the length of the recombinant AAVhEPO viral DNA (1,958 bp). Digestion of the same DNA with SmaI or BssHII resulted in 1,264- and 1,740-bp fragments, respectively (Fig. 7, lanes b and c). These fragments correspond to those resulting from digestion of the AAVhEPO plasmid with the same enzymes (data not shown; see AAVhEPO construct in Fig. 1). A smaller band was also observed in lane c. This band corresponded to the lower band in lane a but was significantly weaker. After digestion of the extracted DNA with Plasmid Safe, only one band remained corresponding with the lower band in the undigested DNA lane (Fig. 7, lanes a and d). When high-molecular-weight DNA (extracted from the same SGs) was used after digestion with SmaI, no hybridization-positive bands were observed (data not shown). In addition, no hybridization-positive bands were observed in the Southern blots when DNA extracted from naïve animals was used (data not shown).
Fig. 7.
Southern hybridization blot of low-molecular-weight DNA from the SGs of AAVhEPO-treated animals. Vector (109 particles per animal) was administered, and Hirt-extracted DNA was prepared from SGs after 8 weeks, as described in Materials and Methods. Undigested Hirt-extracted DNA showed that the recombinant AAVhEPO viral DNA is 1,958 bp (lane a). Digestion of the Hirt-extracted DNA with SmaI (lane b) and BssHII (lane c) resulted in 1,264- and 1,740-bp fragments respectively, as expected (Fig. 1). Blue and red colors correspond to the red and blue lines in Fig. 1, indicating the restriction enzyme sites and the resulting DNA fragments. Digestion with Plasmid Safe (an enzyme only cutting linear DNA forms) indicated the presence of episomally maintained circular forms (lane d). Hirt-extracted DNA from naïve animals yielded no hybridization positive bands on Southern analyses (data not shown).
Discussion
The use of a major critical-for-life organ, e.g., liver or lung (3, 4), or a tissue not physiologically intended for secretion, e.g., muscle (5, 6), as targets for systemic gene therapeutics, although useful, can present certain obstacles with respect to clinical applicability. For example, use of the former can potentially lead to serious safety issues (7, 8), whereas use of the latter may not provide adequate levels of therapeutic protein production at low vector doses (20, 21). SGs are self-confined (encapsulated) and noncritical for life organs with striking secretory abilities. These features motivated us to suggest SGs as potential targets for gene therapeutics (11). Existing data suggest that SGs could be excellent targets for gene transfer with respect to safety and protein productivity (see refs. 10-13 and 22). Moreover, in case of an unanticipated severe adverse event after vector delivery, a single SG can be removed surgically (in contrast to liver or lung) with relatively little morbidity. That AAV vectors can be successfully used to stably deliver transgenes to the SGs is an additional safety consideration, because there is no evidence that AAV is an etiological agent for human disease (23). To further ensure safety, the use of SG tissue-specific promoters can be beneficial, because it would preclude transgene production from other tissues (24).
SG cells exhibit at least two distinct secretory pathways: a predominant regulated one leading to exocrine protein secretion into saliva via zymogen granules and a constitutive one leading to the bloodstream (9, 13, 25). Secretory proteins produced as transgene products in SGs, after viral-mediated gene transfer, continue to follow the same general secretory pathway as in their primary site of production (e.g., α1 antitrypsin follows the constitutive pathway, and growth hormone follows the regulated pathway; refs. 11, 13, and 25). EPO is secreted primarily from kidney tubular epithelial cells (26) via a constitutive pathway, targeting erythroid progenitor cells in the bone marrow and increasing red blood cell production and therefore Hct levels.
As we hypothesized, hEPO produced in mouse submandibular SGs was preferentially secreted into the bloodstream (constitutive pathway) throughout the entire length of our experiments, with salivary hEPO levels being minimal. Mean serum hEPO levels in the mice treated with AAVhEPO steadily increased for an 8- to 12-week period and remained relatively stable thereafter (week 48; Fig. 2). The stability of serum hEPO levels was even more apparent within individual mice (week 54, longest time studied; Fig. 3). Differences observed among individual mice are likely a result of both animal variability, and variability in the effectiveness of cannulation of SGs in 20-g mice. This latter problem is not a concern in larger animals and humans (10, 27). Notably, SGs were able to sustain serum hEPO levels well within the normal range (10-30 milliunits/ml; ref. 28). In addition, circulating hEPO proved not only therapeutically adequate but also functional throughout the experiment: Hct levels in all AAVhEPO-treated groups increased in parallel with serum hEPO levels. This indicates that SGs are capable of all the necessary posttranscriptional modifications required for the secretion and biological activity of this transgene product (29). Importantly, serum hEPO levels and Hct values were unaffected in the AAVLacZ-treated group.
SGs are directly accessed, in a relatively noninvasive manner, such as is performed clinically without anesthesia for contrast radiographs (10). During the procedure, almost the entire SG epithelial cell population is directly accessible to vector suspended in a small volume (50 μl for mice) within a confined space and thus is a potential gene transfer target (10). The latter circumstance along with the considerable physiological ability of SG cells to produce, process, and secrete high levels of proteins minimizes the amount of vector needed for AAV-mediated gene transfer with SGs. As a result, the vector dose (109 particles per animal) used in most of our experiments was 10- to 100-fold lower than typically reported with liver, lung, and muscle (3-6, 20, 21, 30). Furthermore, even a dose as low as 108 particles per animal led to clearly measurable and effective hEPO levels in the bloodstream (Fig. 4), indicating that the considerable protein production and secretory mechanisms in the SGs were easily “exploited.”
We used QPCR to measure viral load in SGs, testes, liver, and spleen from both treated and naïve animals. The persistent presence of viral DNA (i.e., 8 weeks after administration) was detected only in the targeted SGs (13,185 ± 2,963 copies/100 ng of extracted DNA; n = 4). Thus, undesirable dissemination of the virus beyond the SGs was below the sensitivity level of the assay, and administered AAV vector appears confined within the glands (Table 1). These results likely are attributable to the encapsulation of SGs as well as the small volumes of infusate and low viral doses used in our experiments.
We also considered whether the SGs were the actual site of hEPO production observed. We conclude that the QPCR results strongly indicate the hEPO measured in serum was solely produced by and secreted from the targeted SGs. As noted, viral DNA was essentially detected only in the targeted SGs. DNA tested from liver, spleen, and testis showed a similar number of viral copies in the QPCR analysis as measured in these tissues from naïve mice. Additional support for this conclusion is derived from the fact that the number of viral copies present in the SGs and the serum hEPO levels were strongly correlated (r = 0.98; Fig. 5).
DNA was also extracted from SGs and examined in an attempt to study the fate of the recombinant AAV DNA after administration. Southern hybridization analyses suggest that viral DNA was present as both double-stranded linear and stable circular forms (Fig. 7). The formation of these structures appears to be a key event for the AAV-mediated stable production of transgene products (31). As with results in muscle tissue (32), the primary form of AAV in the SGs appears to be episomal.
Immunocytochemistry assays performed on SG tissue sections from AAVLacZ treated animals demonstrated that the AAVs infected 10-15% of the SG cells (Fig. 6). Only ductal cells appeared susceptible to AAV infection. Acinar cells probably lack either appropriate viral receptors or key intracellular components for successful transduction. Importantly, no inflammatory infiltrate or structural abnormality was observed in gland sections at 8 weeks after administration, suggesting that retrograde ductal delivery of AAVs does not cause any irreversible damage to the SG tissue.
Interestingly, the life span of salivary epithelial cells in rodents has been estimated to be 125-200 days (33, 34), but the ability of SGs cells to divide is a controversial issue (35, 36). Our data suggest that either the transduced salivary ductal cells did not significantly divide during the 54-week period studied, in contrast to previous life-span estimates in rodents, or that if cell division occurred, transduced daughter cells remain functionally active within the SG tissue.
As a result of both the therapeutic significance and the convenience of using EPO as a reporter gene, there have been numerous preclinical in vivo studies examining EPO gene transfer. Many different gene transfer approaches to various tissues have been used to create an alternative site for long-term EPO production. Consequently, it is possible, albeit cautiously, to compare the results obtained herein with those using other approaches. For example, hydrodynamic plasmid injection directly to rat renal veins can lead to (rat) EPO expression from interstitial fibroblasts and elevated Hct levels for at least 6 months (37). However, this approach is considerably more invasive than SG delivery, with a higher potential risk. Other viral vectors, such as helper-dependent adenoviruses, have also been used for stable (mouse) EPO gene transfer (e.g., tail vein delivery; ref. 38). Optimization of such vectors results in elevated Hct levels for at least 6 months and, with future improvements in vector production, these vectors may have applicability to many tissue target sites. Other studies have used various cell types, genetically reengineered ex vivo and then implanted in vivo, for stable (rat) EPO production (e.g., ref. 39). This approach can result in elevated EPO and Hct levels for up to 1 year, similar to our results with hEPO, but depends on using either immunoisolation devices or autologous cells, in addition to cell transduction with a vector capable of integration, e.g., retrovirus. It seems at this early time in the development of clinical gene transfer strategies that no single gene transfer target site or gene delivery method will be suitable for all applications. Thus, comparisons of different strategies and tissue targets are particularly important.
Conclusion
We have hypothesized that the use of SGs for systemic gene therapeutics is consistent with the primary biological role of this tissue, i.e., by using normal protein production and secretion pathways. Our results show that stable long-term production of therapeutic serum levels of a functional protein can indeed be achieved relatively noninvasively in SGs by low doses of AAV vectors. Thus, SGs appear able to act as self-contained endogenous bioreactors after gene transfer and are therefore unusual yet promising targets for systemic gene therapeutics.
Acknowledgments
We thank Dr. M. Kriete and Mr. M. Papa for invaluable help with animal studies. We also thank Drs. M. Brownstein, R. Kotin, E. Mezey, J. Puck, L. Tabak, and K. Yamada for careful reading of and helpful comments on an earlier draft of this manuscript.
Abbreviations: SG, salivary gland; AAV, adeno-associated virus; LacZ, Escherichia coli β-galactosidase; hEPO, human erythropoietin; Hct, hematocrit; QPCR, quantitative real-time PCR.
References
- 1.Felgner, P. L. & Rhodes, G. (1991) Nature 349, 351-352. [DOI] [PubMed] [Google Scholar]
- 2.Crystal, R. G. (1995) Nat. Med. 1, 15-17. [DOI] [PubMed] [Google Scholar]
- 3.Snyder, R. O., Miao, C. H., Patijn G. A., Spratt, S. K., Danos, O., Nagy, D., Gown, A. M., Winther, B., Meuse, L., Cohen, L. K., et al. (1997) Nat. Genet. 16, 270-276. [DOI] [PubMed] [Google Scholar]
- 4.Auricchio, A., O'Connor, E., Weiner, D., Gao, G. P., Hildinger, M., Wang, L., Calcedo, R. & Wilson, J. M. (2002) J. Clin. Invest. 110, 499-504. [DOI] [PMC free article] [PubMed] [Google Scholar]
- 5.Johnston, J., Tazelaar, J., Rivera, V. M., Clackson, T., Gao, G. P. & Wilson, J. M. (2003) Mol. Ther. 7, 493-497. [DOI] [PubMed] [Google Scholar]
- 6.Bohl, D., Bosch, A., Cardona, A., Salvetti, A. & Heard, J. M. (2000) Blood 95, 2793-2798. [PubMed] [Google Scholar]
- 7.Carmen, I. H. (2001) Mol. Ther. 3, 425-428. [DOI] [PubMed] [Google Scholar]
- 8.Marshall, E. (2000) Science 288, 951-957. [PubMed] [Google Scholar]
- 9.Isenman, L., Liebow, C. & Rothman, S. (1999) Am. J. Physiol. 276, E223-E232. [DOI] [PubMed] [Google Scholar]
- 10.Baum, B. J., Wellner, R. B. & Zheng, C. (2002) Int. Rev. Cytol. 213, 93-146. [DOI] [PubMed] [Google Scholar]
- 11.Kagami, H., O'Connell, B. C. & Baum, B. J. (1996) Hum. Gene Ther. 7, 2177-2184. [DOI] [PubMed] [Google Scholar]
- 12.He, X., Goldsmith, C. M., Marmary, Y., Wellner, R. B., Parlow, A. F., Nieman, L. K. & Baum, B. J. (1998) Gene Ther. 5, 537-541. [DOI] [PubMed] [Google Scholar]
- 13.Baum, B. J, Berkman, M. E., Marmary, Y., Goldsmith, C. M., Baccaglini, L., Wang, S., Wellner, R. B., Hoque, A. T., Atkinson, J. C., Yamagishi, H., et al. (1999) Hum. Gene Ther. 10, 2789-2797. [DOI] [PubMed] [Google Scholar]
- 14.Yamano, S., Huang, L. Y., Ding, C., Chiorini, J. A., Goldsmith, C. M., Wellner, R. B, Golding, B., Kotin, R. M., Scott, D. E. & Baum, B. J. (2002) Hum. Gene Ther. 13, 287-298. [DOI] [PubMed] [Google Scholar]
- 15.Chiorini, J. A., Wendtner, C. M., Urcelay, E., Safer, B., Hallek, M. & Kotin, R. M. (1995) Hum. Gene Ther. 6, 1531-1541. [DOI] [PubMed] [Google Scholar]
- 16.Kaludov, N., Handelman, B. & Chiorini, J. A. (2002) Hum. Gene Ther. 13, 1235-1243. [DOI] [PubMed] [Google Scholar]
- 17.Baccaglini, L., Hoque, A. T., Wellner, R. B., Goldsmith, C. M., Redman, R. S., Sankar, V., Kingman, A., Barnhart, K. M., Wheeler, C. J. & Baum, B. J. (2001) J. Gene Med. 3, 82-90. [DOI] [PubMed] [Google Scholar]
- 18.Hirt, B. (1967) J. Mol. Biol. 26, 365-369. [DOI] [PubMed] [Google Scholar]
- 19.Almazan, F., Gonzalez, J. M., Penzes, Z., Izeta, A., Calvo, E., Plana-Duran, J. & Enjuanes, L. (2000) Proc. Natl. Acad. Sci. USA 97, 5516-5521. [DOI] [PMC free article] [PubMed] [Google Scholar]
- 20.Chao, H., Monahan, P. E., Liu, Y., Samulski, R. J. & Walsh, C. E. (2001) Mol. Ther. 4, 217-222. [DOI] [PubMed] [Google Scholar]
- 21.Kessler, P. D., Podsakoff, G. M., Chen, X., McQuiston, S. A., Colosi, P. C., Matelis, L. A., Kurtzman, G. J. & Byrne, B. J. (1996) Proc. Natl. Acad. Sci. USA 93, 14082-14087. [DOI] [PMC free article] [PubMed] [Google Scholar]
- 22.O'Connell, B. C., Zheng, C., Jacobson-Kram, D. & Baum, B. J. (2003) J. Oral Pathol. Med. 32, 414-421. [DOI] [PubMed] [Google Scholar]
- 23.Kay, M. A., Glorioso, J. C. & Naldini, L. (2001) Nat. Med. 7, 33-40. [DOI] [PubMed] [Google Scholar]
- 24.Zheng, C., Hoque, A. T., Braddon, V. R., Baum, B. J. & O'Connell, B. C. (2001) Hum. Gene Ther. 12, 2215-2223. [DOI] [PubMed] [Google Scholar]
- 25.Hoque, A. T., Baccaglini, L. & Baum, B. J. (2001) Hum. Gene Ther. 2, 1333-1341. [DOI] [PubMed] [Google Scholar]
- 26.Mujais, S. K., Beru, N., Pullman, T. N. & Goldwasser, E. (1999) Cell Biochem. Biophys. 30, 153-166. [DOI] [PubMed] [Google Scholar]
- 27.Li, J., Zheng, C., Zhang, X., Liu, X., Zhang, C., Goldsmith, C. M., Baum, B. J. & Wang, S. (2004) J. Gene Med. 6, 55-63. [DOI] [PubMed] [Google Scholar]
- 28.Kendall, R. G. (2001) Clin. Lab. Haematol. 23, 71-80. [DOI] [PubMed] [Google Scholar]
- 29.Dube, S., Fisher, J. W. & Powell, J. S. (1988) J. Biol. Chem. 263, 17516-17521. [PubMed] [Google Scholar]
- 30.Samakoglu, S., Bohl, D. & Heard, J. M. (2002) Mol. Ther. 6, 793-803. [DOI] [PubMed] [Google Scholar]
- 31.Duan, D., Sharma, P., Yang, J., Yue, Y., Dudus, L., Zhang, Y., Fisher, K. J. & Engelhardt, J. F. (1998) J. Virol. 72, 8568-8577. [DOI] [PMC free article] [PubMed] [Google Scholar]
- 32.Schnepp, B. C., Clark, K. R., Klemanski, D. L., Pacak, C. A. & Johnson, P. R. (2003) J. Virol. 77, 3495-3504. [DOI] [PMC free article] [PubMed] [Google Scholar]
- 33.Zajicek, G., Yagil, C. & Michaeli, Y. (1985) Anat Rec. 213, 150-158. [DOI] [PubMed] [Google Scholar]
- 34.Cameron, I. L. (1970) Tex. Rep. Biol. Med. 28, 203-248. [PubMed] [Google Scholar]
- 35.Denny, P. C., Ball, W. D. & Redman, R. S. (1997) Crit. Rev. Oral Biol. Med. 8, 51-75. [DOI] [PubMed] [Google Scholar]
- 36.Redman RS. (1995) Anat. Rec. 241, 529-540. [DOI] [PubMed] [Google Scholar]
- 37.Maruyama, H., Higuchi, N., Nishikawa, Y., Hirahara, H., Iino, N., Kameda, S., Kawachi, H., Yaoita, E., Gejyo, F. & Miyazaki, J.-I. (2002) Hum. Gene Ther. 13, 455-468. [DOI] [PubMed] [Google Scholar]
- 38.Sandig, V., Youil, R., Bett, A. J., Franlin, L. L., Oshima, M., Maione, D., Wang, F., Metzker, M. L., Savino, R. & Caskey, C. T. (2000) Proc. Natl. Acad. Sci. USA 97, 1002-1007. [DOI] [PMC free article] [PubMed] [Google Scholar]
- 39.Yanay, O., Barry, S. C., Flint, L. Y., Brezezinski, M., Barton, R. W. & Osborne, W. R. A. (2003) Hum. Gene Ther. 14, 1587-1593. [DOI] [PubMed] [Google Scholar]


