

Abstract
The fluorescence resonant energy transfer (FRET) from a donor to an acceptor via transition dipole–dipole interactions decreases the donor's fluorescent lifetime. The donor's fluorescent lifetime decreases as the FRET efficiency increases, following the equation: EFRET = 1 − τDA/τD, where τD and τDA are the donor fluorescence lifetime without FRET and with FRET. Accordingly, the FRET time trajectories associated with single-molecule conformational dynamics can be recorded by measuring the donor's lifetime fluctuations. In this article, we report our work on the use of a Cy3/Cy5-labeled enzyme, HPPK to demonstrate probing single-molecule conformational dynamics in an enzymatic reaction by measuring single-molecule FRET donor lifetime time trajectories. Compared with single-molecule fluorescence intensity-based FRET measurements, single-molecule lifetime-based FRET measurements are independent of fluorescence intensity. The latter has an advantage in terms of eliminating the analysis background noise from the acceptor fluorescence detection leak through noise, excitation light intensity noise, or light scattering noise due to local environmental factors, for example, in a AFM-tip correlated single-molecule FRET measurements. Furthermore, lifetime-based FRET also supports simultaneous single-molecule fluorescence anisotropy.
1. Introduction
Fluorescence resonant energy transfer (FRET) is the energy transfer from the donor to the acceptor via non-radiative transition dipole–dipole interactions. The energy transfer efficiency (EFRET) depends on the distance between the donor and acceptor:1,2
| (1) |
where r is the separate distance between two fluorescent dyes, the FRET donor and acceptor, typically the distance is in the range of 30–80 Å. R0 being the Förster radius, is the separate distance when EFRET equals 50% and is dependent on the dipole orientation of the two dyes, the refractive index of the medium, the spectral overlap integral between donor emission and acceptor absorbance, and the quantum yield of the donor.1,2
Since EFRET is sensitive to distance changes between the donor and acceptor, and the energy transfer efficiency can also be determined by probing the fluorescence intensity of the donor (ID) and acceptor (IA):1,2
| (2) |
Therefore, by labeling the donor and acceptor dye probes in the specific positions of a protein and measuring single-molecule EFRET ~ t trajectories, the time-resolved single-molecule conformational dynamics can be probed.3–10 However, the FRET signals on the basis of donor-acceptor (D–A) photon intensities measurements coming from the ratio of photon intensity typically depends on a number of experimental configuration and detection parameters: such as direct excitation of the acceptor at the donor excitation wavelength, donor fluorescence photons bleak through the acceptor photon detection channel, excitation intensity, collection efficiency, and position of dye with respect to the excitation beam, and thermal noise, etc.11,12 A typical FRET intensity-based efficiency measurement is particularly susceptible to measurement error and background noise when the experimental parameters are variable and time dependent during the measurements. The measurement error can even dominate the real signals, especially, for protein or enzymatic conformational dynamics study in catalytic reactions: since the change in the donor-acceptor distance is often only 1–2 nm for the enzyme active-site conformational changes.13–16
Fluorescence lifetime refers to the average time that a molecule stays in its excited state before emitting a photon and is an intrinsic property of a fluorophore.1 At the single molecule level, the fluorescence lifetime fluctuates reflecting the heterogeneity and fluctuations of the local environment.17–19 The excited-state energy transfer from the donor to acceptor via dipole–dipole interactions decreases the donor's fluorescent lifetime, and the amplitude of the donor's fluorescent lifetime decreases as the FRET efficiency increases:1
| (3) |
where τDA and τD are donor's lifetime in the presence (τDA) and in the absence (τD) of the acceptor, i.e., with and without the FRET interactions, respectively. On the basis of the relationship between fluorescence lifetime and FRET efficiency indicated by eqn (3), lifetime based single-molecule FRET measurements have been developed and applied in studying bio-molecule conformational dynamics.20–23
Compared with the lifetime of the donor in the absence of the acceptor (τD), the lifetime of the donor in the presence of the acceptor (τDA) fluctuates on a relatively larger scale, reflecting the different energy transfer efficiency between the donor and acceptor due to the D–A distance fluctuation associated with the protein conformational dynamics. Given a subtle fluctuation of the donor's lifetime in the absence of the acceptor, the relation between EFRET and the donor's lifetime in the presence of the acceptor (τDA) is anti-correlated, referring to eqn (3); i.e., the FRET efficiency increases when the donor lifetime (τDA) decreases, and vice versa. Therefore, we are able to study the single-molecule conformational dynamics by measuring the donor's lifetime trajectory τDA ~ t in the presence of the acceptor, where t is the chronic time of data recording.24,25 Compared with the fluorescence intensity based FRET trajectory EFRET ~ t measurement (eqn (2)) where both ID and IA need to be measured simultaneously, the fluorescence lifetime based FRET measurement of lifetime trajectory τDA ~ t can be achieved by monitoring only the donor's lifetime signal (τDA) in the presence of the acceptor. In this way, the FRET detection is more effective under various single-molecule spectroscopy measurement conditions where fluorescence intensity may be influenced and perturbed by local environment fluctuations that are irrelevant to the intrinsic protein conformational dynamics.26–29 Overall, lifetime based FRET can be a more accurate method to probe the conformational dynamics of proteins under complex measurement conditions, such as AFM tip-enhanced single-molecule spectroscopic and imaging measurements.30–33 In this article, we report a single molecule lifetime-based FRET method to study conformational dynamics of a protein via the time-correlated single photon counting technique.
We chose HPPK (6-hydroxymethyl-7,8-dihydropterin pyrophosphokinase) as a model system to demonstrate this single molecule lifetime-based FRET method. HPPK, a single-subunit kinase of 18 KDa, 158 residues (Fig. 1), catalyzes the transfer of pyrophosphate from HP (6-hydroxymethyl-7,8-dihydropterin) to HPPP (6-hydroxymethyl-7,8-dihydropterin pyrophosphate) with ATP (adenosine-5'-triphosphate) participation. This catalytic phosphorylation reaction, as a critical reaction in the folate biosynthetic pathway, is a promising target for potential antibacterial drug development. It has been reported that among three catalytic loops involved in the enzymatic conformational changes (Fig. 1), loop 3 undergoes the most measurable conformational motions.34–36
Fig. 1.
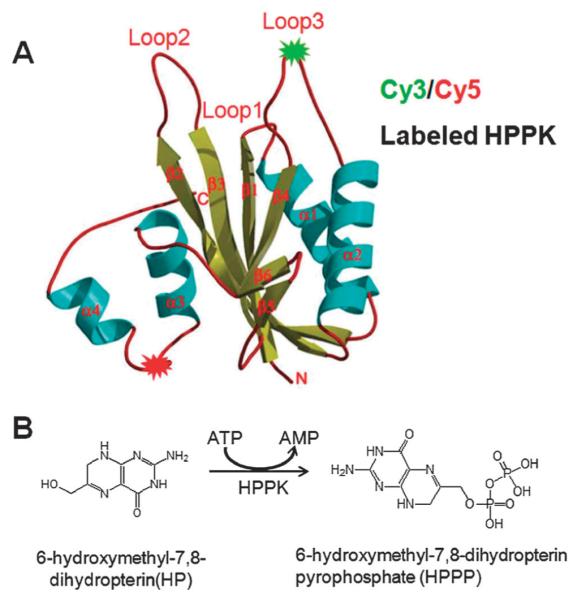
(A) Crystal structure of HPPK. The cyan spirals represent the α helices and the yellow arrows are the β strands. The loops are shown by the red pipes. FRET dyes pair of Cy3–Cy5 are labeled on residue 88 and residue 142, respectively. (B) The reaction of HPPK-catalyzed pyrophosphoryl transfer from HP to HPPP.
2. Experiments and theoretical analysis
We received the Cy3/Cy5 donor–acceptor labeled HPPK from Prof. Honggao Yan of Michigan State University, and the Cy3/Cy5 FRET pair are labeled at the amino acid residues 88 on loop 3 and residue 142 on protein core close to the active site of the enzyme (Fig. 1A). In our experiments, 0.1 nM HPPK, 100 μM ATP and 100 μM HP were sandwiched between two clean glass cover-slips in 1% agarose gel (in 99% water). In the 1% agarose gel, single HPPK enzyme molecules can rotate freely to perform its enzymatic activity, and the substrates along with the corresponding products can diffuse uninterruptedly.16 In all measurements, the solution environment was 50 mM tris buffer (pH = 8.3) and 10 mM MgCl2, oxygen scavenger was added into the solution to reduce photo-bleaching of the dye and Trolox was added into the solution to reduce the dye's unfavorable triplet state.2
We used femtosecond pulse laser excitation and a home-built two-channel single-molecule FRET lifetime microscope. A detailed description of our measurement and instrumentation has been reported previously.14 Briefly, an inverted confocal microscope (Axiovert 200, Zeiss) integrated with an electropiezo-driven nanopositioner (Physik Instrumente) was used for the measurements. An 76 MHz femtosecond Ti:Sapphire laser (Mira 900 oscillator, and Mira OPO, Coherent) operating at 1064 nm was frequency doubled to 532 nm using a BBO crystal. The confocal beam was reflected by a dichroic beam splitter (z532rdc, Chroma Technology) and was focused by a high-numerical-aperture objective (1.3 NA, 100 ×, Zeiss) on the sample at a diffraction limited spot of ~ 300 nm diameter. To obtain the fluorescence images and intensity trajectories, the emission signal was split with a dichroic beam splitter (640 dcxr) into two color beams centered at 570 nm and 670 nm representing Cy3 and Cy5 emissions, respectively. The two signal channels were detected by a pair of Si avalanche photodiode single photon counting modules (SPCM-AQR-16, Perkin Elmer Optoelectronics). Typical images (10 μm × 10 μm) were acquired by computer-controlled raster-scanning the sample over the laser focus with a scanning speed of 4 ms per pixel, with each image of 100 pixels × 100 pixels. The fluorescence intensities trajectories of the donor (Cy3) and accepter (Cy5) were recorded through a PHR800 four channel detector router (PicoQuant) to a PicoHarp 300 (PicoQuant) time correlated single photon counting (TCSPC) module.24,25,37,38 The arrival time tp and the delay time (τp, between the laser excitation pulse and the fluorescence photon emission) of each fluorescence photon are recorded by TCSPC (Fig. 2). Not only the intensity time trajectory but also lifetime trajectory can be obtained by analyzing these two parameters of each fluorescence photon (Fig. 3). We have used autocorrelation function to analyze the single-molecule FRET fluctuation dynamics. The autocorrelation C(t) functions39–43 are defined by eqn (4):
| (4) |
where I(t) represent the signal variables measured in time trajectories {I(t)}.〈I〉 is the means of the fluctuation trajectories of I(t).
Fig. 2.
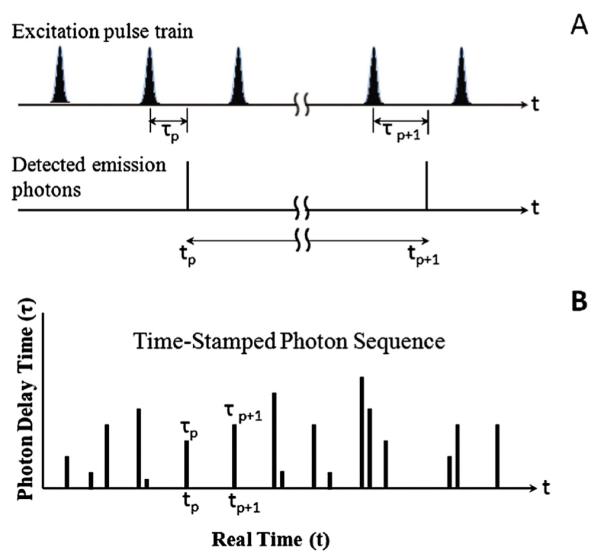
Photon stamping concept and definition of the parameters: (A) scheme of a train of laser excitation pulses and detected emission photons; (B) scheme of the time-stamped photon sequence. The delay time τp is the time delay between the photoexciation event and the photon emission; the real time t is the chronic time of detecting emission photons; for each detected photon, both τp and tp are simultaneously recorded.
Fig. 3.

Single-molecule photon-stamping measurement and data analysis. All the data are collected from a Cy3–Cy5 labeled single HPPK molecule under the enzymatic reaction conditions: 100 μM ATP and 100 μM HP. (A) An example of the single-molecule photon-stamping raw data from the donor channel in a 0.8 second period (5.8–6.6 s). Each data dot corresponds to a detected photon plotted by the delay time (τp) vs. its chronic arrival time (t). (B) Histograms of the delay times of the photons in a 10 ms period from the trajectory shown in A. The left panel is histogram of delay times in 10 ms (6.08–6.09 s), corresponding to the low energy transfer efficiency from donor to acceptor. The right panel is histogram of delay times in 10 ms (6.30–6.31 s), corresponding to the high energy transfer efficiency. (C) Lifetime trajectory of donor (τDA) calculated from the trajectory in A with 10 ms binning. The arrows show the positions (6.08–6.09 s) and (6.30–6.31 s) of the lifetime trajectory. (D) Intensity trajectory of donor calculated from trajectory in A with 10 ms binning.
3. Results and discussion
Fig. 3 shows a typical single-molecule lifetime trajectory collected from a Cy3–Cy5 labeled HPPK molecule under enzymatic reaction conditions with substrates of 100 μM ATP and 100 μM HP, which illustrates the basis of single molecule donor's lifetime trajectory τDA ~ t measurements. In this measurement, we record each fluorescence photon's real arrival time tp and each fluorescence photon's delay time τp related to the laser pulse excitation (Fig. 2). Fig. 3A shows a portion of single-molecule photon stamping raw data from the donor channel in a period of 0.8 s. For each detected photon, we recorded two parameters: a chronic arrival time (t) and a delay time related to the femtosecond laser pulse excitation (τp) (Fig. 2). The chronic arrival times of the fluorescence photons contain the information about the photon flux so that we can count and bin the photons in a given time scale, for example, 10 ms binning time, to obtain a typical fluorescence intensity trajectory shown in the bottom panel in Fig. 3D. Furthermore, we plot the histogram of the photon delay times in a binning period (10 ms) to obtain the fluorescence lifetime in each time bin (Fig. 3B). The lifetime (τDA) in each 10 ms bin (Fig. 3B) can be obtained by fitting the histogram of delay time of all the photon in 10 ms bin with exponential function or by calculating the mean of the delay time of all of the photons in 10 ms bins. We typically treat the photon counting distribution in each bin as a Poisson distribution that gives the means of each distribution as the fluorescence lifetime, τDA.44,45 In Fig. 3B, we show typical histograms of the fluorescence photons' delay time in 10 ms bins under different FRET states. The decrease in fluorescence lifetime, comparing left and right panels, indicates an increase of the FRET efficiency, most likely resulting from the decrease of donor–acceptor separation distance (insets in Fig. 3B). After calculating all the delay times in each 10 ms bin from the original photon stamping data (Fig. 3A), and connecting the lifetime data resolved in all of the time bins, we obtain the lifetime trajectory of the donor (τDA ~ t, shown in Fig. 3C). The lifetime trajectory of the donor involved in FRET reports the EFRET fluctuation associated with the enzyme conformational fluctuation, based on eqn (3). Therefore, by analyzing the donor lifetime trajectory, we are able to detect conformational dynamics, probing real-time donor–acceptor distance changes.
To demonstrate that the enzymatic conformational dynamics obtained from the lifetime trajectory is correlated with that from the FRET efficiency trajectory, we have used single molecule lifetime-based FRET to study the conformational dynamics of Cy3/Cy5 labeled HPPK enzyme in a catalytic reaction. Fig. 4A and B show donor–acceptor two channel single molecule fluorescence images (10 μm by 10 μm) of HPPK (0.1 nM) molecules labeled with Cy3 and Cy5 dye probes in the presence of 100 μM ATP and 100 μM HP, confined in 1% agarose gel (containing 99% water) sandwiched between two cover slips. Each individual feature in the images is attributed to a single HPPK molecule, and the intensity variations among the molecules are due to FRET. Fig. 4C shows the obtained single-molecule fluorescence intensity trajectory of the donor. Fig. 4D shows lifetime trajectory of donor τDA (purple) from Cy3(green)/Cy5(red)-labeled HPPK under enzymatic reaction conditions with 100 μM ATP and 100 μM HP, and the lifetime trajectory of τD (green) with only Cy3 labeled HPPK under the same conditions. It is clear that the lifetime trajectory of τD (green) with only Cy3 labeled HPPK is narrow compared to the lifetime trajectory of τDA with Cy3(green)/Cy5(red)-labeled HPPK in enzymatic reaction conditions. The narrow distribution of τD compared with τDA indicates the change in the lifetime trajectory of τDA is due to the FRET between donor and acceptor reflecting the conformational change in the enzymatic reaction. Fig. 4E shows the FRET trajectories calculated by eqn (3) from the data from Fig. 4D, where we use the fitting value 2.65 ns as τD to avoid introducing more measurement error. Fluorescence intensity autocorrelation functions can extract kinetics constants of chemical reactions or enzymatic reactions with single molecule fluorescence correlation spectroscopy.46,47 In comparing the validity of lifetime FRET recording, we calculated the autocorrelations of the single-molecule fluorescence intensity (Fig. 4C), lifetime τDA (Fig. 4D), and FRET (Fig. 4E) trajectories of the donor. The results, as shown in Fig. 4F, G and H respectively, indicate that the autocorrelations calculated from different methods (intensity, FRET efficiency, lifetime) have the same decay time of about 0.14 ± 0.01 s, which suggests that both the intensity trajectory and lifetime trajectory or FRET efficiency trajectory based on lifetime measurements give consistent conformational dynamics information. Furthermore, probing enzyme conformational fluctuation at ms to sub-second time scales effectively averages out the much faster lifetime fluctuations originating from dye local environment fluctuations due to complex dynamics of solvation, enzymatic substrate interaction, and protein non-reaction coordinate conformational fluctuations. The local environment fluctuations are typically at time scales of picoseconds to nanoseconds, and the impact of the fluctuations on fluorescence lifetime is averaged out at the ms and longer bin time scales in our single-molecule measurements.
Fig. 4.

Single-molecule fluorescence images (10 μm × 10 μm) of Cy3 (A) and Cy5 (B) labeled HPPK molecules in 1% agarose gel Tris-HCl buffer solution (pH = 8.3). (C) Single-molecule fluorescence intensity trajectory of donor from Cy3/Cy5-labeled HPPK under the enzymatic reaction condition with 100 μM ATP and 100 μM HP. (D) Lifetime trajectory of Cy3, τDA (purple) from Cy3/Cy5-labeled HPPK and Lifetime trajectory of Cy3, τD (green) with only Cy3 labeled under the enzymatic reaction condition with 100 μM ATP and 100 μM HP. (E) EFRET trajectory of Cy3–Cy5 labeled HPPK, calculated from lifetime time trajectory in D, where we use the fitting value of 2.65 ns as τD. (F, G, H) Auto-correlations from the intensity trajectory in C, lifetime trajectory τDA in D, and EFRET trajectory in E show the same decay time τ = 0.14 ± 0.01 s.
There are significant advantages and crucial applications of lifetime-based FRET vs. intensity-based FRET in studying molecular conformational changes at the single-molecule level. Theory and experimental methods of single-molecule fluorescence lifetime measurements based on time-correlated single photon counting (TCSPC) have been developed and applied in single-molecule dynamics analyses including single-molecule photon-stamping and single-molecule FRET measurements.24,25,37,38,45,48,49 The time resolution of single-molecule fluorescence FRET is usually limited by the binning time of single photon recording, it is difficult to observe molecular dynamics that occur on a time scale faster than the binning time.26,29 Simultaneous detection and analysis of both lifetime and fluorescence intensities have been successfully applied by using joint two-dimensional distribution plots of intensity-derived FRET efficiency versus donor lifetime to identify interconverting states,23,50–53 where intensity-derived FRET efficiency is correlated with the fluorescence lifetime of the donor quenched by FRET. Furthermore, because the rotational correlation time for proteins are comparable to the lifetime of fluorophores labeled on the proteins, another important application for lifetime-based FRET is the simultaneous measurement of single-molecule fluorescence anisotropy that can provide both the rotational diffusion and internal flexibility dynamic information of proteins.24,25,54–56
Another important application for lifetime-based FRET is AFM tip correlated single-molecule FRET measurements. Due to the micro-mirror effect of the AFM tip under laser illumination, the intensity of donor and acceptor fluorescence and the calculated intensity-based EFRET were shown to be perturbed by the tip approaching/withdrawing movements.31 However, lifetime-based EFRET can avoid the effect of tip perturbation associated intrinsically with the tip approaching/withdrawing movements. Fig. 5 shows the AFM tip correlated single-molecule FRET measurement using a fs pulse laser. The collected intensities (Fig. 5A) of donor (green) and acceptor (red) as well as the correlated FRET efficiency (Fig. 5B) that were calculated based on the measured fluorescence intensity change as the tip approached and withdraw from the Cy3–Cy5 labeled HPPK on a cover glass, Both Fig. 5A and Fig. 5B show the strong correlation with the AFM tip approaching/withdrawing movements, which is due to the so called “mirror effect”. The tip as a mirror to reflect more fluorescence photons to the object as the tip is close to the dye labeled single-molecule proteins. In contrast, the lifetime-based EFRET trajectory (Fig. 5C) shows no correlation between the tip approaching/withdrawing movements and the lifetime-based FRET efficiency EFRET as that of the intensity-based FRET efficiency EFRET. It is clear that the lifetime-based EFRET can effectively remove the artifact measurement background due to the perturbation of the tip approaching/withdrawing movements, and lifetime-based FRET should be particularly useful in the applications of AFM tip correlated single-molecule FRET manipulation and measurements of protein dynamics.31 Since the single-molecule FRET measurements often involve much smaller changes of the FRET efficiency in probing protein conformational dynamics14,16,31,46 than, for example, probing DNA/RNA conformational dynamics,29,57 this technical advantage is particularly important for measuring FRET fluctuations associated with single-molecule protein conformational dynamics.
Fig. 5.

(A) A fluorescence intensity-time trajectory of donor (green) and acceptor (red) in a single-molecule AFM-FRET measurement on one HPPK (labeled Cy3–Cy5 on 88c, 142c), the experiment was performed in 50 mM tris buffer (pH = 8.3) and 10 mM MgCl2, but no enzymatic reaction substrate were added. The donor–acceptor intensities change show the strong correlation with the AFM tip approaching-withdrawing movements. (B) Intensity-based FRET efficiency-time trajectory calculated from trajectory A, and the EFRET changes obviously in correlation with the AFM tip approaching-withdrawing movements, which is an artifact background that complicating the real protein dynamics analysis. (C) Lifetime-based FRET efficiency-time trajectory from the lifetime measurement, the lifetime-based EFRET shows no significant correlation with the AFM tip approaching-withdrawing movements, effectively removed the AFM-FRET measurement artifact background.
4. Conclusions
In conclusion, we present here a single molecule lifetime-based FRET method on the basis of single-molecule photon stamping spectroscopy to characterize conformational dynamics of an individual protein. The result shows that the lifetime of the donor is related to the donor–acceptor distance in FRET, and we can probe the change in the single-molecule donor–acceptor distance with time or the single-molecule conformational dynamics by measuring the donor's lifetime trajectory. Moreover, lifetime-based FRET only measures the donor's lifetime time trajectory and is independent of other factors from the measurements, such as, crosstalk, excitation intensity, collection efficiency, and position of the dye with respect to the excitation beam. These advantages make this approach very effective and reliable for single molecule enzymatic conformational dynamic studies, especially for future complex AFM tip correlated single-molecule FRET manipulation and measurements of protein dynamics.
Acknowledgements
This work is supported by the Basic Material Sciences of Army Research Office. This work is also supported in part by NIH NIGMS. We thank Prof. Honggao Yan from the State University of Michigan for the Cy3–Cy5 labeled HPPK kinase protein samples.
References
- 1.Lakowicz J. Principles of fluorescence spectroscopy. Springer Verlag; 2006. [Google Scholar]
- 2.Roy R, Hohng S, Ha T. Nat. Methods. 2008;5:507–516. doi: 10.1038/nmeth.1208. [DOI] [PMC free article] [PubMed] [Google Scholar]
- 3.Deniz AA, Laurence TA, Beligere GS, Dahan M, Martin AB, Chemla DS, Dawson PE, Schultz PG, Weiss S. Proc. Natl. Acad. Sci. U. S. A. 2000;97:5179–5184. doi: 10.1073/pnas.090104997. [DOI] [PMC free article] [PubMed] [Google Scholar]
- 4.Zhuang XW, Bartley LE, Babcock HP, Russell R, Ha TJ, Herschlag D, Chu S. Science. 2000;288:2048–2051. doi: 10.1126/science.288.5473.2048. [DOI] [PubMed] [Google Scholar]
- 5.Haas E. ChemPhysChem. 2005;6:858–870. doi: 10.1002/cphc.200400617. [DOI] [PubMed] [Google Scholar]
- 6.Schuler B, Lipman EA, Eaton WA. Nature. 2002;419:743–747. doi: 10.1038/nature01060. [DOI] [PubMed] [Google Scholar]
- 7.Ha T, Enderle T, Ogletree DF, Chemla DS, Selvin PR, Weiss S. Proc. Natl. Acad. Sci. U. S. A. 1996;93:6264–6268. doi: 10.1073/pnas.93.13.6264. [DOI] [PMC free article] [PubMed] [Google Scholar]
- 8.Margittai M, Widengren J, Schweinberger E, Schroder GF, Felekyan S, Haustein E, Konig M, Fasshauer D, Grubmuller H, Jahn R, Seidel CAM. Proc. Natl. Acad. Sci. U. S. A. 2003;100:15516–15521. doi: 10.1073/pnas.2331232100. [DOI] [PMC free article] [PubMed] [Google Scholar]
- 9.Jia YW, Talaga DS, Lau WL, Lu HSM, DeGrado WF, Hochstrasser RM. Chem. Phys. 1999;247:69–83. [Google Scholar]
- 10.Talaga DS, Lau WL, Roder H, Tang JY, Jia YW, DeGrado WF, Hochstrasser RM. Proc. Natl. Acad. Sci. U. S. A. 2000;97:13021–13026. doi: 10.1073/pnas.97.24.13021. [DOI] [PMC free article] [PubMed] [Google Scholar]
- 11.Gordon GW, Berry G, Liang XH, Levine B, Herman B. Biophys. J. 1998;74:2702–2713. doi: 10.1016/S0006-3495(98)77976-7. [DOI] [PMC free article] [PubMed] [Google Scholar]
- 12.Gu Y, Di L, Kelsell DP, Zicha D. J. Microsc. 2004;215:162–173. doi: 10.1111/j.0022-2720.2004.01365.x. [DOI] [PubMed] [Google Scholar]
- 13.Hanson JA, Duderstadt K, Watkins LP, Bhattacharyya S, Brokaw J, Chu JW, Yang H. Proc. Natl. Acad. Sci. U. S. A. 2007;104:18055–18060. doi: 10.1073/pnas.0708600104. [DOI] [PMC free article] [PubMed] [Google Scholar]
- 14.Chen Y, Hu DH, Vorpagel ER, Lu HP. J. Phys. Chem. B. 2003;107:7947–7956. [Google Scholar]
- 15.Liu R, Hu D, Tan X, Lu HP. J. Am. Chem. Soc. 2006;128:10034–10042. doi: 10.1021/ja057005m. [DOI] [PubMed] [Google Scholar]
- 16.He Y, Li Y, Mukherjee S, Wu Y, Yan H, Lu HP. J. Am. Chem. Soc. 2011;133:14389–14395. doi: 10.1021/ja204644y. [DOI] [PMC free article] [PubMed] [Google Scholar]
- 17.Macklin JJ, Trautman JK, Harris TD, Brus LE. Science. 1996;272:255–258. [Google Scholar]
- 18.Vallee RAL, Tomczak N, Kuipers L, Vancso GJ, van Hulst NF. Phys. Rev. Lett. 2003;91:038301. doi: 10.1103/PhysRevLett.91.038301. [DOI] [PubMed] [Google Scholar]
- 19.Veerman JA, Garcia-Parajo MF, Kuipers L, van Hulst NF. Phys. Rev. Lett. 1999;83:2155. doi: 10.1103/PhysRevLett.85.5312. [DOI] [PubMed] [Google Scholar]
- 20.Elangovan M, Day RN, Periasamy A. J. Microsc. 2002;205:3–14. doi: 10.1046/j.0022-2720.2001.00984.x. [DOI] [PubMed] [Google Scholar]
- 21.Merchant KA, Best RB, Louis JM, Gopich IV, Eaton WA. Proc. Natl. Acad. Sci. U. S. A. 2007;104:1528–1533. doi: 10.1073/pnas.0607097104. [DOI] [PMC free article] [PubMed] [Google Scholar]
- 22.Webb SED, Roberts SK, Needham SR, Tynan CJ, Rolfe DJ, Winn MD, Clarke DT, Barraclough R, Martin-Fernandez ML. Biophys. J. 2008;94:803–819. doi: 10.1529/biophysj.107.112623. [DOI] [PMC free article] [PubMed] [Google Scholar]
- 23.Laurence TA, Kong XX, Jager M, Weiss S. Proc. Natl. Acad. Sci. U. S. A. 2005;102:17348–17353. doi: 10.1073/pnas.0508584102. [DOI] [PMC free article] [PubMed] [Google Scholar]
- 24.Hu DH, Lu HP. J. Phys. Chem. B. 2003;107:618–626. [Google Scholar]
- 25.Tan X, Hu DH, Squier TC, Lu HP. Appl. Phys. Lett. 2004;85:2420–2422. [Google Scholar]
- 26.Edel JB, Eid JS, Meller A. J. Phys. Chem. B. 2007;111:2986–2990. doi: 10.1021/jp066530k. [DOI] [PubMed] [Google Scholar]
- 27.Zhong W, Wu M, Chang C-W, Merrick KA, Merajver SD, Mycek M-A. Opt. Express. 2007;15:18220–18235. doi: 10.1364/oe.15.018220. [DOI] [PubMed] [Google Scholar]
- 28.Palo K, Brand L, Eggeling C, Jager S, Kask P, Gall K. Biophys. J. 2002;83:605–618. doi: 10.1016/S0006-3495(02)75195-3. [DOI] [PMC free article] [PubMed] [Google Scholar]
- 29.Sorokina M, Koh H-R, Patel SS, Ha T. J. Am. Chem. Soc. 2009;131:9630–9631. doi: 10.1021/ja902861f. [DOI] [PMC free article] [PubMed] [Google Scholar]
- 30.Gumpp H, Puchner EM, Zimmermann JL, Gerland U, Gaub HE, Blank K. Nano Lett. 2009;9:3290–3295. doi: 10.1021/nl9015705. [DOI] [PubMed] [Google Scholar]
- 31.He Y, Lu M, Cao J, Lu HP. ACS Nano. 2012;6:1221–1229. doi: 10.1021/nn2038669. [DOI] [PMC free article] [PubMed] [Google Scholar]
- 32.Sarkar A, Robertson RB, Fernandez JM. Proc. Natl. Acad. Sci. U. S. A. 2004;101:12882–12886. doi: 10.1073/pnas.0403534101. [DOI] [PMC free article] [PubMed] [Google Scholar]
- 33.Micic M, Hu DH, Suh YD, Newton G, Romine M, Lu HP. Colloids Surf., B. 2004;34:205–212. doi: 10.1016/j.colsurfb.2003.10.020. [DOI] [PubMed] [Google Scholar]
- 34.Blaszczyk J, Li Y, Wu Y, Shi GB, Ji XH, Yan HG. Biochemistry. 2004;43:1469–1477. doi: 10.1021/bi036053l. [DOI] [PubMed] [Google Scholar]
- 35.Blaszczyk J, Shi GB, Li Y, Yan HG, Ji XH. Structure. 2004;12:467–475. doi: 10.1016/j.str.2004.02.003. [DOI] [PubMed] [Google Scholar]
- 36.Yang R, Lee MC, Yan HG, Duan Y. Biophys. J. 2005;89:95–106. doi: 10.1529/biophysj.105.061556. [DOI] [PMC free article] [PubMed] [Google Scholar]
- 37.Yang H, Luo GB, Karnchanaphanurach P, Louie TM, Rech I, Cova S, Xun LY, Xie XS. Science. 2003;302:262–266. doi: 10.1126/science.1086911. [DOI] [PubMed] [Google Scholar]
- 38.Yang H, Xie XS. J. Chem. Phys. 2002;117:10965–10979. [Google Scholar]
- 39.Lippitz M, Kulzer F, Orrit M. ChemPhysChem. 2005;6:770–789. doi: 10.1002/cphc.200400560. [DOI] [PubMed] [Google Scholar]
- 40.Shi J, Gafni A, Steel D. Eur. Biophys. J. 2006;35:633–645. doi: 10.1007/s00249-006-0067-5. [DOI] [PubMed] [Google Scholar]
- 41.Sakmann B, Neher E. Single Channel Recordings. Plenum Press; New York: 2001. [Google Scholar]
- 42.McQuarrie DA. Statistical Mechanics. University Science Books; Sausalito, California: 2000. [Google Scholar]
- 43.Oppenheim I, Shuler KE, Weiss GH. Stochastic processes in physics and chemistry. MIT Press; Cambridge, MA: 1977. [Google Scholar]
- 44.Majumdar ZK, Hickerson R, Noller HF, Clegg RM. J. Mol. Biol. 2005;351:1123–1145. doi: 10.1016/j.jmb.2005.06.027. [DOI] [PubMed] [Google Scholar]
- 45.Gopich IV, Szabo A. Proc. Natl. Acad. Sci. U. S. A. 2012;109:7747–7752. doi: 10.1073/pnas.1205120109. [DOI] [PMC free article] [PubMed] [Google Scholar]
- 46.Lu HP, Xie XS. Nature. 1997;385:143–146. [Google Scholar]
- 47.Lu HP, Xun LY, Xie XS. Science. 1998;282:1877–1882. doi: 10.1126/science.282.5395.1877. [DOI] [PubMed] [Google Scholar]
- 48.Gopich IV, Szabo A. J. Phys. Chem. B. 2010;114:15221–15226. doi: 10.1021/jp105359z. [DOI] [PMC free article] [PubMed] [Google Scholar]
- 49.Yang H, Xie XS. Chem. Phys. 2002;284:423–437. [Google Scholar]
- 50.Kalinin S, Valeri A, Antonik M, Felekyan S, Seidel CAM. J. Phys. Chem. B. 2010;114:7983–7995. doi: 10.1021/jp102156t. [DOI] [PubMed] [Google Scholar]
- 51.Rothwell PJ, Berger S, Kensch O, Felekyan S, Antonik M, Wohrl BM, Restle T, Goody RS, Seidel CAM. Proc. Natl. Acad. Sci. U. S. A. 2003;100:1655–1660. doi: 10.1073/pnas.0434003100. [DOI] [PMC free article] [PubMed] [Google Scholar]
- 52.Widengren J, Kudryavtsev V, Antonik M, Berger S, Gerken M, Seidel CAM. Anal. Chem. 2006;78:2039–2050. doi: 10.1021/ac0522759. [DOI] [PubMed] [Google Scholar]
- 53.Majumdar DS, Smirnova I, Kasho V, Nir E, Kong XX, Weiss S, Kaback HR. Proc. Natl. Acad. Sci. U. S. A. 2007;104:12640–12645. doi: 10.1073/pnas.0700969104. [DOI] [PMC free article] [PubMed] [Google Scholar]
- 54.Borst JW, Laptenok SP, Westphal AH, Kuehnemuth R, Hornen H, Visser NV, Kalinin S, Aker J, van Hoek A, Seidel CAM, Visser AJWG. Biophys. J. 2008;95:5399–5411. doi: 10.1529/biophysj.107.114587. [DOI] [PMC free article] [PubMed] [Google Scholar]
- 55.Chan FTS, Kaminski CF, Schierle GSK. ChemPhysChem. 2011;12:500–509. doi: 10.1002/cphc.201000833. [DOI] [PubMed] [Google Scholar]
- 56.Steinmeyer R, Harms GS. Microsc. Res. Tech. 2009;72:12–21. doi: 10.1002/jemt.20632. [DOI] [PubMed] [Google Scholar]
- 57.Myong S, Rasnik I, Joo C, Lohman TM, Ha T. Nature. 2005;437:1321–1325. doi: 10.1038/nature04049. [DOI] [PubMed] [Google Scholar]