

Abstract
OBJECTIVE
To determine whether glucose-independent differences in HbA1c exist between people of African, South Asian, and Chinese ethnicities.
RESEARCH DESIGN AND METHODS
Data from 6,701 people aged 19–78 years, without known diabetes, from Mauritius, and participating in the population-based Non-Communicable Disease Surveys of the main island and the island of Rodrigues were included. Participants were African (n = 1,219 from main island, n = 1,505 from Rodrigues), South Asian (n = 3,820), and Chinese (n = 157). Survey data included HbA1c, plasma glucose during oral glucose tolerance testing (OGTT), anthropometry, demographics, and medical and lifestyle history.
RESULTS
Mean HbA1c, after adjustment for fasting and 2-h plasma glucose and other factors known to influence HbA1c, was higher in Africans from Rodrigues (6.1%) than in South Asians (5.7%, P < 0.001), Chinese (5.7%, P < 0.001), or Africans from the main island of Mauritius (5.7%, P < 0.001). The age-standardized prevalence of diabetes among Africans from Rodrigues differed substantially depending on the diagnostic criteria used [OGTT 7.9% (95% CI 5.8–10.0); HbA1c 17.3% (15.3–19.2)]. Changing diagnostic criteria resulted in no significant change in the prevalence of diabetes within the other ethnic groups.
CONCLUSIONS
People of African ethnicity from Rodrigues have higher HbA1c than those of South Asian or African ethnicity from the main island of Mauritius for reasons not explained by plasma glucose during an OGTT or traditional factors known to affect glycemia. Further research should be directed at determining the mechanism behind this disparity and its relevance to clinical outcomes.
In 2009, the International Expert Committee recommended that HbA1c be used in the diagnosis of diabetes at a threshold level of ≥6.5% (1). This recommendation was subsequently adopted by both the American Diabetes Association and the World Health Organization (2,3). There has been much debate over the relative benefits and potential disadvantages of HbA1c over traditional plasma glucose criteria (4). As HbA1c is not a direct measure of glycemia, there is concern that levels can vary as a consequence of factors unrelated to blood glucose levels. Such factors include the rate of erythrocyte turnover and the rate of protein glycation. Existing evidence suggests the possibility that HbA1c may vary, independently of glycemia, among people of different ethnicities. Such variability has been observed in the U.S. between people of African American and Caucasian American ethnicities, as well as in Denmark between Inuits and Caucasians (5,6). However, no such studies have been conducted in developing countries, where the vast majority of people with diabetes live.
Mauritius is an island nation in the southwestern Indian Ocean with a diverse population of ~1.3 million. This population includes three of the world’s most populous ethnic groups: South Asians (Indians), Africans, and Chinese. It thus presents an ideal setting for the investigation of glucose-independent ethnic variability of HbA1c and provides a unique opportunity to undertake the first analysis of the impact of different ethnicities on the HbA1c-glucose relationship undertaken outside Europe and the U.S. This study, conducted in a large multiethnic population from Mauritius without previously diagnosed diabetes, was designed to assess 1) the effect of ethnicity on the relationship between HbA1c and plasma glucose and 2) whether ethnicity affects the degree of discordance between HbA1c and plasma glucose diagnostic criteria.
RESEARCH DESIGN AND METHODS
Cross-sectional data from 8,158 persons, aged 19–78 years, were collected during two population-based studies, the 2009 Mauritius and Rodrigues Non-Communicable Disease Surveys, which were conducted, using the same protocols, on the main island of Mauritius and on the island of Rodrigues, respectively. The surveys were conducted as part of ongoing surveillance of the prevalence of noncommunicable diseases and their complications and also to investigate risk factors associated with chronic disease. Participants resided in 22 clusters on the main island and 6 from Rodrigues, constituting representative samples. The main island of Mauritius is divided into nine districts. The number of clusters selected within each of these districts was proportional to the size of its population. Each of the clusters consisted of between 900 and 1,100 households, with the exception of two additional clusters, of ~200 households, which were selected to ensure better representation of ethnic minorities. For the Rodrigues survey, the island was divided into six geographical regions with one cluster per region. The sample size of each cluster was proportional to the population of the respective region. Within each of the 28 clusters, one in three households was selected and one adult per household was invited to participate. The response rate was 84%. In the main island survey, participants identified as being of South Asian (n = 4,696), African (n = 1,471), and Chinese (n = 187) ethnicities, whereas in Rodrigues the vast majority (98%) of participants identified as African (n = 1,743). The two surveys were approved by the ethics committee of the Ministry of Health and Quality of Life, Mauritius, and written informed consent was obtained from all participants.
Measurements
Survey data collected included demographics, medical and lifestyle history, blood pressure, anthropometry, fasting lipids, HbA1c, and both fasting (FPG) and 2-h (2hPG) plasma glucose during a 75-g oral glucose tolerance test (OGTT).
Demographic and medical information was obtained via interviewer-administrated questionnaires. Participants were asked what ethnicity they identified as and were provided with a list of the most common ethnic groups in Mauritius along with the option of answering “other.” Physical activity was assessed using the Global Physical Activity Questionnaire (7). Participants were then classified into three groups based on their activity time per week, with vigorous activity being doubly weighted: sedentary (0 min), insufficient (1–150 min) or sufficient (>150 min). For education, participants were categorized according to their highest level attained: primary (0–6 years), secondary (7–12 years) or tertiary. Alcohol intake was categorized into three groups according to the number of days per week a participant reported drinking alcohol and the number of drinks typically consumed on one such day: none, moderate (1–3 days/week and 1–3 drinks/day or ≥4 days/week and 1–2 drinks/day), or excessive (≥5 drinks on any number of days per week or ≥4 days per week, with ≥3 drinks per day). Regarding smoking status, participants were classed as current, previous, or nonsmokers.
After participants had rested for 5 min, two sitting blood pressure measurements were performed using an automated sphygmomanometer with appropriate cuff size. If the two measurements differed by >10 mmHg, a third measurement was taken. The mean pressures were calculated from the two closest readings. Survey staff measured participants’ weight in light clothing using a mechanical beam balance, height using a stadiometer, waist circumference at the midpoint between the iliac crest and the lower rib border, and hip circumference at the maximum circumference around the buttocks.
Blood samples were collected by venepuncture, with participants having fasted overnight for at least 8 h. After fasting samples were taken, a 75-g oral glucose load was administered, with subsequent sampling at 2 h. Samples for plasma glucose testing were collected in fluoride/oxalate tubes and then centrifuged and assayed onsite using a YSI 2300 STAT PLUS instrument. Samples for HbA1c testing were collected in EDTA tubes and processed at Victoria Hospital in Quatre Bornes using high-performance liquid chromatography on a Tosoh G7 automated system (Tosoh, Tokyo, Japan). The HbA1c samples were flown daily from Rodrigues to the main island and analyzed the same evening. HbA1c results are traceable to the International Federation of Clinical Chemistry and Laboratory Medicine (IFCC) calibrator set (lot no. 2008.107) and were expressed as NGSP-equivalent values, using the following conversion equation: NGSP (%) = 0.09148 × IFCC (mmol/mol) + 2.152. The Tosoh G7 method is not significantly affected by hemoglobin (Hb)S or D traits. However, some interference has been noted with HbC and -E traits (8). The prevalence of these traits in Mauritius is <1% (9). HbF has minimal interference with this method, even when levels are raised, provided that the HbF peak is correctly identified on the chromatogram (10). During the study, all chromatograms were inspected for the presence of Hb variants. Provided there was no interference present, HbA1c was reported in participants with HbS, -C, or -D along with those with elevated fetal Hb. If interference was observed on the chromatogram, the HbA1c was not reported.
Statistical methods
Data from participants who reported a previous diagnosis of diabetes or who were on medication for diabetes were excluded from all analyses (n = 1,016). In addition, data from participants who were pregnant (n = 65), who had not fasted adequately (<8 h) (n = 64), who did not identify with one of the specified ethnicities (n = 34), or on whom laboratory testing was not performed (n = 349) were also excluded. Participants were categorized on the basis of their self-reported ethnicity. Given the possibility of genetic, environmental, and lifestyle differences between the main island and the island of Rodrigues, it was decided to subclassify participants according to which island they were from. This concern only applied to people of African ethnicity, as almost the entire population from Rodrigues identified as African. Characteristics of the groups were compared using ANOVA for normally distributed data, Pearson χ2 tests for categorical data, and nonparametric K sample tests for non–normally distributed continuous data.
ANOVA was used to assess differences in crude mean HbA1c between the ethnic groups. Mean HbA1c, after adjustment for FPG and 2hPG initially (model 1) and then additionally for age, sex, BMI, systolic blood pressure, education, physical activity, smoking status, and alcohol intake (model 2), was also compared between the groups. Adjusted means were calculated using linear regression followed by calculation of marginal effects at the means of the covariates. Comparisons were performed using the adjusted Wald test. These analyses were also performed with further stratification by glucose tolerance status, defined using the World Health Organization (WHO) 2006 OGTT criteria (11). Normal glucose tolerance was defined as having FPG <6.1 mmol/L and 2hPG <7.8 mmol/L, intermediate hyperglycemia as FPG ≥ 6.1 but <7.0 mmol/L or 2hPG ≥7.8 but <11.1 mmol/L, and new diabetes as FPG ≥7.0 mmol/L or 2hPG ≥11.1 mmol/L.
For assessment of the correlation of the HbA1c criteria with the OGTT criteria between the ethnic groups, the probability of obtaining an HbA1c ≥6.5% in a person who meets the OGTT criteria for diabetes (FPG ≥7.0 mmol/L or 2hPG ≥11.1 mmol/L) and the probability of obtaining an HbA1c <6.5% in a person without diabetes according to the OGTT criteria were calculated. These probabilities have been described as the sensitivity and specificity of HbA1c, but the use of these terms assume that the OGTT identifies only true diabetes cases. To investigate whether differences in these probabilities were mediated by factors other than ethnicity, logistic regression was performed with adjustment for potential confounding factors (age, sex, BMI, systolic blood pressure, education, physical activity, and smoking status). All assumptions of the regression models were assessed, and interactions between covariates were tested for.
The age-standardized prevalence of undiagnosed diabetes within each ethnic group was calculated using either the OGTT (WHO, 2006) or HbA1c diagnostic criteria (WHO, 2011). Age standardization (using the direct method) was performed using national census data from 2008 provided by the government of Mauritius.
All analyses were performed using Stata (version 11.1; StataCorp, College Station, TX). To account for the design of the surveys, we used Stata survey commands, which calculate variance allowing for the clustered sampling method used.
RESULTS
Data from 6,701 participants without known diabetes were included in the analyses. Characteristics of the study population are described in Table 1. The mean age of participants was 43.8 years, 53.9% were women, and mean BMI was 24.9 and 26.4 kg/m2 in men and women, respectively. In general, Africans from Rodrigues had the lowest level of educational attainment, had the highest mean BMI, and were most likely to have excessive alcohol intake, while Africans on the main island were most likely to smoke. The Chinese participants were older, better educated, and less likely to smoke than all the other groups. The South Asian group had the most abstainers from alcohol and, along with the Chinese, the highest mean plasma glucose levels.
Table 1.
Participant characteristics overall and by ethnic group
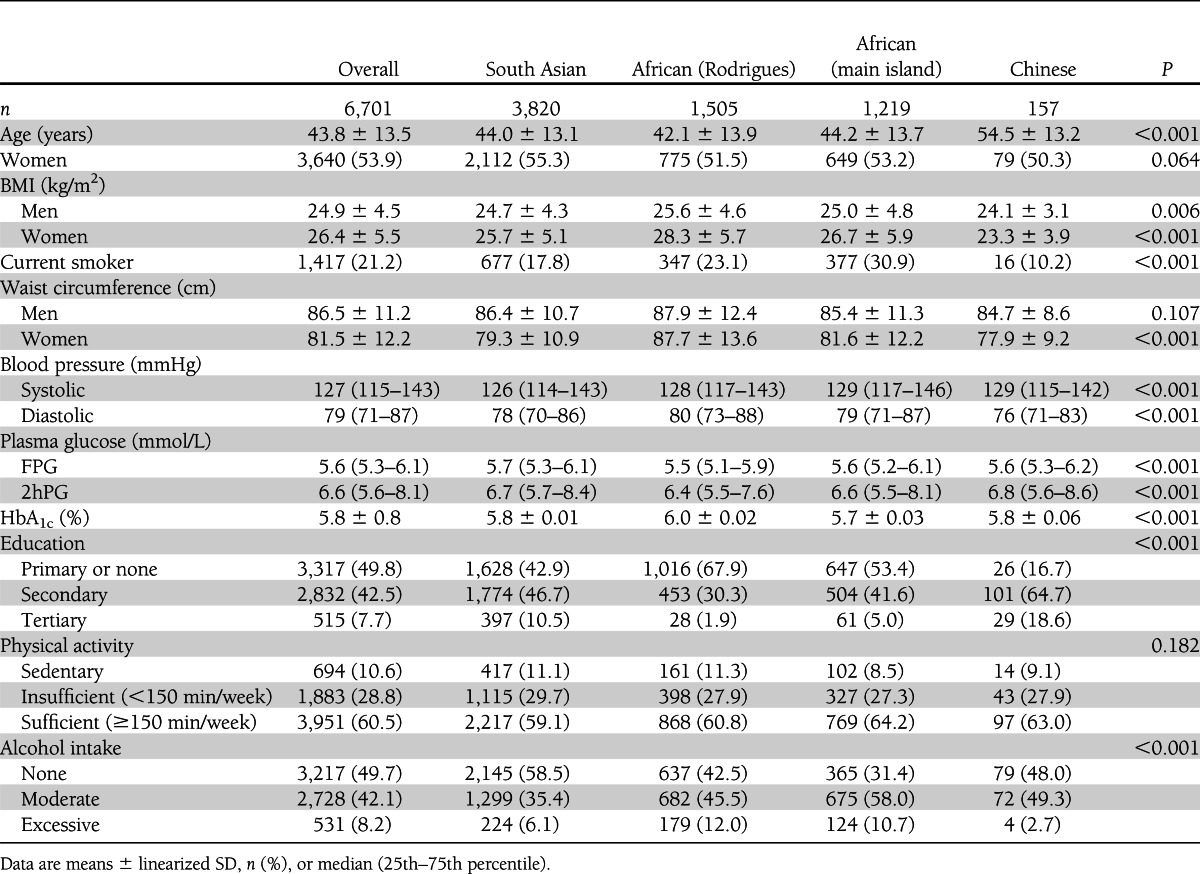
Table 2 shows that mean HbA1c was higher in Africans from Rodrigues (6.1%) than in Africans from the main island (5.7%, P < 0.001), South Asians (5.7%, P < 0.001), and Chinese (5.7%, P < 0.001) after adjustment for FPG, 2hPG, and other factors known to affect glycemia. No significant differences were seen between any of the other ethnic groups (P > 0.5 for all comparisons). Stratification by glucose tolerance status showed that differences in adjusted mean HbA1c between the ethnic groups persisted across the spectrum of glycemia (Fig. 1). The difference in adjusted mean HbA1c between Africans from Rodrigues and South Asians varied with age (P = 0.008), being greatest in those aged <40 years (0.5 percentage points) and least in those aged >60 years (0.3 percentage points). There was also an interaction with age (P = 0.014), such that the difference in adjusted mean HbA1c between Africans from the main island and those from Rodrigues was smallest among the group aged 40–49 years (0.3 percentage points) and greatest in the groups aged 50–59 and 70–79 years (0.5 percentage points).
Table 2.
HbA1c before and after adjustment by ethnicity
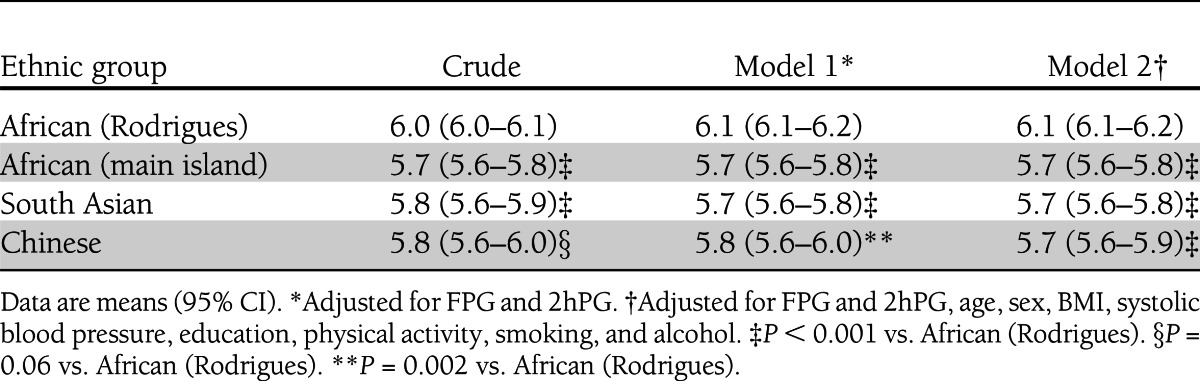
Figure 1.

Mean HbA1c by ethnicity and glucose tolerance status. IFG, impaired fasting glucose; IGT, impaired glucose tolerance. *P < 0.005 vs. African (Rodrigues). †P = 0.05 vs. African (Rodrigues). ‡P = 0.03 vs. African (main island). §Adjusted for FPG, 2hPG, age, sex, and BMI.
Among participants who met either FPG or 2hPG criteria for diabetes, the proportion who also had an HbA1c ≥6.5% was 59% (95% CI 48–70) for Africans from Rodrigues, 50% (41–59) for Africans from the main island, 59% (54–64) for South Asians, and 57% (36–76) for Chinese. However, adjustment for potential confounding factors revealed a significant difference between Africans from the main island and South Asians in the odds of a participant with glucose levels in the diagnostic range also meeting the HbA1c diagnostic criterion [odds ratio 1.6 (95% CI 1.1–2.3)]. Among participants with plasma glucose below the FPG or 2hPG diagnostic criteria, the proportion who also had an HbA1c <6.5% was significantly lower among Africans from Rodrigues [86% (84–88)] than among South Asians [95% (93–96)], Chinese [91% (88–94)], or Africans from the main island [95% (93–96)]. These differences persisted after adjustment for potential confounding factors.
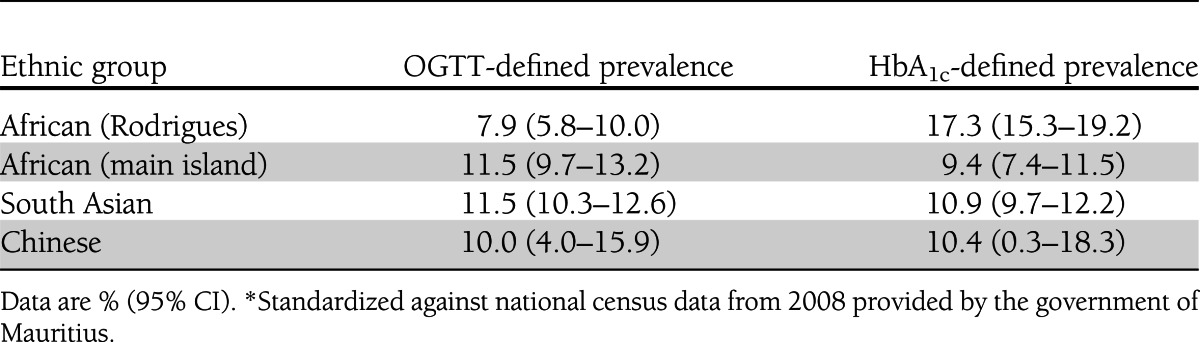
Table 3 shows that changing from the OGTT (FPG and 2hPG) to HbA1c diagnostic criteria had minimal impact on the age-standardized prevalence of undiagnosed diabetes among people of South Asian, Chinese, or African ethnicity from the main island, whereas among Africans from Rodrigues, the prevalence of diabetes was substantially higher when the HbA1c criterion was applied [17.3% (95% CI 15.3–19.2)] rather than the OGTT criteria [7.9% (5.8–10.0)].
Table 3.
Age-standardized prevalence of diabetes using either OGTT (incorporating both FPG and 2hPG) or HbA1c among persons without previously diagnosed diabetes of different ethnic groups *
CONCLUSIONS
These results from a large multiethnic cohort in Mauritius show that people of African ethnicity from Rodrigues have higher HbA1c than people of South Asian, Chinese, or African ethnicity on the main island for reasons not explained by FPG and 2hPG or traditional factors known to affect glycemia. Differences in HbA1c were present among participants with normal glucose tolerance, those with intermediate hyperglycemia, and those with newly diagnosed diabetes. Additionally, there was ethnicity-related variability in the correlation between HbA1c and plasma glucose diagnostic criteria for diabetes. Despite there being almost no difference in the prevalence of diabetes calculated using the HbA1c criterion compared with the OGTT criteria among the other ethnic groups, among Africans from Rodrigues the prevalence was dramatically higher when measured using HbA1c, thus suggesting that ethnic differences in the glucose-HbA1c relationship may be sufficient to alter the epidemiological landscape of diabetes considerably.
No differences in the HbA1c-glucose relationship were found between South Asians, Chinese, and Africans from the main island of Mauritius. Nevertheless, it is likely that the findings relating to Africans from Rodrigues may apply to some (though not all) African populations elsewhere. In the U.S., people of African ethnicity have already been shown to have higher HbA1c than people of other ethnicities independently of glucose (5,12). The African population in Mauritius is believed to have largely originated from Madagascar, Mozambique, and other East African nations, although some people were also brought from West Africa as slaves (13).
The relationship between HbA1c and plasma glucose in people without known diabetes has not previously been explored between the ethnic groups investigated in this study. However, the magnitude of the differences observed (0.3–0.4 percentage points) is not dissimilar to that seen between groups in other studies. Ziemer et al. (5) found that on average, black Americans had a 0.29 percentage point higher HbA1c than white Americans in NHANES III (P < 0.001) after adjustment for plasma glucose and other factors known to be associated with HbA1c. Another recent study of subjects without diabetes found HbA1c to be on average 0.22 percentage points higher in black compared with white Americans (14). This analysis also adjusted for plasma glucose and several other factors, including red cell parameters such as Hb and hematocrit.
There are essentially two explanations for the existence of ethnic differences in HbA1c. First, it is possible that HbA1c detects real patterns of chronic glycemia that are not accurately reflected in results from the OGTT. In a substudy of the Atherosclerosis Risk in Communities (ARIC) study, Selvin et al. (15) demonstrated that not only HbA1c but also other measures of chronic glycemia, including glycated albumin and fructosamine, were relatively elevated in black Americans. Their finding supports the notion that variation in chronic glycemia explains the existence of differences in HbA1c between black and white Americans. An additional analysis of the ARIC cohort found that the relative contribution of metabolic and demographic factors to HbA1c among black Americans far outweighed that of genetic ancestry (16). This again supports the theory that ethnic differences in HbA1c most likely relate to differences in chronic glycemia.
The second possible explanation for ethnic differences in the HbA1c-glucose relationship is that factors unrelated to glycemia, such as the rate of erythrocyte turnover or the rate of protein glycation, also vary with ethnicity. Although underpowered to investigate the relationship, the A1c-Derived Average Glucose (ADAG) study showed a trend (P < 0.07) toward higher HbA1c in people of African background, independent of chronic glycemia, which was measured using a combination of continuous glucose monitoring and frequent capillary glucose testing (17). This would suggest that factors other than chronic glycemia might be involved. Numerous mechanisms could theoretically underlie ethnic variability in HbA1c, although there are currently none proven. HbA1c is affected by changes in either erythropoiesis or hemolysis, with levels having been shown to vary in a number of disease states and with some therapeutic interventions (18). For example, the prevalence of thalassemias may vary or there may be differences in iron metabolism between the ethnic groups (19). The prevalence of the β-thalassaemia trait on the main island of Mauritius has been reported as 4.0% among Indians and 2.2% among Africans (9). To our knowledge, no information on the prevalence of Hb disorders in Rodrigues has been published. Iron deficiency has been associated with elevated HbA1c in numerous studies (20–22). Furthermore, even in healthy individuals heterogeneity has been observed in both the average erythrocyte life span and the glucose concentration gradient across the erythrocyte membrane (23,24). Genetics are also important in determining an individual’s HbA1c. It has been estimated that 40–60% of the population variance in HbA1c can be explained by heritability (25,26). Therefore, it is quite plausible that one or a combination of these factors could provide a mechanism for ethnic differences in HbA1c.
The strengths of this study include its large, population-based, multiethnic sample and the fact that the OGTT was performed on so many individuals. Furthermore, there was extensive assessment of potential confounding factors, and laboratory measures were performed uniformly, including the use of the same standardized HbA1c assay.
One might question the existence of ethnic differences between two groups of people reporting to be of African heritage. It is worthwhile to note that Table 1 shows BMI to be more similar between main island African and South Asian women than it is between African women from Rodrigues and African women from the main island. This, along with other differences noted in Table 1, suggests that in fact these are two distinct populations. The Rodrigues survey was conducted several months after the Mauritius survey, but the laboratory quality-assurance data showed no evidence that assay drift could explain the observed differences in HbA1c. Seasonal variation in HbA1c has previously been hypothesized, with the limited evidence available indicating that levels are higher at cooler times of year (27). The Rodrigues survey was conducted in December (i.e., summer), thus, if anything, suggesting that the differences observed in the current study were an underestimation. Finally, the requirement to transport samples daily from Rodrigues to the laboratory in Mauritius would not be expected to affect results, as assays were conducted on the day of collection, and there is good evidence of stability of HbA1c for at least 24 h of storage across a range of temperatures (28).
There are essentially two key possible explanations for differences between the African populations on the island of Rodrigues and the main island of Mauritius. First, given the diverse population on the main island, the likelihood of genetic admixture between the ethnic groups is high, and this might have diluted ethnic differences. On the contrary, the population on Rodrigues is almost entirely of African descent. The second possibility is that the two groups originate from different populations. This is quite feasible given the complex immigration history of Mauritius, with French and British colonialists bringing in slaves from various parts of Africa. Genetic studies have shown that African peoples possess the greatest amount of within-population genetic diversity of any of the major human population groups (29). Thus, it should not be surprising to find differences between two geographically separated groups of Africans.
Some limitations of the study include the small number of Chinese participants, which may have restricted the study’s ability to accurately detect differences between this group and others. Additionally, glycemic tests were only performed on one occasion. It would also have been helpful to have data on red cell parameters and the prevalence of hemoglobinopathies in each ethnic group, as this would have aided interpretation of the findings. Finally, it is often postulated that prospective studies looking for differences in long-term clinical outcomes would be superior to cross-sectional studies, such as this one, in assessing the significance of ethnic differences in the relationship between HbA1c and plasma glucose. However, to date, large studies, such as DETECT-2, which pooled data from >44,000 individuals of diverse ethnic backgrounds, have failed to show FPG, 2hPG, or HbA1c to be clearly superior in their cross-sectional associations with clinical outcomes, let alone to show significant ethnic differences in their predictive capabilities (30). A prospective study attempting to show ethnic differences in the capacity of the three measures of glycemia to predict outcomes would likely need to be considerably bigger than the DETECT-2 cohort. Therefore, large cross-sectional studies like this one are essential in assessing the impact of nonglycemic factors on HbA1c.
In conclusion, this study found that people of African ethnicity from the island of Rodrigues have higher HbA1c than those of South Asian, Chinese, or African ethnicity from the main island of Mauritius for reasons not explained by OGTT results or traditional factors known to affect glycemia. These findings do not argue against or in favor of using HbA1c to diagnose diabetes, as such a determination should be based on the ability of the respective diagnostic categories to predict clinical outcomes. Rather, the findings suggest that the relationship between HbA1c and OGTT results is not the same in all ethnic groups. The mechanism behind this difference and its relevance to clinical outcomes should be investigated in future studies in order to clarify the validity of using HbA1c to diagnose diabetes in diverse populations.
Acknowledgments
The Mauritius and Rodrigues Non-Communicable Disease Surveys were conducted and funded by the Ministry of Health and Quality of Life, Mauritius, in collaboration with the Baker IDI Heart and Diabetes Institute. This study was supported in part by the Victorian government’s Operational Infrastructure Support Program. J.E.S. is supported by a National Health and Medical Research Council Senior Research Fellowship.
No potential conflicts of interest relevant to this article were reported.
M.J.L.H. researched data and wrote the manuscript. D.J.M. and J.E.S. researched data, reviewed and edited the manuscript, and contributed to the design and implementation of the original surveys. P.Z.Z., S.S., N.J., V.P., J.L., J.T., S.K., and K.G.M.M.A. contributed to the design and implementation of the original surveys and reviewed and edited the manuscript. M.J.L.H., D.J.M., and J.E.S. are the guarantors of this work and, as such, had full access to all the data in the study and take responsibility for the integrity of the data and the accuracy of the data analysis.
Some data from this study were presented at the 2011 International Diabetes Federation World Diabetes Congress.
References
- 1.International Expert Committee International Expert Committee report on the role of the A1C assay in the diagnosis of diabetes. Diabetes Care 2009;32:1327–1334 [DOI] [PMC free article] [PubMed] [Google Scholar]
- 2.Executive summary: Standards of medical care in diabetes—2010. Diabetes Care 2010;33(Suppl. 1):S4–S10 [DOI] [PMC free article] [PubMed] [Google Scholar]
- 3.World Health Organization Use of Glycated Haemoglobin (HbA1c) in the Diagnosis of Diabetes Mellitus. Geneva, World Health Organization, 2011 [Google Scholar]
- 4.Hare MJ, Shaw JE, Zimmet PZ. Current controversies in the use of haemoglobin A1c. J Intern Med 2012;271:227–236 [DOI] [PubMed] [Google Scholar]
- 5.Ziemer DC, Kolm P, Weintraub WS, et al. Glucose-independent, black-white differences in hemoglobin A1c levels: a cross-sectional analysis of 2 studies. Ann Intern Med 2010;152:770–777 [DOI] [PubMed] [Google Scholar]
- 6.Jørgensen ME, Bjerregaard P, Borch-Johnsen K, Witte D. New diagnostic criteria for diabetes: is the change from glucose to HbA1c possible in all populations? J Clin Endocrinol Metab 2010;95:E333–E336 [DOI] [PubMed] [Google Scholar]
- 7.Bull FC, Maslin TS, Armstrong T. Global physical activity questionnaire (GPAQ): nine country reliability and validity study. J Phys Act Health 2009;6:790–804 [DOI] [PubMed] [Google Scholar]
- 8.NGSP. Factors that interfere with HbA1c test results. Available from http://www.ngsp.org/factors.asp Accessed 11 September 2012
- 9.Kotea N, DuCrocq R, Surrun SK, et al. Abnormal hemoglobins in Mauritius Island. Am J Hematol 1995;48:293–295 [DOI] [PubMed] [Google Scholar]
- 10.Rohlfing CL, Connolly SM, England JD, et al. The effect of elevated fetal hemoglobin on hemoglobin A1c results: five common hemoglobin A1c methods compared with the IFCC reference method. Am J Clin Pathol 2008;129:811–814 [DOI] [PubMed] [Google Scholar]
- 11.World Health Organization Definition and Diagnosis of Diabetes Mellitus and Intermediate Hyperglycemia: Report of a WHO/IDF Consultation. Geneva, World Health Organization, 2006 [Google Scholar]
- 12.Davidson MB, Schriger DL. Effect of age and race/ethnicity on HbA1c levels in people without known diabetes mellitus: implications for the diagnosis of diabetes. Diabetes Res Clin Pract 2010;87:415–421 [DOI] [PubMed] [Google Scholar]
- 13.Allen RB. Slaves, Freedmen, and Indentured Laborers in Colonial Mauritius. Cambridge, U.K., Cambridge University Press, 1999 [Google Scholar]
- 14.Chapp-Jumbo E, Edeoga C, Wan J, Dagogo-Jack S, Pathobiology of Prediabetes in a Biracial Cohort (POP-ABC) Research Group Ethnic disparity in hemoglobin A1c levels among normoglycemic offspring of parents with type 2 diabetes mellitus. Endocr Pract 2012;18:356–362 [DOI] [PubMed] [Google Scholar]
- 15.Selvin E, Steffes MW, Ballantyne CM, Hoogeveen RC, Coresh J, Brancati FL. Racial differences in glycemic markers: a cross-sectional analysis of community-based data. Ann Intern Med 2011;154:303–309 [DOI] [PMC free article] [PubMed] [Google Scholar]
- 16.Maruthur NM, Kao WHL, Clark JM, et al. Does genetic ancestry explain higher values of glycated hemoglobin in African Americans? Diabetes 2011;60:2434–2438 [DOI] [PMC free article] [PubMed] [Google Scholar]
- 17.Nathan DM, Kuenen J, Borg R, Zheng H, Schoenfeld D, Heine RJ, A1c-Derived Average Glucose Study Group Translating the A1C assay into estimated average glucose values. Diabetes Care 2008;31:1473–1478 [DOI] [PMC free article] [PubMed] [Google Scholar]
- 18.Gallagher EJ, Le Roith D, Bloomgarden Z. Review of hemoglobin A(1c) in the management of diabetes. J Diabetes 2009;1:9–17 [DOI] [PubMed] [Google Scholar]
- 19.Modell B, Darlison M. Global epidemiology of haemoglobin disorders and derived service indicators. Bull World Health Organ 2008;86:480–487 [DOI] [PMC free article] [PubMed] [Google Scholar]
- 20.Hashimoto K, Noguchi S, Morimoto Y, et al. A1C but not serum glycated albumin is elevated in late pregnancy owing to iron deficiency. Diabetes Care 2008;31:1945–1948 [DOI] [PMC free article] [PubMed] [Google Scholar]
- 21.Coban E, Ozdogan M, Timuragaoglu A. Effect of iron deficiency anemia on the levels of hemoglobin A1c in nondiabetic patients. Acta Haematol 2004;112:126–128 [DOI] [PubMed] [Google Scholar]
- 22.Kim C, Bullard KM, Herman WH, Beckles GL. Association between iron deficiency and A1C Levels among adults without diabetes in the National Health and Nutrition Examination Survey, 1999-2006. Diabetes Care 2010;33:780–785 [DOI] [PMC free article] [PubMed] [Google Scholar]
- 23.Cohen RM, Franco RS, Khera PK, et al. Red cell life span heterogeneity in hematologically normal people is sufficient to alter HbA1c. Blood 2008;112:4284–4291 [DOI] [PMC free article] [PubMed] [Google Scholar]
- 24.Khera PK, Joiner CH, Carruthers A, et al. Evidence for interindividual heterogeneity in the glucose gradient across the human red blood cell membrane and its relationship to hemoglobin glycation. Diabetes 2008;57:2445–2452 [DOI] [PMC free article] [PubMed] [Google Scholar]
- 25.Snieder H, Sawtell PA, Ross L, Walker J, Spector TD, Leslie RD. HbA(1c) levels are genetically determined even in type 1 diabetes: evidence from healthy and diabetic twins. Diabetes 2001;50:2858–2863 [DOI] [PubMed] [Google Scholar]
- 26.Meigs JB, Panhuysen CI, Myers RH, Wilson PW, Cupples LA. A genome-wide scan for loci linked to plasma levels of glucose and HbA(1c) in a community-based sample of Caucasian pedigrees: The Framingham Offspring Study. Diabetes 2002;51:833–840 [DOI] [PubMed] [Google Scholar]
- 27.Higgins T, Saw S, Sikaris K, et al. Seasonal variation in hemoglobin A1c: is it the same in both hemispheres? J Diabetes Sci Tech 2009;3:668–671 [DOI] [PMC free article] [PubMed] [Google Scholar]
- 28.Rohlfing CL, Hanson S, Tennill AL, Little RR. Effects of whole blood storage on hemoglobin a1c measurements with five current assay methods. Diabetes Technol Ther 2012;14:271–275 [DOI] [PMC free article] [PubMed] [Google Scholar]
- 29.Tishkoff SA, Reed FA, Friedlaender FR, et al. The genetic structure and history of Africans and African Americans. Science 2009;324:1035–1044 [DOI] [PMC free article] [PubMed] [Google Scholar]
- 30.Colagiuri S, Lee CM, Wong TY, Balkau B, Shaw JE, Borch-Johnsen K, DETECT-2 Collaboration Writing Group Glycemic thresholds for diabetes-specific retinopathy: implications for diagnostic criteria for diabetes. Diabetes Care 2011;34:145–150 [DOI] [PMC free article] [PubMed] [Google Scholar]