

Abstract
Combining atomic force microscopy and fluorescence resonance energy transfer spectroscopy (AFM-FRET), we have developed a single-molecule AFM-FRET nanoscopy approach capable of effectively pinpointing and mechanically manipulating a targeted dye-labeled single protein in a large sampling area, and simultaneously monitoring the conformational changes of the targeted protein by recording single-molecule FRET time trajectories. We have further demonstrated an application of using this nanoscopy on manipulation of single-molecule protein conformation and simultaneous single-molecule FRET measurement of a Cy3–Cy5 labeled kinase enzyme, HPPK (6-hydroxymethyl-7,8-dihydropterin pyrophosphokinase). By analyzing time-resolved FRET trajectories and correlated AFM force pulling curves of the targeted single-molecule enzyme, we are able to observe the protein conformational changes of a specific coordination by AFM mechanic force pulling.
Keywords: single-molecule AFM-FRET nanoscopy, enzyme, force pulling manipulation, conformational changes
Protein conformations play crucial roles in protein functions.1–5 The new paradigm of the protein structure-function relationship is that the dynamics of protein structural fluctuations play critical roles in protein functions.6–9 For example, protein functions in enzymatic catalysis and protein-protein interactions involve protein conformational fluctuations and folding-binding cooperative interactions.10–13 An enzyme can have different activities with different conformations,14–16 and conformational changes can significantly change the affinity and selectivity of protein interactions, which in turn often contribute to dramatic changes in protein functions.17–19 Thus, manipulating protein conformations can be effective for changing, enhancing, or even creating protein functions. It has been theoretically suggested that an oscillating force applied to an enzyme at a comparable frequency of enzymatic reaction turnover rate changes the enzymatic reaction activities due to force modification of the reaction pathway, potential surface, and enzymatic reaction intermediate state energy.20, 21 In recent years, experimental works have demonstrated that external mechanical force can change protein activities,22, 23 accordingly, real-time measurements of protein conformational dynamics with a combined external force to manipulate and even control protein structures are a promising approach for protein structure-function studies.
Single-molecule approaches are proved to be powerful and informative in characterizing protein functions, conformations, and activities, which are beyond the conventional ensemble-averaged measurements.24–26 In another respect, AFM and correlated single-molecule force spectroscopy has been proved to be specified for studying protein conformations and activities under physiological conditions.27, 28 Thus, a combination of correlated single molecule spectroscopy with atomic force microscopy is ideal for obtainning the identified structural information or direct observation of the effect of external mechanical perturbation on the protein and related enzymatic activity in real time. Progresses have been achieved in combining the single-molecule spectroscopy measurements and simultaneous AFM manipulations.29–33 For example, Fernandez and co-workers introduced a combined AFM-TIRF microscopy, and used fluorescence labeled cantilever to pull and unfold tethered polyubiquitin between sample surface and cantilever tip.30 This combination provides a method to monitor fluorescently labeled molecule moving vertically along z-axis and potentially can be used to tracking the activity of single molecules simultaneously. Gaub and co-workers also used an integrated AFM-TIRF to read out the influence on the enzymatic activity by AFM induced periodic stretching and relaxation of enzymatic conformation through simultaneous fluorescence imaging, and they reported that relaxation from the force-induced enzyme conformation lead to higher catalytic activity after the external stretching force on enzymes were released.29 The advantage of the integrated AFM-TIRF microscopy is that collecting optical signals is relatively easy due to the large imaging area of TIRF. However, there also exists an apparent disadvantage in the correlated single-molecule force manipulation and fluorescence total reflection imaging microscopy measurements, which is that the signals from optical measurement may not come from the target molecule that is manipulated by AFM. For example, in this AFM-TIRF study of the influence on the enzymatic activity by AFM induced periodic stretching and relaxation of enzymatic conformation through simultaneous fluorescence imaging experiment, the enzyme molecules themselves cannot be directly labeled for probing the conformational changes or monitoring enzymatic reaction motions under high enzyme concentration within the imaging sample area, although only the fluorogenic product molecules can be measured. Therefore, many of the time-resolved and polarization resolved single-molecule spectroscopy measurements cannot be applied. Furthermore, the measured enzymatic reaction product is probably not the specific one from the exact target enzyme molecule perturbed by the AFM tip.
Kodama and co-workers have made an advancement of using a confocal laser scanning microscope correlated with AFM to probe the relationship between protein structure and function by observing the fluorescence change of green fluorescent protein when a compression or extension force is applied to the protein.31 However, this measurement is not in single-molecule level, about 30 protein molecules under the microbead are attached to ATM tip. In fact, there is an apparent conflict of preference and intrinsic technical dilemma between high concentration requirement of sample molecules for AFM manipulation and low concentration requirement for single molecule optical spectroscopy. Single-molecule spectroscopy requires that the fluorescent probe molecules are distributed at low concentration 10−9 to 10−10 M or averagely one target molecule per μm2 area. In contrast, conventional AFM force pulling experiments require a high concentration, near monolayer, of proteins on the sampling surface as an AFM tip cannot specifically pinpoint a targeted protein molecule in a sample area of larger than one μm2.
There are rich technical approaches of single-molecule spectroscopy, including confocal imaging, TIRF, single molecule FRET, and tip-enhanced near-field spectroscopy and imaging, etc29–33 that have been combined with the AFM correlated microscopy, but to our knowledge, there are no such approaches that have reached to single-molecule level. There is a simple and critical reason that the technical bottle neck that has been prohibiting various above mentioned single-molecule microscopy and spectroscopy approaches to be combined with the AFM force manipulation analysis. The reason is that for these types of single-molecule spectroscopic approaches to be applied, the single-molecule protein has to be fluorescent by intrinsic fluorescence or by dye-probe labeling, and the fluorescence molecule can only be a single one distributed in a 10−10 M concentration within a large sample area, that is, about one molecule in each μm2. The reality of such a diluted sample requires that the AFM tip is capable of pinpointing the individual molecule in a sample area that is much larger than typical AFM single-molecule imaging sampling area. Nevertheless, a direct correlation between measuring single-molecule activity and specifically-manipulating conformational changes has not been achieved yet. In this article, we report our new technical approach of an AFM-FRET nanoscopy capable of simultaneous measurements of single-molecule force spectroscopy and FRET spectroscopy for a targeted single protein molecule. By recording and analyzing single-molecule FRET time trajectories of a Cy3–Cy5 labeled kinase protein and correlated force spectroscopy on the same molecule, we have demonstrated the experimental approach of simultaneous single-molecule spectroscopic measurements of protein conformational changes under AFM tip manipulations. Our AFM-FRET nanoscopy approach enables us to study the relation between protein structure and function at a pinpointing single-molecule level.
In our experiments, HPPK (6-hydroxymethyl-7,8-dihydropterin pyrophosphokinase), a 35KDa 158-residue monomer kinase enzyme protein,34, 35 was studied. HPPK catalyzes the pyrophosphorylation reaction that leads the conversion of 6-hydroxymethyl-7,8-dihydropterin (HP) to 6-hydroxymethyl-7,8-dihydropterin pyrophosphate (HPPP) in the presence of ATP during the folate biosynthesis pathway in bacterial cells. There are three flexible loops of HPPK involved in the enzymatic catalysis reaction (Figure 1).5, 34 Among them, loop 3 undergoes dramatic open-close conformational changes in each catalytic cycle, correlating with substrates (ATP and HP) binding. To probe the single-molecule conformational change of protein under the AFM force pulling perturbation, the enzyme, HPPK was labeled with Cy3/Cy5 to the amino acid residue 88 on loop 3 and residue 142 on protein core close to the enzymatic active site of the enzyme,35 respectively (Figure 1A). To apply mechanical force to perturb the conformation of single enzyme molecule using AFM tip, we coupled HPPK molecules between a glass cover-slip and a “handle” function group (biotin and streptavidin) for AFM tip through amines groups on the protein (Figure 2A).
Figure 1.

(A) Crystal Structure of HPPK. The green spirals represent α helices and the blue arrows represent β strands. The loops are shown by the red pipes. Amino acid residue 88 and 142 has been labeled with FRET dye pair Cy3 and Cy5, respectively. (B) HPPK catalyzed pyrophosphorylation transfer two phosphor groups from ATP to HP.
Figure 2.

(A) Single-molecule AFM-FRET ultra nanoscopy, the zoomed panel in the left presents schematic diagram of one FRET dye-pair (donor-acceptor: Cy3–Cy5) labeled HPPK molecule tethered between a glass cover-slip surface and a handle (biotin group plus streptavidin), and another biotin group is modified on AFM tip. (B) Single-molecule fluorescence photon counting images of the donor (Cy3, left) and accepter (Cy5, right). Each feature is from a single HPPK enzyme labeled with Cy3–Cy5 FRET dyes.
RESULTS AND DISCUSSION
In our single-molecule AFM-FRET nanoscopy, time-resolved FRET trajectories and correlated AFM force pulling curves of the targeted single HPPK enzyme are simultaneously recorded during the whole pulling approach-retract cycle. Figure 3 presents the typical data recorded from an effective AFM pulling event, showing the FRET donor-acceptor intensity trajectories (Figure 3A, 3B), the correlated FRET efficiency trajectory (Figure 3C), and the correlated AFM force curve (Figure 3D). In a single AFM tip approach-retract cycle, AFM tip travels about 600 nm down and 600 nm up, total route is about 1200 nm within 2 seconds. There is a period about 0.5 second when the fluorescence intensity is three times higher than the flat area in the trajectory. Thus, the total traveling distance of back and forth in the field that enhanced fluorescence intensity is 300 nm, so the distance between AFM tip and sample is estimated as zero to 150 nm. The enhancement of the fluorescence intensity is due to a micro-mirror effect, that is, the AFM tip serves as a mirror reflecting the optical signal down to the microscopic objective resulting in a higher single collection efficiency. The micro-mirror effect increases or decreases following the AFM tip gets close or moves away from the laser focus spot on the sample surface in a correlated confocal single-molecule spectroscopic imaging measurement. The micro-mirror effect disappeares when the tip is retracted back from the surface beyond 150 nm range.
Figure 3.

(A) A typical FRET time trajectory of donor (green) and acceptor (red) associated with one single-molecule AFM-FRET force pulling event. (B) Zoom-in intensity trajectory of donor and acceptor from (A), the highlighted intensity change is correlated to one pulling event occurred in 0.04s. (C) FRET efficiency time trajectory of one single-molecule AFM-FRET pulling event, in the whole process of AFM tip travelling route from approaching the protein from far away to moving away out of the micro-mirror effect distance range, three efficiency levels are recorded and identified. The error bar shows the ±2SD (standard deviation) indicating ≥ 95% precision of identification of the data points within the range. (D) The correlated force curve, the curve shows the extension length of 24 nm within a period of 0.04 s.
Figure 3A–3C present a detection of FRET intensity, efficiency changes as well as simultaneous AFM force spectrum when a pinpoint specific force pulling event occurs (Figure 3D). The changes of FRET efficiency (EFRET) reflect the changes of the donor-acceptor distance associated with the protein unfolding by AFM force pulling.36, 37 Figure 3C shows a typical EFRET time trajectory of single-molecule HPPK under an AFM tip perturbation. In the whole process of AFM tip travelling route of approaching the protein from far away and then moving away out of the micro-mirror effect distance range. To distinguish a productive force pulling event from a non-productive pulling event involving essentially similar AFM tip approaching-withdrawing movements, we analyzed the error bar of standard diviasion on the correlated EFRET signal measured under the tip approaching-withdrawing movements that occurred around a productive pulling event. The mean of the EFRET when the tip is far from the surface (no mirror effect) is marked with 1st level, Similarly, the mean of the EFRET when the tip is close to the surface (with a mirror effect) is marked 2nd level (Figure 3C). It is statistically identifiable of that the EFRET signal, marked as 3rd level, correlated with a productive force pulling event. Therefore, as the tip approaching the single protein but not close enough to reach the micro-mirror effective distance (~150 nm) and as it moving far away beyond the 150 nm-range, the EFRET presents the first level that is the normal level without perturbation of the micro-mirror effect. As tip reaches the range of micro-mirror effect, EFRET shifts to the second level. In this measurement, there are two factors that may affect the EFRET: First is mirror effect (both donor and acceptor fluorescence intensities increase when tip reflects optical signal down to the microscopic objective). In this case, the increased efficiency may be not identical along the whole wavelength range, leading to different extends of efficiency changes in both channels, Second is plasma (plasma is generated from Au coated AFM tip excited by laser). In this case, the intensity of plasma is also probably not uniform in different wavelengths, that is, it may have different intensity in different wavelength range. The third level EFRET only lasts 0.04 s, which corresponds to the rapid extension process in which the protein is stretched by AFM tip until the connection between AFM tip and the protein ruptures. In the third level-0.04 s period, EFRET suddenly switches from the second level to the third one and then switches back, those changes reflect the protein conformational changes pulled by AFM tip. Figure 3D shows the force curve from the simultaneous AFM measurement that is correlated to the FRET trajectory (Figure 3A, 3B, and 3C. The AFM force pulling curve (Figure 3D) shows two peaks and the total extension length of 24 nm. In this typical force curve, the extension length of 24 nm takes about 0.04 s to run across, which is corresponding to the 0.04 s extension period in the corresponding FRET trajectory (highlighted in Figure 3A, 3B and 3C).
The combination of force spectrum and correlated FRET recording enables us to identify the exact pulling site on single HPPK molecule. Figure 4A, the statistical result of rupture distance, shows the primary distribution within a range of 20–40 nm, and the mean extension length about 24–28 nm. In this experiment, the amine groups on lysine residues were used to link the protein molecule to the cover-slip surface and to the biotin handler for AFM tip manipulation. For Cy3–Cy5 labeled (88c,142c) HPPK molecule, there are still five lysine residues (23, 85, 119, 154, 157) available. Therefore, there are a number of configurations associated with different linking residues for the single-molecule force pulling measurements, although there are only four possible unfold configurations (between residue 23 and 85, or between residue 85 and 154, or between 85 and 157, or between 23 and 119 (see the Supporting Information S1 for details) that gives the possible extension length ranging from 20 nm to 40 nm (Figure 4A). Among these possible unfold configurations, the most possible linker is at the residue 85. According to the literature, residue 85 is on loop 3, one of the important catalytic flexible loops of HPPK, correlating with substrate ATP binding, undergoes the most dramatic open-close conformational changes in each catalytic cycle. Therefore, the force perturbation at residue 85 on loop 3 provides a most likely possibility of perturbing the enzyme-substrate binding and accordingly perturbing the enzymatic catalysis activity. Figure 4B, the histogram of the protein rupture force distribution shows two peaks, 16–18 pN and 50–52 pN, the most possible rupture forces are in the range of 16–18 pN. Our result is essentially consistent with the reported 10–60 pN rupture force values in single-molecule protein pulling, which is typically much smaller than the result of about a few hundreds pN in the rapture force measured in polymer force pulling experiments. We attribute that, in our single-molecule force pulling experiment, the rapture force is due to unfolding single loop, segment or single domain that contain one or several hydrogen bonding and other non-covalent chemical interactions. 38 However, we note that there is a significant difference between the rapture force we reported here and the typical protein unfolding rupture forces reported in the previous literature: a rapture force in protein polymer protein pulling 39, 40 is the force of unfolding a whole protein within a protein polymer, i.e., the rupture force includes not only the force of rupturing the multiple hydrogen bonds in a protein but also the force of rupturing all the associated hydrophobic forces and related chemical bonds that hold the whole protein in its fold state. Furthermore, the single enzyme domain reupture forces observed in our experiments are in a comparable scale of other reported single-molecule protein domain rupture forces.28, 41
Figure 4.
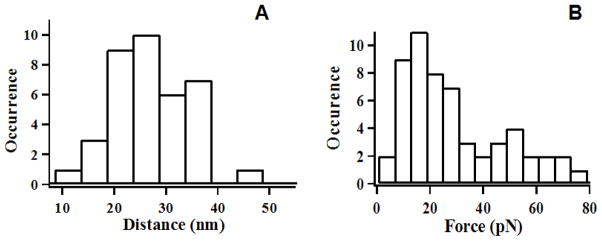
(A) Histogram of extension length distribution of AFM-FRET force unfolding single-molecule proteins. The primary extension length within a range of 20–40 nm, and the mean extension length is about 24–28 nm. (B) Histogram of protein ruptures force distribution. The distribution shows two peaks, and the most probable rupture forces are 16–18 pN and 50–52 pN.
To further prove our attribution of the possible unfold configurations between lysine residues in our single-molecule pulling experiment, we did a control experiment of HPPK mutant (142C, Figure 5E). In one end of linking, we chemically tether the HPPK molecule to glass cover-slip surface at a specific amino acid residue position 142 by mutation (see Supporting Information S2 for details). For the other end, in order to be linked by chemical reaction EZ-linker (NHS-SS-Biotin), the –NH2 group on HPPK amino acid side chains must be from one of the lysine residues except site 142, which are site 23, 85, 119, 154 and 157. However, the configuration between 142 and 154 or 157 are too close to be the origins of the measured force pulling curves, so there are actually only three possible unfolding configurations, and they are between amine acid residues 142 and amine acid residue 23, 85, and 119, respectively. Assuming the average distance is 3.8 Ǻ in each amine acid residue, the overall distance of the force pulling curves are about 45.2 nm, 21.7 nm, and 8.7 nm, respectively.
Figure 5.
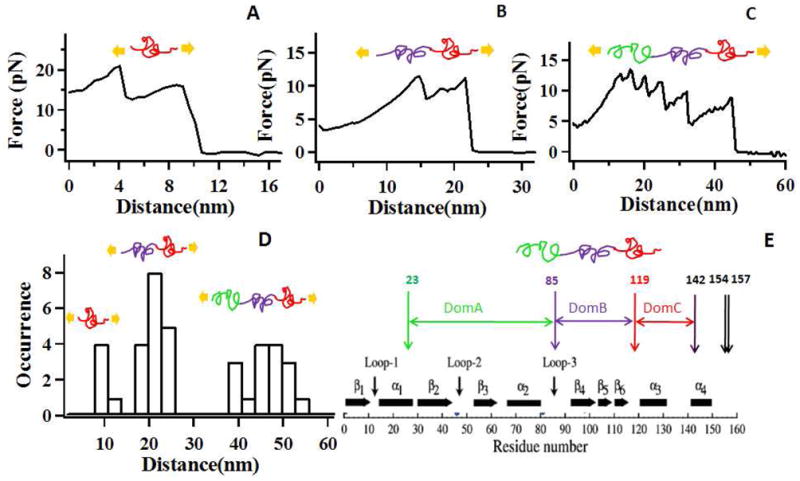
(A–C) Three types of single-molecule force pulling curves of HPPK, as HPPK was chemically linked to a glass coverslip at residue 142, and AFM tip pulling occurs at the possible lysine residue site 119, 85, and 23. In the insets above the force curves, three proposed domains are colored (green for DomA, purple for DomB and red for DomC) and depicted. (A) The unfolding force curve of DomC (red), which corresponds to the rupture distance 9 nm. (B) The unfolding force curves of DomB (purple) and DomC (red), corresponding to the rupture distance 22 nm. (C) The unfolding force curve of DoA, DoB and DoC, and the rupture distance is 45 nm. (D) Histogram of protein rupture distance distribution. The distribution of the rupture distances shows three peaks, at about 9 nm (DomC), 22 nm (DomB and DomC), and 45 nm (DomA, DomB and Dom C). (E) The structure of the HPPK mutant (the site of lysines and cysteine are illustrated). Amino acid residue 142 was mutated to cysteine for specific site tethering of HPPK on the glass cover-slip.
The experimental results (Figure 5), obtained in tris-buffer plus MgCl2 with the present of enzyme prohibitor (AMPCPP, αβ-Methyleneadenosine 5′-triphosphate), show three typical force curves. These force curves consist of saw teeth shaped peaks. These peaks are the results of unfolding single HPPK molecules. The distances to rupture the protein from the force curves are 9±2 nm, 22±3 nm, and 46±7 nm, respectively (Figure 5D). These results are corresponds to the possible unfolding configurations correlated to the protein domains of between amine acid residue 142 and amine acid residue 119, 85, and 23, respectively. In addition, these experimental results (9±2 nm, 22±3 nm, and 46±7 nm) are consistent with the theoretical results (8.7 nm, 21.7 nm, and 45.2 nm above). Based on above results, we propose that three domains exist between residue 23 and residue 142, namely, DomA (green in Figure 5), DomB (purple in Figure 5), and DomC (red in Figure 5). Since there is only three unfolding configurations as discussed above, we investigate them separately (Figure 5A–5C) and integrate the results into one probability distribution of rupture distances (Figure 5D). In the first configuration (119,142), as shown in Figure 5A, one end of HPPK is tethered to the glass cover-slip through residue 142 when the other end is linked to the AFM tip via residue 119. In our model, DomC is unfolded by AFM tip pulling, and the experimental rupture distance is about 9 nm which is not only consistent with the theoretical value 8.7 nm, but also completely agree with the first peak (9 nm) of rupture distance distribution (Figure 5D). In the second configuration (85,142), the pulling and tethering sites on HPPK are residue 85 and residue 142, respectively. As shown in Figure 5B, DomB and DomC are unfolded with the rupture distance around 22 nm, this experimental result is also consistent with the theoretical value 21.7 nm and the second peak (22 nm) of rupture distance distribution (Figure 5D). In the third configuration (23, 142), as shown in Figure 5C, three proposed domains (DomA, DomB and DomC) between site 23 and site 142 are all unfolded and thus giving a larger rupture distance compared to only unfolding DomC (Figure 5A) or unfolding DomB and DomC (Figure 5B). Furthermore, the experimental value (45 nm), the expected theoretical value (45.2 nm) and the third peak (45 nm) in the distribution of rupture distance are all almost identical to each other. Therefore, in Figure 5, all the three force curves fit well in our proposed three domains model. Moreover, the rupture distance consistence of different domains among experimental values, theoretical values and the distribution peaks reinforces our proposed three domains explanation.
The results (Figure 5) show a number of significant characteristics: (1) There are multiple peaks appearing in single domain from unfolding a single protein molecule. The multiple peaks in the single-molecule pulling force spectroscopy are primarily attributed to the traces associated with unfolding of the single segments, loops, or domains. The data are also associated with fluctuations due to the rugged landscape of protein folding with multiple local minima. For example, in Figure 5A, the force pulling curve shows two small peaks that come from the unfolding single protein domain DomC between residue 119 and residue 142, which suggests that our AFM-FRET nanoscopy approach is capable of probing the substructures of the protein domain from force curves. Although, at this stage, we are not able to identify each peak with the exact fragment in the protein domains, this observation of substructures in single molecule force spectroscopy is highly promising, which allows AFM force pulling to be a potentially powerful tool for offering insight into the details of the protein domains, (2) In the single molecule force curve, the order of these peaks did not follow the protein structure sequence order (Figure 5E), indicating the order of the rupture did not follow the exact pattern of protein substructure sequence order in the molecule (See Supporting Information S1). For example, the observed order of the peaks in Figure 5A (DomC) or 5B (DomB and DomC) did not show the same order as they appeared in Figure 5C (DomA, DomB and DomC). We attributed this order variance to the different overall affinity among amino acid residues in substructures to resist pulling force, resulting in that some of the substructures are easier to be unfolded or ruptured, while others are not. We also attributed this result to cooperative unfolding nature of three domain, individual domains were not unfolded independently when not just one domain was stretched, as described in Figure 5B and 5C. (3) The force for rupturing a single protein molecule is small, the range of the force distribution is between 5 to 20 pN, as shown in the three force curves.
Our AFM-FRET nanoscopy presents a significant advancement comparing current reported techniques 29–33 in terms of conducting simultaneous single-molecule force manipulation and FRET measurement probing the corresponding conformational changes of a single targeted enzyme molecule, which is particularly powerful for studying enzyme function-conformation mechanisms and relationships between function and conformations. Nevertheless, as a typical new approach under a new development, there are still technical limitations that need to be addressed in a further development of this combined AFM-FRET nanoscopy. For example, a major technical limitation is that the AFM tip light reflection changes the microscope photon collection efficiency depending on the tip-to-laser focus spot distance in a simultaneous AFM force manipulation and optical FRET recording experiment, the so called AFM tip micro-mirror effect of changing the microscopic photon collection solid angle. In an AFM-FRET single-molecule protein pulling experiment, as AFM tip approaches close to the sample surface, the micro-mirror effect of AFM tip enhances the fluorescence signal collection. The enhanced signal in both channels of donor and acceptor makes the conformational analysis from FRET trajectory often complicated and susceptible to analysis errors. An alternative approach to remedy this complication is to use fluorescence lifetime dependent FRET measurement 42, 43 that records and analyze the single-molecule FRET signal independently from overall intensity changes but the temporal changes in fluorescence decay time. Therefore, a micro-mirror effect will not interfere with the single-molecule FRET measurements in recording protein conformational changes.
CONCLUSIONS
We have demonstrated a novel approach of single-molecule AFM-FRET nanoscopy that is capable of conducting simultaneous single-molecule force manipulation and FRET measurement for a targeted single protein molecule. Using this approach, we are able (1) to locate an individual Cy3–Cy5 labeled enzyme molecule in a pinpoint nanoscale precision, (2) to force pulling and unfolding the target single enzyme molecule, and (3) to simultaneously probe the protein conformational changes by single-molecule FRET spectroscopy measurement during the AFM pulling event. Our demonstrated single-molecule AFM-FRET nanoscopy presents a novel approach of studying protein structure-function dynamics and mechanism. Using the nanoscope, we have specifically demonstrated the force pulling manipulation of a kinase enzyme and simultaneously probed the manipulated conformational changes by correlated single-molecule FRET recording, which showed multiple rupture coordinates in single-molecule enzyme force unfolding processes. The AFM-FRET nanoscopy provides a new approach of analyzing the landscape of protein folding and manipulating protein conformations to explore new properties.
EXPERIMENTAL SECTIONS
Sample Preparation
In preparation of the samples, we first coated the glass cover-slip by covalently linking the amine group in the protein matrix with the isobutyl group of (3-aminopropyl) trimethoxysilane and isobutyltrimethoxysilane in DMSO solution in a ratio of 1:10000. Then we treated the cover-slip surface by amine-to-amine crosslinkers (dimethyl suberimidate•2HCl, Thermo Scientific) and the HPPK kinase solutions respectively, to cross-link an amine group in HPPK with an amine group on the cover-slip surface.44 After rinsing to remove free enzymes and residual bi-function linkers, the enzyme molecules were distributed with a low surface density of about one enzyme per μm2 area on the cover-slip surface, which is suitable and typical for single-molecule FRET fluorescence imaging measurements at the optical diffraction limited spatial resolution. A biotin group was further attached to the tethered enzyme molecule with an amine group by immersing the sample in 10 nM EZ-link NHS-SS-Biotin, 0.1M PBS buffer (pH=7.4), 0.15M NaCl solution for 4 hours.44 After rinsing to remove un-linked biotin linkers, streptavidin was further attached to biotin group by immersing the sample in 10nM streptavidin solution. (see the Supporting Information S3 for details)
AFM Tip Preparation
An Au coated AFM tip (MikroMasch CSC38/Cr-Au, typical force constant K=0.01, 0.03, 0.05 N/m) used in the experiments was first modified with a monolayer of biotin by immersing the AFM tip in 1mM 2-aminoethanethiol solution for 4 hours. The AFM tip was then further immersed in 10 nM EZ-link NHS-SS-Biotin, 0.1M PBS buffer (pH=7.4), 0.15M NaCl solution for another 4 hours.44 The interaction pair of biotin and streptavidin serves as the primary force “handle” in an AFM tip force pulling experiment. (see the Supporting Information S4 for details))
Co-Axial Alignment of AFM Tip, Laser Beam Focus, and Target Molecule
The experimental setup of AFM-FRET nanoscopy is shown in details in Figure S5 (Supporting Information S5). The first and critical step is to line up the optical focal point and AFM tip for a typical operation of our AFM-FRET nanoscopy. First, we move the x-y two-axis mechanical positioning stage to roughly co-axis the AFM tip with the laser beam focal point by observing the light reflection pattern from the AFM tip, a symmetric light reflection pattern is to be observed from the microscope objective. It indicates that the coaxial position is achieved within a few micrometers. To co-axis the AFM tip with the laser beam center of Gaussian distribution of the laser focus, we scan the AFM tip cross the area of laser beam that has been aligned, and send one of the photon-counting signal to AFM controller through a gated photon counter SR400 (Stanford instruments). The image of the optical intensity was taken during an AFM tip scanning as shown in Figure S6 (Supporting Information S6). A bright spot of the optical intensity is due to the photons from tip reflection as the tip scans over the laser beam, because the tip can be considered as a micro mirror which can reflect more photons back through the objective. Through this alignment, we are able to align AFM tip with the center of laser beam to a hundred nanometers.
After aligning AFM tip with the laser beam focus in an over-under co-axial configuration, we first obtain an optical image (10μm × 10μm) by raster scanning the close-loop 2D electropiezo-scanning stage with sample over the laser focus at a scanning speed of 4ms/pixel. Each image has a matrix density of 100 pixels ×100 pixels. We collect single-molecule fluorescence intensities of the Cy3 and Cy5 to locate single enzyme molecule positions as shown in Figure 1B. We then move the close-loop sample stage to make the target molecule right in the center of the focal point by position control of the close-loop x-y electropiezo-scanner stage. As shown in Figure 2A, the AFM tip is right on top of the microscopic focal point and it is also right on top of the single molecule with a few hundred nanometers precision which is within the optical diffraction limit. Till now, three components of AFM tip-protein-laser beam components are right in the same axis.
AFM Matrix Pulling (or Mapping)
We conducted the AFM-FRET combined experiment in 100 mM Tris-HCl buffer and 10 mM MgCl2 (pH=8.3). To protect the FRET dyes from photo-bleaching, we have also added a 0.8% D-glucose plus 1 mg/ml glucose oxidase, 0.04 mg/ml catalase, and about 1mM Trolox in the mixture.45 We utilized an approach of combined AFM 2D matrix force pulling scanning and single-molecule FRET imaging measurements. With the aligning of the AFM tip, the laser beam focus, and the target molecule in a co-axial configuration, the AFM tip and single target molecule are both in the laser focus, however, the distance between AFM tip and the target molecule can be still in tens of nanometers away. To ensure a single-molecule AFM-FRET measurement for the same target protein molecule, we use a new approach of AFM matrix pulling (or mapping) and simultaneous single-molecule FRET measurement. The typical size of the coated AFM tip apex is around 20–40nm in diameter, and HPPK enzyme molecule with streptavidin is about 5–10 nm in diameter, therefore, a 20×20 nm2 area (about one pulling event area) is sufficient for each AFM-tip pulling to ensure a direct contact with the single molecule under the laser focal point. In a typical experimental protocol shown in Figure S7A (Supporting Information S7), there is a 16×16 times pulling matrix within an area of 300×300 nm2, in which an AFM-tip force pulling event occurs in every 20 nm interval. Meanwhile, the single protein molecule can be reached under such a sampling matrix of every 20×20 nm2 within the laser focal point where one individual target molecule is located. Simultaneously, we record the single-molecule fluorescence intensities of the FRET pair of Cy3 and Cy5 by a two-channel photon-stamping module during the AFM matrix scanning.
Supplementary Material
Acknowledgments
This work is supported by the Basic Material Science program of the Army Research Office, and it is also supported in part by NIH NIGMS. We acknowledge stimulating discussions with Professor Honggao Yan of Michigan State University, and his providing the FRET labeled HPPK protein samples.
Footnotes
SUPPORTING INFORMATION AVAILABLE: Detailed description of the possible amino-acid residues that linked the protein molecule to the cover-slip surface and to the biotin handle, Detailed description of single-molecule AFM-FRET nanoscopy setup, and supporting figures are provided. This material is available free of charge via the Internet at http://pubs.acs.org.
REFERENCE AND NOTES
- 1.Boehr DD, Dyson HJ, Wright PE. An NMR Perspective on Enzyme Dynamics. Chem Rev. 2006;106:3055–3079. doi: 10.1021/cr050312q. [DOI] [PubMed] [Google Scholar]
- 2.Henzler-Wildman KA, Lei M, Thai V, Kerns SJ, Karplus M, Kern D. A Hierarchy of Timescales in Protein Dynamics Is Linked to Enzyme Catalysis. Nature. 2007;450:913–916. doi: 10.1038/nature06407. [DOI] [PubMed] [Google Scholar]
- 3.Henzler-Wildman KA, Thai V, Lei M, Ott M, Wolf-Watz M, Fenn T, Pozharski E, Wilson MA, Petsko GA, Karplus M, Hubner CG, Kern D. Intrinsic Motions Along an Enzymatic Reaction Trajectory. Nature. 2007;450:838–844. doi: 10.1038/nature06410. [DOI] [PubMed] [Google Scholar]
- 4.Min W, English BP, Luo GB, Cherayil BJ, Kou SC, Xie XS. Fluctuating Enzymes: Lessons from Single-Molecule Studies. Acc Chem Res. 2005;38:923–931. doi: 10.1021/ar040133f. [DOI] [PubMed] [Google Scholar]
- 5.Blaszczyk J, Li Y, Wu Y, Shi GB, Ji XH, Yan HG. Essential Roles of a Dynamic Loop in the Catalysis of 6-Hydroxymethyl-7,8-Dihydropterin Pyrophosphokinase. Biochemistry. 2004;43:1469–1477. doi: 10.1021/bi036053l. [DOI] [PubMed] [Google Scholar]
- 6.Mittag T, Kay LE, Forman-Kay JD. Protein Dynamics and Conformational Disorder in Molecular Recognition. J Mol Recognit. 2009;23:105–116. doi: 10.1002/jmr.961. [DOI] [PubMed] [Google Scholar]
- 7.Sugase K, Dyson HJ, Wright PE. Mechanism of Coupled Folding and Binding of an Intrinsically Disordered Protein. Nature. 2007;447:1021–1025. doi: 10.1038/nature05858. [DOI] [PubMed] [Google Scholar]
- 8.Wright PE, Dyson HJ. Linking Folding and Binding. Curr Opin Struct Biol. 2009;19:31–38. doi: 10.1016/j.sbi.2008.12.003. [DOI] [PMC free article] [PubMed] [Google Scholar]
- 9.Boehr DD, Nussinov R, Wright PE. The Role of Dynamic Conformational Ensembles in Biomolecular Recognition. Nat Chem Biol. 2009;5:789–796. doi: 10.1038/nchembio.232. [DOI] [PMC free article] [PubMed] [Google Scholar]
- 10.Guo ZJ, Gibson M, Sitha S, Chu S, Mohanty U. Role of Large Thermal Fluctuations and Magnesium Ions in t-RNA_Selectivity of the Ribosome. Proc Natl Acad Sci USA. 108:3947–3951. doi: 10.1073/pnas.1100671108. [DOI] [PMC free article] [PubMed] [Google Scholar]
- 11.Eisenmesser EZ, Bosco DA, Akke M, Kern D. Enzyme Dynamics During Catalysis. Science. 2002;295:1520–1523. doi: 10.1126/science.1066176. [DOI] [PubMed] [Google Scholar]
- 12.Tan X, Nalbant P, Toutchkine A, Hu DH, Vorpagel ER, Hahn KM, Lu HP. Single-Molecule Study of Protein-Protein Interaction Dynamics in a Cell Signaling System. J Phys Chem B. 2004;108:737–744. [Google Scholar]
- 13.Tan X, Hu DH, Squier TC, Lu HP. Probing Nanosecond Protein Motions of Calmodulin by Single-Molecule Fluorescence Anisotropy. Appl Phys Lett. 2004;85:2420–2422. [Google Scholar]
- 14.Zhang Q, Stelzer AC, Fisher CK, Al-Hashimi HM. Visualizing Spatially Correlated Dynamics That Directs RNA Conformational Transitions. Nature. 2007;450:1263–1267. doi: 10.1038/nature06389. [DOI] [PubMed] [Google Scholar]
- 15.Mittermaier AK, Kay LE. Observing Biological Dynamics at Atomic Resolution Using NMR. Trends Biochem Sci. 2009;34:601–611. doi: 10.1016/j.tibs.2009.07.004. [DOI] [PubMed] [Google Scholar]
- 16.Pan R, Zhang XJ, Zhang ZJ, Zhou Y, Tian WX, He RQ. Substrate-Induced Changes in Protease Active Site Conformation Impact on Subsequent Reactions with Substrates. J Biol Chem. 2010;285:22948–22954. doi: 10.1074/jbc.M110.103549. [DOI] [PMC free article] [PubMed] [Google Scholar]
- 17.Lu HP, Iakoucheva LM, Ackerman EJ. Single-Molecule Conformational Dynamics of Fluctuating Noncovalent DNA-Protein Interactions in DNA Damage Recognition. J Am Chem Soc. 2001;123:9184–9185. doi: 10.1021/ja0058942. [DOI] [PubMed] [Google Scholar]
- 18.Harms G, Orr G, Lu HP. Probing Ion Channel Conformational Dynamics Using Simultaneous Single-Molecule Ultrafast Spectroscopy and Patch-Clamp Electric Recording. Appl Phys Lett. 2004;84:1792–1794. [Google Scholar]
- 19.Harms GS, Orr G, Montal M, Thrall BD, Colson SD, Lu HP. Probing Conformational Changes of Gramicidin Ion Channels by Single-Molecule Patch-Clamp Fluorescence Microscopy. Biophys J. 2003;85:1826–1838. doi: 10.1016/S0006-3495(03)74611-6. [DOI] [PMC free article] [PubMed] [Google Scholar]
- 20.Lomholt MA, Urbakh M, Metzler R, Klafter J. Manipulating Single Enzymes by an External Harmonic Force. Phys Rev Lett. 2007;98:168302. doi: 10.1103/PhysRevLett.98.168302. [DOI] [PubMed] [Google Scholar]
- 21.Astumian RD, Robertson B. Imposed Oscillations of Kinetic Barriers Can Cause an Enzyme to Drive a Chemical-Reaction Away from Equilibrium. J Am Chem Soc. 1993;115:11063–11068. [Google Scholar]
- 22.Wiita AP, Ainavarapu SRK, Huang HH, Fernandez JM. Force-Dependent Chemical Kinetics of Disulfide Bond Reduction Observed with Single-Molecule Techniques. Proc Natl Acad Sci US A. 2006;103:7222–7227. doi: 10.1073/pnas.0511035103. [DOI] [PMC free article] [PubMed] [Google Scholar]
- 23.Wiita AP, Perez-Jimenez R, Walther KA, Grater F, Berne BJ, Holmgren A, Sanchez-Ruiz JM, Fernandez JM. Probing the Chemistry of Thioredoxin Catalysis with Force. Nature. 2007;450:124–127. doi: 10.1038/nature06231. [DOI] [PMC free article] [PubMed] [Google Scholar]
- 24.Lu HP. Single-Molecule Spectroscopy Studies of Conformational Change Dynamics in Enzymatic Reactions. Curr Pharm Biotechnol. 2004;5:261–269. doi: 10.2174/1389201043376887. [DOI] [PubMed] [Google Scholar]
- 25.Lu HP, Xun LY, Xie XS. Single-Molecule Enzymatic Dynamics. Science. 1998;282:1877–1882. doi: 10.1126/science.282.5395.1877. [DOI] [PubMed] [Google Scholar]
- 26.Lu HP. Probing Single-Molecule Protein Conformational Dynamics. Acc Chem Res. 2005;38:557–565. doi: 10.1021/ar0401451. [DOI] [PubMed] [Google Scholar]
- 27.Junker JP, Rief M. Single-Molecule Force Spectroscopy Distinguishes Target Binding Modes of Calmodulin. Proc Natl Acad Sci US A. 2009;106:14361–14366. doi: 10.1073/pnas.0904654106. [DOI] [PMC free article] [PubMed] [Google Scholar]
- 28.Junker JP, Ziegler F, Rief M. Ligand-Dependent Equilibrium Fluctuations of Single Calmodulin Molecules. Science. 2009;323:633–637. doi: 10.1126/science.1166191. [DOI] [PubMed] [Google Scholar]
- 29.Gumpp H, Puchner EM, Zimmermann JL, Gerland U, Gaub HE, Blank K. Triggering Enzymatic Activity with Force. Nano Letters. 2009;9:3290–3295. doi: 10.1021/nl9015705. [DOI] [PubMed] [Google Scholar]
- 30.Sarkar A, Robertson RB, Fernandez JM. Simultaneous Atomic Force Microscope and Fluorescence Measurements of Protein Unfolding Using a Calibrated Evanescent Wave. Proc Natl Acad Sci US A. 2004;101:12882–12886. doi: 10.1073/pnas.0403534101. [DOI] [PMC free article] [PubMed] [Google Scholar]
- 31.Kodama T, Ohtani H, Arakawa H, Ikai A. Mechanical Perturbation-Induced Fluorescence Change of Green Fluorescent Protein. Appl Phys Lett. 2005;86:043901. [Google Scholar]
- 32.Gaiduk A, Kuhnemuth R, Felekyan S, Antonik M, Becker W, Kudryavtsev V, Sandhagen C, Seidel CAM. Fluorescence Detection with High Time Resolution: From Optical Microscopy to Simultaneous Force and Fluorescence Spectroscopy. Microsc Res Tech. 2007;70:433–441. doi: 10.1002/jemt.20430. [DOI] [PubMed] [Google Scholar]
- 33.Kellermayer MSZ, Karsai A, Kengyel A, Nagy A, Bianco P, Huber T, Kulcsar A, Niedetzky C, Proksch R, Grama L. Spatially and Temporally Synchronized Atomic Force and Total Internal Reflection Fluorescence Microscopy for Imaging and Manipulating Cells and Biomolecules. Biophys J. 2006;91:2665–2677. doi: 10.1529/biophysj.106.085456. [DOI] [PMC free article] [PubMed] [Google Scholar]
- 34.Li Y, Gong YC, Shi GB, Blaszczyk J, Ji XH, Yan HG. Chemical Transformation Is Not Rate-Limiting in the Reaction Catalyzed by Escherichia Coli 6-Hydroxymethyl-7,8-Dihydropterin Pyrophosphokinase. Biochemistry. 2002;41:8777–8783. doi: 10.1021/bi025968h. [DOI] [PubMed] [Google Scholar]
- 35.We Received the FRET Donor-Acceptor Dye-Labeled HPPK Samples from Professor Honggao Yan of Michigan State University.
- 36.Ha TJ, Ting AY, Liang J, Caldwell WB, Deniz AA, Chemla DS, Schultz PG, Weiss S. Single-Molecule Fluorescence Spectroscopy of Enzyme Conformational Dynamics and Cleavage Mechanism. Proc Natl Acad Sci US A. 1999;96:893–898. doi: 10.1073/pnas.96.3.893. [DOI] [PMC free article] [PubMed] [Google Scholar]
- 37.Roy R, Hohng S, Ha T. A Practical Guide to Single-Molecule FRET. Nat Methods. 2008;5:507–516. doi: 10.1038/nmeth.1208. [DOI] [PMC free article] [PubMed] [Google Scholar]
- 38.Hinterdorfer P, Oijen Av. Handbook of Single-Molecule Biophysics. Springer; 2009. [Google Scholar]
- 39.Rief M, Gautel M, Oesterhelt F, Fernandez JM, Gaub HE. Reversible Unfolding of Individual Titin Immunoglobulin Domains by AFM. Science. 1997;276:1109–1112. doi: 10.1126/science.276.5315.1109. [DOI] [PubMed] [Google Scholar]
- 40.Rief M, Fernandez JM, Gaub HE. Elastically Coupled Two-Level Systems as a Model for Biopolymer Extensibility. Phys Rev Lett. 1998;81:4764–4767. [Google Scholar]
- 41.Cecconi C, Shank EA, Bustamante C, Marqusee S. Direct Observation of the Three-State Folding of a Single Protein Molecule. Science. 2005;309:2057–2060. doi: 10.1126/science.1116702. [DOI] [PubMed] [Google Scholar]
- 42.Hu DH, Micic M, Klymyshyn N, Suh YD, Lu HP. Correlated Topographic and Spectroscopic Imaging Beyond Diffraction Limit by Atomic Force Microscopy Metallic Tip-Enhanced Near-Field Fluorescence Lifetime Microscopy. Rev Sci Instrum. 2003;74:3347–3355. [Google Scholar]
- 43.Ratchford D, Shafiei F, Kim S, Gray SK, Li XQ. Manipulating Coupling between a Single Semiconductor Quantum Dot and Single Gold Nanoparticle. Nano Lett. 2011;11:1049–1054. doi: 10.1021/nl103906f. [DOI] [PubMed] [Google Scholar]
- 44.Hermanson GT. Bioconjugate Techniques. 2. Academic Press; 2008. [Google Scholar]
- 45.Selvin PR, Ha T. Single-Molecule Techniques: A Laboratory Manual. Cold Spring Harbor Laboratory Press; 2008. [Google Scholar]
Associated Data
This section collects any data citations, data availability statements, or supplementary materials included in this article.