

Abstract
Objective:
To estimate whole-brain microinfarct burden from microinfarct counts in routine postmortem examination.
Methods:
We developed a simple mathematical method to estimate the total number of cerebral microinfarcts from counts obtained in the small amount of tissue routinely examined in brain autopsies. We derived estimates of total microinfarct burden from autopsy brain specimens from 648 older participants in 2 community-based clinical-pathologic cohort studies of aging and dementia.
Results:
Our results indicate that observing 1 or 2 microinfarcts in 9 routine neuropathologic specimens implies a maximum-likelihood estimate of 552 or 1,104 microinfarcts throughout the brain. Similar estimates were obtained when validating in larger sampled brain volumes.
Conclusions:
The substantial whole-brain burden of cerebral microinfarcts suggested by even a few microinfarcts on routine pathologic sampling suggests a potential mechanism by which these lesions could cause neurologic dysfunction in individuals with small-vessel disease. The estimation framework developed here may generalize to clinicopathologic correlations of other imaging-negative micropathologies.
Cerebral microinfarcts are defined as ischemic infarctions, located anywhere in the brain, identifiable by microscopic but not visual inspection.1–3 In practice, these “invisible” lesions are typically less than 1–2 mm in diameter, and therefore smaller than the 3–15 mm diameters characteristic of lacunar infarcts.4,5 As a result, microinfarcts cannot be seen by either conventional structural neuroimaging or gross evaluation of brain slices. They are instead most commonly detected by microscopic examination of routinely selected brain sections,2,6 or possibly as small acute infarcts on diffusion-weighted imaging (DWI) MRI.7,8 Despite their small size, microinfarcts appear to be associated with dementia even after controlling for other neuropathologies (including macroscopic infarcts),2,6 suggesting that microinfarct burden may be an important link between small-vessel disease and cognitive impairment.
A crucial step in assessing the mechanism by which microinfarcts impact neurologic function is to determine their total burden in the brain. Microscopic sampling of the entire brain is not feasible, however. As a step toward overcoming this limitation, we present a simple method for estimating the total number of microinfarcts in the brain based on lesion counts obtained from routinely selected autopsy sections. Our findings suggest that the presence of even 1 or 2 microinfarcts in limited samples of brain tissue indicates a likely overall burden of hundreds of these small lesions.
METHODS
Data for this study were obtained from brain samples of 648 deceased and autopsied participants of the Rush Religious Orders Study and Memory and Aging project, 2 community-based clinical-pathologic cohort studies of aging and dementia (mean age at death = 88.3 years, SD = 6.6; 222 men, 426 women).9 Details of recruitment, clinical evaluation, cognitive testing, and follow-up have been reported previously.10–17 Briefly, the Memory and Aging Project (MAP) and Religious Orders Study (ROS) are ongoing clinical-pathologic epidemiologic studies of aging and dementia in older persons. Persons 65 years and older without known dementia are enrolled from the community following group presentations at established venues such as churches and senior centers as previously described.16,17 Participants consent to the study and agree to brain donation at the time of death. There are no exclusion criteria. Annual follow-up rates in both studies exceed 95% of survivors in ROS and 90% in MAP. In MAP, there have been 453 autopsies out of 564 deaths (autopsy rate 80.3%) and in ROS there have been 570 autopsies out of 606 deaths (autopsy rate 94.0%). The 648 cases included in this work were consecutive autopsy cases between January 2002 and March 22, 2011.
Standard protocol approvals, registrations, and patient consents.
The neuropathology studies were approved by the institutional review board at Rush University Medical Center.
Neuropathology data.
Our calculations were carried out using the parameter values in table 1, which provides typical measurements for the quantities required in the model. The average microinfarct diameter was estimated from pathology specimens using the method explained in appendix e-1 on the Neurology® Web site at www.neurology.org. The numbers of microinfarcts found in 648 cases are shown in table 2. Because the blocking procedures changed during the course of these studies, we used only subjects who died in or after 2002 to ensure uniformity of block collection across the 2 studies. Brains were removed, fixed in 4% paraformaldehyde, and reviewed and blocked after fixation as previously described.6 Blocks were collected from 9 predetermined sites including midfrontal cortex, middle/superior temporal cortex, inferior parietal cortex, cingulate cortex, hippocampus, entorhinal cortex, anterior basal ganglia, anterior thalamus, and midbrain. Block dimensions are approximately 1 × 2 × 1/4 inches. A single 6-μM section from each block was placed on a slide for review, and old microscopic infarcts were identified using hematoxylin & eosin stain by finding cavitation, puckering, or discrete regions of pallor with cell loss and surrounding gliosis. In addition, to estimate the average size of microinfarcts, we randomly sampled the areas of microinfarctions from 14 cases with 21 infarcts and estimated the diameter of the smallest detectable microinfarct profile to be ∼85 μM (see appendix e-1).
Table 1.
Parameter values used in the model
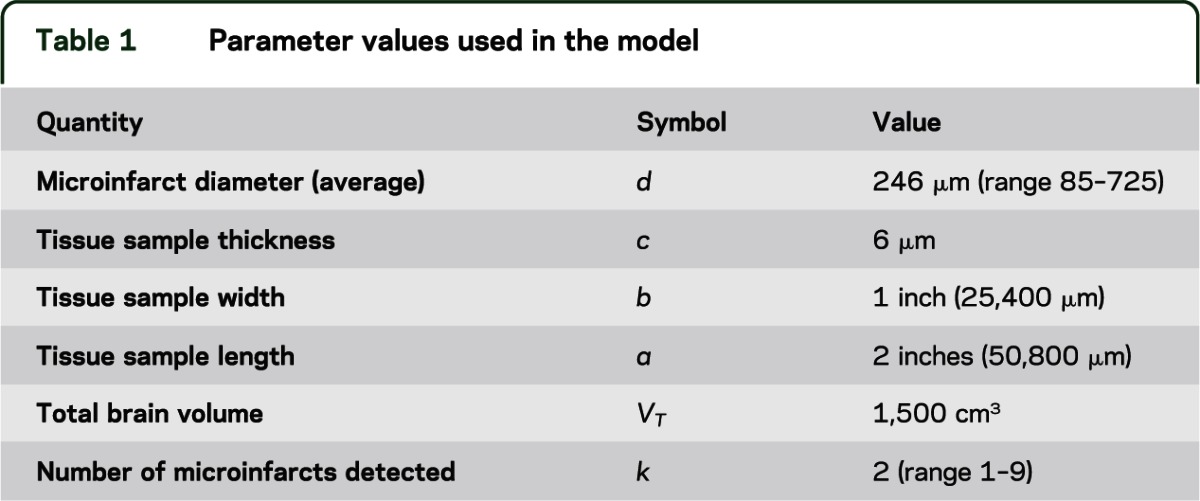
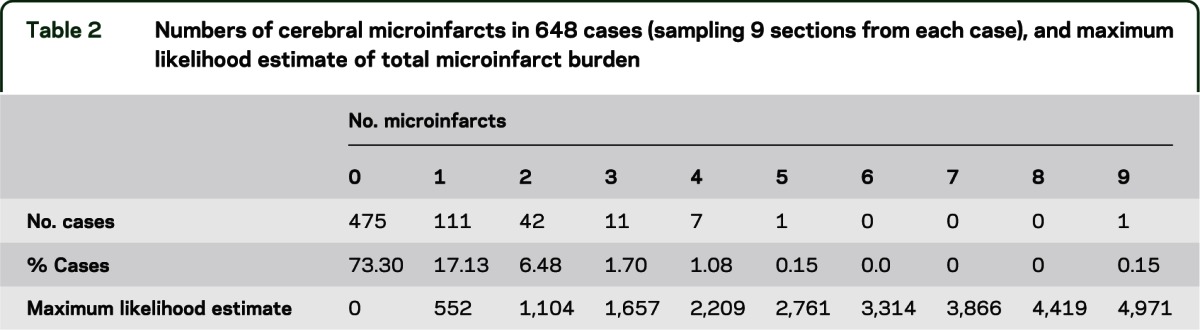
Table 2.
Numbers of cerebral microinfarcts in 648 cases (sampling 9 sections from each case), and maximum likelihood estimate of total microinfarct burden
In-depth examination of 2 cases.
In 2 cases, we performed more extensive sampling across the brain (23 regions) and included deeper sections within specific blocks of tissue (i.e., midfrontal and basal ganglia). In case 1, we examined a total of 80 slides, including sections from superior frontal cortex (2), midfrontal cortex (26), motor cortex (2), anterior cingulate cortex (3), middle temporal cortex (1), inferior temporal cortex (2), inferior parietal cortex (1), posterior parietal cortex (2), angular cortex (2), precuneus cortex (2), calcarine cortex (2), centrum semiovale (2), anterior basal ganglia (17), ventromedial caudate (2), posterior putamen (2), hippocampus (4), entorhinal cortex (1), amygdala (1), anterior thalamus (1), midbrain (2), pons (2), and cerebellar cortex and dentate (1). In case 2, we examined the same regions listed above plus 10 additional sections from midfrontal cortex, 1 from hippocampus, and 8 from basal ganglia, for a total of 99 slides reviewed from 23 regions.
Analytic method.
Our estimation method is based on a modification of the solution to the classic Buffon needle problem,18,19 which analyzes the probability that a needle dropped onto a lined paper will intersect a line. We make the following simplifying assumptions regarding microinfarcts: 1) they are spherically shaped, with a characteristic diameter, d; 2) they are uniformly distributed throughout the total brain volume; 3) they are small enough to be considered “point particles” relative to the total volume of the brain (although we do allow for brain sections to intersect a microinfarct at any point in its sphere, we neglect the possibility that 2 microinfarcts might overlap spatially).
With these assumptions in mind, consider the schematic in appendix e-1: figure e-2. A tissue sample is represented as a rectangular box having length a, width b, and thickness c. Given the assumption of spherical shape, the microtome could transect the microinfarct at any point between its center and the tangential edge; that is, it will be detectable within a microtome section if its center point lies within a distance d/2 or less from any surface of the rectangular box, assuming that a circle of any radius within the sectioning plane can be reliably seen. More realistically, there is a minimum detectable diameter, estimated to be approximately 80 µm based on the smallest microinfarct measured in a representative survey of identified lesions (see above, and appendix e-1). This implies that microinfarct centers must actually be slightly closer to the microtome section surface to be detectable, i.e., the distance can be no more than 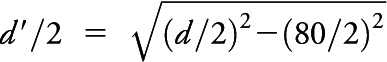 . We can therefore specify a detection volume (Vd) surrounding the rectangular box representation of the pathology specimen, by adding the sphere diameter dimension to each edge, such that
  . Given N such detection volumes obtained in a given autopsy, the total detection volume of brain sampled is
 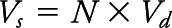 . The probability of detecting a single microinfarct within the total brain volume VT, given our assumption that the microinfarcts are uniformly distributed throughout the brain, is p = VS/VT Finally, for any given total number of microinfarcts in the brain, M, the probability of detecting k of these in our sample is given by the binomial distribution:
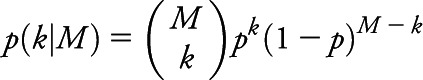 |
In this equation (the likelihood function), k represents the actual number of microinfarcts observed in the examined tissue samples and M represents the total number of microinfarcts in the whole brain, an unobserved quantity to be inferred. We can obtain a reasonable range of values for M by letting it vary and seeing which values are consistent with the observed data at or above a suitably chosen probability level.
RESULTS
To illustrate the concept underlying our analysis, consider a case in which one observes 2 microinfarcts in standard limited pathology sampling (9 sections, each 6 µm thick, accounting for 5 one-thousandths of 1% of total brain volume) and would like to infer the potential plausible values of total brain microinfarct burden. Figure 1 addresses this question by showing the probability of observing 2 microinfarcts (k = 2 in the binomial distribution formula), as a function of a range of total number of microinfarcts in the brain, M. The remaining parameters used in the generation of this plot are shown in table 1. As an estimate of the range of plausible values for the total microinfarct burden, we consider the values of M for which the probability of observing 2 microinfarcts is >5%. This range is shown in the figure as the lightly shaded central region of this skewed bell-shaped curve, corresponding to approximately 212 to 3,217 microinfarcts, with a maximum likelihood (ML) estimate of 1,104 lesions.
Figure 1. Probability of 2 microinfarcts on routine postmortem examination vs total brain burden.

Probability of finding 2 microinfarcts in routine pathologic examination of 9 microtome sections, as a function of the total number of microinfarcts randomly distributed throughout the brain volume, calculated using values from table 1. The light gray region (between 212 and 3,217 microinfarcts) contains values for which the probability exceeds 5%.
We can generalize this inferential method across the range of typical numbers of microinfarcts observed in pathology samples (table 2). Figure 2 shows the ML estimate of the total number of microinfarcts vs the observed number of infarcts (solid line), i.e., the value of M with the maximal/peak probability for a given value of the observed number of microinfarcts in the examined tissue samples, k. When tissue samples contain between 1 and 9 microinfarcts, this leads to ML estimates for total burden between roughly 552 and 4,971 microinfarcts. We also note that failure to detect any microinfarcts in routine pathologic specimens is still compatible, with a >5% probability of up to 1,653 microinfarcts hiding within the remaining unsampled brain. As expected, the width of the confidence intervals around the estimates of total brain microinfarct decreases when larger numbers of slides are examined (see appendix e-1: figure e-5).
Figure 2. Estimate of total brain microinfarct burden vs number found on routine postmortem examination.
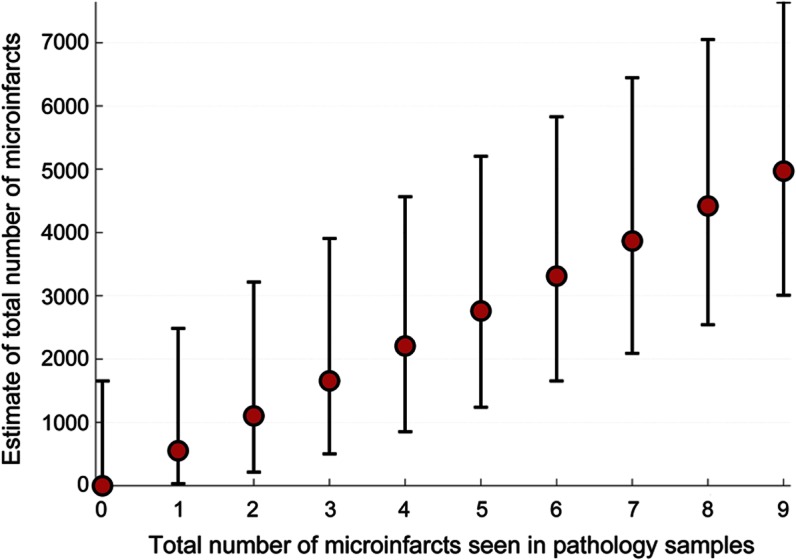
Maximum likelihood estimates (red filled circles) with 90% confidence intervals of the total number of microinfarcts within the brain volume vs total number of microinfarcts seen in routine pathologic specimens, calculated using values from table 1.
We tested the plausibility of these estimates by analyzing the numbers of microinfarcts in larger volumes of brain tissue taken from 2 cases, using 2 different approaches. In the first approach we compared estimates of whole-brain microinfarct burden from routine 9-section postmortem examination with estimates based on the larger examined volumes. In case 1, we examined a total of 80 tissue sections (approximately 0.6 cm3 of tissue) and found 21 microinfarcts, yielding a predicted total number of cerebral microinfarcts of 1,305 (90% confidence interval [CI] 1,029–1,626). In case 2, we examined 99 samples (approximately 0.8 cm3) and found 13 microinfarcts, yielding an estimated total brain microinfarct burden of 652 (90% CI 452–905). Both values were within the range estimated from typical numbers of microinfarcts found by more limited routine postmortem neuropathologic examination (table 2); i.e., 1–3 microinfarcts within 9 sections predicts 552–1,657 (90% CI 30–3,905) throughout the brain.
In the second approach, we compared the total microinfarct counts in the 2 larger volumes with the numbers predicted for those samples based on typical counts in routine 9-section sampling. The typical observation in our study of 1–3 microinfarcts in 9 routine sections predicts that we should observe 8–26 (90% CI 1–61) microinfarcts among 80 sections (in 0.6 cm3), compatible with the actually observed value of 21 in case 1. In case 2, the same extrapolation process predicts 10–32 (90% CI 1–76) microinfarcts among 99 sections (in 0.8 cm3), again in reasonable agreement with the 13 microinfarcts that we actually observed. Both approaches thus support the validity of the estimates obtained from typical numbers of microinfarcts among 9 routine sections for predicting the range of microinfarcts present in the brain as a whole.
DISCUSSION
The key conclusion from this analysis is that observing even one or two microinfarcts in routinely sampled sections of brain may indicate the presence of hundreds to thousands of these lesions in the entire brain. These estimates would make microinfarcts the most highly represented type of brain infarction, easily exceeding estimates for the total brain number of grossly visible lacunar infarcts (on the order of 1–15 per brain4) or larger infarcts. We have heard a lead investigator of the Honolulu-Asian Aging Study2 remark about the implications of microinfarcts that “finding one cockroach in your kitchen means there are hundreds in your wall”—our analysis suggests this is an apt metaphor for these lesions. The likely presence of hundreds of distributed small infarctions suggests a potentially direct role for these lesions in causing neurologic dysfunction in individuals with small-vessel disease, a possibility further supported by clinical–pathologic correlation studies linking these 2 findings.2,6
Given the simplifying assumptions used in our analysis, the estimates of cerebral microinfarct burden should be viewed as tentative. First, the assumption that microinfarcts are spherically shaped is a crude approximation, and exceptions, e.g., linear or triangular profiles, are probably common.20 Nevertheless, deviations of the observed microinfarct profile shapes from their hypothetical counterparts considered in our analysis are not expected to greatly affect the final estimates of microinfarct detectability or total microinfarct burden (see appendix e-1). A more significant potential source of estimation error is the assumption that microinfarcts are uniformly distributed throughout the brain, which may lead to either overestimates (if microinfarcts preferentially cluster near the 9 predetermined sites included by our current sampling procedures) or underestimates (if microinfarcts are more abundant in nonsampled regions) of the total microinfarct burden. Similar problems of over- or underestimation might result if microinfarct sizes systematically vary in ways not captured by our limited samples, e.g., if larger or smaller microinfarcts tend to be in regions not sampled. Further, if microinfarcts tend to cluster together rather than occurring independently, this would also tend to undermine our analysis, since finding a single lesion might imply a few neighboring microinfarcts without necessarily implying a large number throughout the remaining brain. Indeed, our qualitative impression from neuropathologic sampling is that microinfarcts tend to be more prevalent in some brain regions, particularly in the basal ganglia and cortex, and thus the simplifying assumption of uniform distribution is likely incorrect. It is nonetheless reassuring that 2 methods of validating our estimates—comparing the estimates from 9 sections to those obtained from more extensive tissue sampling and comparing the predicted to the empirically observed number of microinfarcts within the more extensively sampled tissue—both supported the approximate accuracy of the estimates from the routinely sampled sections.
Another line of indirect evidence supporting our estimate of hundreds of microinfarcts per brain is provided by the very high incidence of asymptomatic hyperintense lesions observed by DWI-MRI in patients with small-vessel disease.7,8,21–23 These neuroimaging results are subject to their own potential for overestimation or underestimation, however, such as DWI-MRI’s limited spatial (approximately 1 to 2 mm diameter) and temporal (within days of acute infarction) resolution. Our estimates of total microinfarct burden will therefore ultimately require systematic (and labor-intensive) sampling of entire brains using modern stereologic techniques.24 Because microinfarcts depend on vascular and other risk factors, these studies should be performed in a range of brains from persons of different ages, risk factors, and cognitive strata and with attention to the specificity and sensitivity of special staining methods for microinfarct pathology.
If confirmed by further histopathologic studies, the high estimated total microinfarct burden described here would support the hypothesis that these lesions are major contributors (rather than simply surrogate markers or bystanders) to small-vessel disease–related cognitive impairment. Estimating this burden may provide a mechanism for quantitatively assessing the extent to which variance in clinical impairment is attributed to this potentially important form of neuropathology.
Supplementary Material
ACKNOWLEDGMENT
The authors thank Dr. Lon White (Kuakini Medical Center) for providing the metaphor motivating the current study.
GLOSSARY
- CI
confidence interval
- DWI
diffusion-weighted imaging
- MAP
Memory and Aging Project
- ML
maximum likelihood
- ROS
Religious Orders Study
Footnotes
Supplemental data at www.neurology.org
Editorial, page 1358
AUTHOR CONTRIBUTIONS
Study concept and design: Drs. Westover, Bianchi, and Greenberg. Acquisition of data: Drs. Yang and Schneider. Analysis and interpretation of data: Drs. Westover, Bianchi, Schneider, Yang, and Greenberg. Drafting of the manuscript: Drs. Westover, Bianchi, and Greenberg. Critical revision of the manuscript for important intellectual content: Drs. Westover, Bianchi, Schneider, Yang, and Greenberg. Statistical analysis: Drs. Westover and Bianchi.
STUDY FUNDING
Supported by a grant from the NIH (R01 AG026484).
DISCLOSURE
M.B. Westover, M.T. Bianchi, and C. Yang report no disclosures. J.A. Schneider contributed data used in this work from the Funding for the Religious Orders Study and the Rush Memory and Aging Project, which were supported by grants from the National Institute on Aging (R01 AG15819, R01 AG17917, P30 AG10161, and K08 AG00849). S.M. Greenberg is funded by R01AG026484 from the NIH. Go to Neurology.org for full disclosures.
REFERENCES
- 1.Sonnen JA, Larson EB, Crane PK, et al. Pathological correlates of dementia in a longitudinal, population-based sample of aging. Ann Neurol 2007;62:406–413 [DOI] [PubMed] [Google Scholar]
- 2.Petrovitch H, Ross GW, Steinhorn SC, et al. AD lesions and infarcts in demented and non-demented Japanese-American men. Ann Neurol 2005;57:98–103 [DOI] [PubMed] [Google Scholar]
- 3.Smith EE, Schneider JA, Wardlaw JM, Greenberg SM. Cerebral microinfarcts: the invisible lesions. Lancet Neurol 2012;11:272–282 [DOI] [PMC free article] [PubMed] [Google Scholar]
- 4.Fisher CM. Lacunes: small, deep cerebral infarcts. Neurology 1965;15:774–784 [DOI] [PubMed] [Google Scholar]
- 5.Longstreth WT, Bernick C, Manolio TA, et al. Lacunar infarcts defined by magnetic resonance imaging of 3660 elderly people: the Cardiovascular Health Study. Arch Neurol 1998;55:1217–1225 [DOI] [PubMed] [Google Scholar]
- 6.Arvanitakis Z, Leurgans SE, Barnes LL, Bennett DA, Schneider JA. Microinfarct pathology, dementia, and cognitive systems. Stroke 2011;42:722–727 [DOI] [PMC free article] [PubMed] [Google Scholar]
- 7.Kimberly WT, Gilson A, Rost NS, et al. Silent ischemic infarcts are associated with hemorrhage burden in cerebral amyloid angiopathy. Neurology 2009;72:1230–1235 [DOI] [PMC free article] [PubMed] [Google Scholar]
- 8.Menon RS, Kidwell CS. Neuroimaging demonstration of evolving small vessel ischemic injury in cerebral amyloid angiopathy. Stroke 2009;40:e675–e677 [DOI] [PubMed] [Google Scholar]
- 9.Schneider JA, Aggarwal NT, Barnes L, Boyle P, Bennett DA. The neuropathology of older persons with and without dementia from community versus clinic cohorts. J Alzheimers Dis 2009;18:691–701 [DOI] [PMC free article] [PubMed] [Google Scholar]
- 10.Wilson RS, Beckett LA, Barnes LL, et al. Individual differences in rates of change in cognitive abilities of older persons. Psychol Aging 2002;17:179–193 [PubMed] [Google Scholar]
- 11.Bennett DA, Wilson RS, Schneider JA, et al. Natural history of mild cognitive impairment in older persons. Neurology 2002;59:198–205 [DOI] [PubMed] [Google Scholar]
- 12.Bennett DA, Bienias JL, Evans DA. Religious Orders Study: overview and change in cognitive and motor speed. Aging Neuropsychol Cogn 2004;11:280–303 [Google Scholar]
- 13.Bennett DA, Schneider JA, Buchman AS, et al. The Rush Memory and Aging Project: study design and baseline characteristics of the study cohort. Neuroepidemiology 2005;25:163–175 [DOI] [PubMed] [Google Scholar]
- 14.Wilson RS, Barnes LL, Krueger KR, et al. Early and late life cognitive activity and cognitive systems in old age. J Int Neuropsychol Soc 2005;11:400–407 [PubMed] [Google Scholar]
- 15.Boyle PA, Wilson RS, Aggarwal NT, Tang Y, Bennett DA. Mild cognitive impairment: risk of Alzheimer disease and rate of cognitive decline. Neurology 2006;67:441–445 [DOI] [PubMed] [Google Scholar]
- 16.Bennett DA, Schneider JA, Arvanitakis Z, Wilson RS. Overview and findings from the religious orders study. Curr Alzheimer Res 2012;9:628–645 [DOI] [PMC free article] [PubMed] [Google Scholar]
- 17.Bennett DA, Schneider JA, Buchman AS, et al. Overview and findings from the rush memory and aging project. Curr Alzheimer Res 2012;9:646–663 [DOI] [PMC free article] [PubMed] [Google Scholar]
- 18.Dörrie H. 100 Great Problems of Elementary Mathematics: Their History and Solution. New York: Dover Publications; 1965 [Google Scholar]
- 19.Berry CL, Greenwald SE. The validity of negative necropsy reports from metastases in solid organs. J Pathol 1987;151:239–240 [DOI] [PubMed] [Google Scholar]
- 20.Vinters HV, Ellis WG, Zarow C, et al. Neuropathologic substrates of ischemic vascular dementia. J Neuropathol Exp Neurol 2000;59:931–945 [DOI] [PubMed] [Google Scholar]
- 21.Ay H, Oliveira-Filho J, Buonanno FS, et al. Diffusion-weighted imaging identifies a subset of lacunar infarction associated with embolic source. Stroke 1999;30:2644–2650 [DOI] [PubMed] [Google Scholar]
- 22.Wessels T, Röttger C, Jauss M, et al. Identification of embolic stroke patterns by diffusion-weighted MRI in clinically defined lacunar stroke syndromes. Stroke 2005;36:757–761 [DOI] [PubMed] [Google Scholar]
- 23.Prabhakaran S, Gupta R, Ouyang B, et al. Acute brain infarcts after spontaneous intracerebral hemorrhage: a diffusion-weighted imaging study. Stroke 2010;41:89–94 [DOI] [PubMed] [Google Scholar]
- 24.Mouton PR. Principles and Practices of Unbiased Stereology: An Introduction for Bioscientists. Baltimore: Johns Hopkins University Press; 2002 [Google Scholar]
Associated Data
This section collects any data citations, data availability statements, or supplementary materials included in this article.