

Abstract
Hepatic steatosis is one complication patients may experience following clinical islet transplantation (CIT), yet the cause and consequences of this are poorly understood. The purpose of this case-control study was to examine the relationship between hepatic steatosis, metabolic parameters and graft function in an Albertan cohort of CIT recipients. Hepatic steatosis was detected by magnetic resonance imaging (MRI) in n = 10 cases age-matched with n=10 MRI-negative controls. Progression/regression of steatosis was determined by ultrasound (US) in cases. Hepatic steatosis first appeared 2.8 ± 2.2 (mean ± SD) years post-CIT, and lasted approximately 4.6 ± 2.0 years. In five cases steatosis resolved, with recurrence in two cases during the follow-up period (8.5 ± 3.2 years). No evidence of CIT causing deleterious effects on long-term liver function or graft outcome was observed.
Keywords: clinical islet transplantation, hepatic steatosis, magnetic resonance imaging, ultrasound, type 1 diabetes
Introduction
Clinical islet transplantation (CIT) is a useful treatment for select individuals with type 1 diabetes (T1D) experiencing frequent hypoglycemia and glycemic lability.1 However CIT has a number of risks related both to the procedure and side effects from immunosuppressive medications.2 Hepatic steatosis has been identified in 20–40% of CIT recipients, but the etiology and relationship to graft function remains unclear.3-5 The development of hepatic steatosis post-CIT may relate to the paracrine action of insulin secreted by the transplanted islets in the liver, causing increased localized hyperinsulinemia and fatty acid infiltration within hepatocytes adjacent to islet grafts.3 Whether fat accumulation in hepatocytes alters islet graft function or whether graft dysfunction contributes to hepatic steatosis is unclear. Initial reports suggested that hepatic steatosis in CIT was an indicator of islet graft survival since steatosis was not seen in individuals who lost graft function.6 In contrast, other studies have suggested that hepatic steatosis is associated with the need for supplementary exogenous insulin related to graft dysfunction.3,5,7
There is little information regarding long-term follow-up or outcomes related to hepatic steatosis in CIT recipients. Magnetic resonance imaging (MRI) and ultrasound (US) performed as part of routine clinical care in CIT recipients provide a noninvasive means of monitoring structural hepatic changes after CIT, including hepatic steatosis. The purpose of this study was to describe the natural history of hepatic US findings in a small cohort of CIT recipients with hepatic steatosis detected initially by MRI and to compare metabolic parameters of graft function in this cohort with a matched control group with no evidence of hepatic steatosis following CIT.
Results
Case and controls were well matched for pre-transplant demographic, anthropometric and biochemical characteristics (Tables 1 and 2) and similar immunosuppressive protocols were utilized; with the majority receiving daclizumab for induction, and sirolimus and tacrolimus for maintenance therapy (n = 7 vs. n = 9). A few patients received lymphodepleting agents for induction (alemtuzumab; n = 2 vs. n = 1 or thymoglobulin; n = 1 vs. n = 0, respectively) and maintenance with tacrolimus and mycophenolate (p > 0.05). The demographic, anthropometric and biochemical characteristics of cases and controls did not differ significantly from the remaining CIT recipients (data not shown).
Table 1. Clinical characteristics of subjects.
| All subjects | Steatosis cases | Controls | p | |
|---|---|---|---|---|
| n |
20 |
10 |
10 |
- |
| Male (%) |
7 (35%) |
3 (30%) |
4 (40%) |
- |
| Age at initial CIT (yr) |
38.8 ± 10.2 (24.3–56.2) |
38.7 ± 10.5 (24.9–56.2) |
38.8 ± 10.5 (24.3–56.1) |
0.98 |
| Pre-CIT weight (kg) |
67.0 ± 9.2 (53.2–90.0) |
67.9 ± 10.4 (54.6–90.0) |
66.2 ± 8.4 (53.2–79.3) |
0.69 |
| Pre-CIT height (cm) |
167.5 ± 9.1 (153.0–185.5) |
166.9 ± 10.3 (153.0–185.5) |
168.2 ± 8.2 (153.0–177.0) |
0.75 |
| Pre-CIT BMI (kg/m2) |
23.9 ± 2.8 (20.1–29.9) |
24.4 ± 3.1 (20.1–29.8) |
23.4 ± 2.5 (20.3–29.8) |
0.44 |
| Diabetes duration at CIT (yr) |
24.8 ± 11.4 (4.8–42.1) |
23.1 ± 8.8 (12.5–39.0) |
26.5 ± 13.7 (4.8–42.1) |
0.52 |
| Pre-CIT insulin use (units/kg) |
0.6 ± 0.2 (0.4–1.0) |
0.6 ± 0.1 (0.5–1.0) |
0.6 ± 0.2 (0.4–0.9) |
0.52 |
| Total number of CIT received | 2.7 ± 0.6 (2–4) | 2.7 ± 0.5 (2–3) | 2.6 ± 0.7 (2–4) | 0.71 |
Values represented as mean ± standard deviation (range). CIT represents first islet transplantation subject received.
Table 2. Pre-transplant biochemical characteristics of subjects.
| Reference range | All subjects | n | Steatosis cases | n | Controls | n | p | |
|---|---|---|---|---|---|---|---|---|
| HbA1c (%) |
4.3–6.1 |
8.3 ± 1.2 (6.4–10.6) |
19 |
8.8 ± 1.2 (6.7–10.6) |
9 |
8.0 ± 1.2 (6.4–10.4) |
10 |
0.17 |
| Fasting glucose (mmol/L) |
3.3–6.0 |
11.0 ± 4.3 (2.2–16.4) |
13 |
10.8 ± 5.3 (2.2–16.4) |
5 |
11.1 ± 3.9 (4.0–15.9) |
8 |
0.91 |
| TC (mmol/L) |
< 5.20 |
4.5 ± 1.0 (3.2–7.3) |
20 |
5.0 ± 1.0 (3.4–7.3) |
10 |
4.1 ± 0.7 (3.2–5.1) |
10 |
0.02 |
| LDL (mmol/L) |
< 2.50 |
2.5 ± 0.7 (1.4–4.3) |
20 |
2.8 ± 0.7 (1.4–4.3) |
10 |
2.2 ± 0.4 (1.5–2.6) |
10 |
0.02 |
| HDL (mmol/L) |
> 0.90 |
1.6 ± 0.4 (0.9–2.5) |
20 |
1.8 ± 0.3 (1.4–2.3) |
10 |
1.5 ± 0.5 (0.9–2.5) |
10 |
0.14 |
| TG (mmol/L) |
< 2.30 |
0.9 ± 0.5 (0.4–2.9) |
20 |
0.9 ± 0.7 (0.4–2.9) |
10 |
0.9 ± 0.3 (0.5–1.2) |
10 |
0.81 |
| ALP (IU/L) |
30–130 |
65.1 ± 20.5 (15.0–104.0) |
20 |
68.7 ± 16.3 (46.0–94.0) |
10 |
61.4 ± 24.3 (15.0–104.0) |
10 |
0.44 |
| AST (IU/L) |
< 40 |
26.0 ± 11.4 (14.0–66.0) |
20 |
28.6 ± 13.8 (16.0–66.0) |
10 |
23.4 ± 8.3 (14.0–40.0) |
10 |
0.32 |
| ALT (IU/L) |
< 40 |
17.0 ± 8.0 (10.0–37.0) |
17 |
14.5 ± 4.3 (10.0–22.0) |
8 |
19.8 ± 9.8 (10.0–37.0) |
9 |
0.18 |
| Total bilirubin (umol/L) | < 20 | 12.7 ± 13.6 (1.0–53.0) |
20 | 6.3 ± 4.5 (1.0–15.0) | 10 | 19.0 ± 16.8 (4.0–53.0) | 10 | 0.03 |
Values represented as mean ± standard deviation (range).
The average duration of follow-up (between initial CIT and most recent MRI or US exam) was 8.5 ± 3.2 (0.5–10.9) years in cases. Subjects were 40.5 ± 10.4 (25.2–56.6) years of age when steatosis was detected. Subjects had undergone 3 ± 0.9 (1–4) MRI exams and 9 ± 2.5 (4–12) US exams. The mean interval between CIT and first detection of hepatic steatosis was 2.3 ± 1.9 y for MRI and 2.8 ± 2.2 y for US.
The progression/regression of hepatic steatosis detected by US is illustrated in Figure 1. In one subject (#9 in Figure 1), despite the consistent presence of hepatic steatosis on MRI, the presence of steatosis could not be confirmed by US imaging. Hepatic steatosis persisted for 4.6 ± 2.0 (0.1–7.8) years, and resolved in 5 (50%) cases after a mean of 4.3 ± 1.4 y, with one case resolving within 15 mo. In two subjects (#1 and #3) there was a recurrence of hepatic steatosis after an interval of 1.0–1.8 y, which persisted for up to 2 y. There was no clear relationship between additional islet infusions and the resolution or recurrence of steatosis.
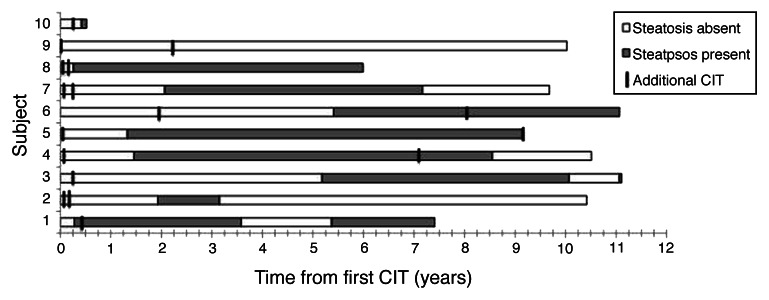
Figure 1. Time course of appearance of hepatic steatosis in cases on ultrasound examination. Shaded bars represent the period when steatosis was apparent on US, while open bars represent absence of fat on US. The period of observation begins with the initial transplant. Subsequent islet infusions are marked. In one case (subject #9) the presence of hepatic steatosis identified by MRI could not be confirmed by US imaging.
At the time steatosis was first detected in cases, there were no significant differences from controls in any biochemical parameters or measures of graft function (Table 3), or use of supplementary exogenous insulin (4 cases vs. 3 controls; p = 0.78) or dosing (0.1 ± 0.2 vs. 0.1 ± 0.1 units/kg, respectively; p = 0.27).
Table 3. Biochemical characteristics of cases and controls at time of hepatic steatosis detection.
| Reference range | Steatosis cases | n | Controls | n | p | |
|---|---|---|---|---|---|---|
| HbA1c (%) |
4.3–6.1 |
6.8 ± 0.7 (6.1–8.3) |
9 |
6.6 ± 0.8 (5.1–7.5) |
10 |
0.5 |
| Fasting glucose (mmol/L) |
3.3–6.0 |
7.2 ± 1.3 (5.5–8.7) |
4 |
7.2 ± 1.9 (5.1–10.9) |
8 |
1 |
| Stimulated C-peptide (nmol/L) |
0.3–1.32 |
0.46 ± 0.31 (0.09–1.01) |
9 |
0.41 ± 0.31 (0.03–0.78) |
10 |
0.74 |
| Stimulated c-peptide: glucose |
|
0.12 ± 012 (0.001–0.39) |
10 |
0.16 ± 0.12 (0.02–0.34) |
9 |
0.5 |
| TC (mmol/L) |
< 5.20 |
4.8 ± 0.0 (4.8–4.9) |
2 |
4.2 ± 0.5 (3.5–4.9) |
5 |
0.21 |
| LDL (mmol/L) |
< 2.50 |
2.6 ± 0.3 (2.4–2.7) |
2 |
2.3 ± 0.6 (1.7–2.9) |
5 |
0.64 |
| HDL (mmol/L) |
> 0.90 |
1.8 ± 0.7 (1.3–2.3) |
2 |
1.3 ± 0.2 (1.0–1.6) |
5 |
0.17 |
| TG (mmol/L) |
< 2.30 |
1.1 ± 0.8 (0.5–1.6) |
2 |
1.3 ± 0.6 (0.7–2.2) |
5 |
0.7 |
| ALP (IU/L) |
30–130 |
98.7 ± 111.3 (41.0–350.0) |
7 |
78.1 ± 23.5 (49.0–124.0) |
7 |
0.64 |
| AST (IU/L) |
< 40 |
57.7 ± 46.5 (16.0–135.0) |
7 |
28.3 ± 8.6 (17.0–39.0) |
6 |
0.16 |
| ALT (IU/L) |
< 40 |
59.4 ± 50.3 (15.0–141.0) |
7 |
25.0 ± 7.1 (20.0–30.0) |
2 |
0.39 |
| Total bilirubin (umol/L) | < 20 | 7.4 ± 3.0 (2.0–12.0) | 7 | 9.4 ± 4.4 (3.0–17.0) | 7 | 0.34 |
Values represented as mean ± standard deviation (range). Time of steatosis detection for determined within ± 1 mo of steatosis detection in cases and the corresponding time-point for matched controls. Stimulated c-peptide:glucose ratio is c-peptide at 90 min after MMTT divided by glucose at 90 min after MMTT
One year post-initial CIT, cases tended to have lower stimulated c-peptide levels than controls (0.49 ± 0.27 vs. 0.72 ± 0.25 nmol/L; p = 0.07) with two cases (no controls) becoming c-peptide negative. Five cases were receiving supplementary exogenous insulin vs. two controls. At 5 y post-initial CIT, 6/10 cases and 6/10 controls were c-peptide positive, but no cases and only two controls were insulin independent. There were no differences in graft survival (persistence of c-peptide) or insulin independence by Kaplan Meier analysis (Fig. 2).
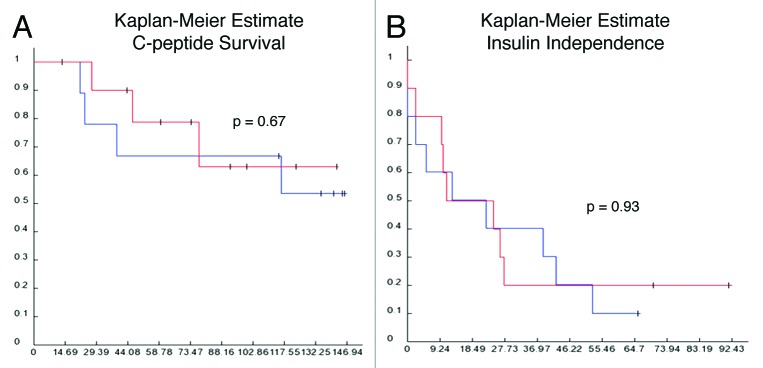
Figure 2. Graft survival. Kaplan-Meier curves for c-peptide survival (A) and insulin independence (B), where blue line = cases with steatosis and red line = controls without steatosis.
Discussion
This case-control study provides longitudinal data on the natural history of hepatic steatosis in a small, but carefully studied cohort of CIT recipients over 8 y of follow-up. After CIT, hepatic steatosis was relatively common and may be detected as an incidental finding on routine abdominal imaging. It is reassuring that spontaneous regression of steatosis is common and there is no evidence of progressive deterioration in liver function tests. Although liver biopsy is the gold standard for defining the presence of steatosis its invasive nature is not ideal for identifying the development or progression of steatosis post-CIT considering the high risk of the procedure.4 Furthermore, the patchy distribution of steatosis after CIT increases the risk of sampling errors compared with other conditions (e.g., non-alcoholic steatohepatitis) where hepatic steatosis is uniform.
US and MRI are non-invasive tools which can detect steatosis and repeated examinations are feasible. Steatosis may appear as heterogeneous echotexture on routine US, but out-of-phase sequences are required to detect fat by MRI and may not be part of routine liver protocols. Although US has been shown to be both specific (77–100%) and sensitive (60–95%) in detecting moderate to severe steatosis (> 30%) and correlates to biopsy proven steatosis, MRI is thought to be the best noninvasive method to detect steatosis but is expensive and harder to access.8-13 US exams have lower costs, are easy to access and are well tolerated by subjects. US may be less sensitive to detect more minor degrees of steatosis which may explain why one case of MRI detected steatosis could not be confirmed by US. MRIs were generally conducted only at year 1 and 5 post-CIT, while US were conducted 3-times more frequently. Since the metabolic and functional status of islet transplants are dynamic, this report focused on US changes over time in an attempt to identify any relationships between the evolution of steatosis and changes in metabolic status.
Hepatic steatosis was detected in 19% (n = 10/54) of our cohort. Although slightly less prevalent, this finding is consistent with other reports on hepatic steatosis in individuals with T1D (40%), CIT recipients (20–40%), and the general population (13–35%), while it is less prevalent compared with those with T2D, high BMI, and certain ethnicities.3-5,14,15 Despite the relatively higher prevalence of hepatic steatosis in T1D, it was not observed pre-CIT in our cohort. Furthermore, the distribution of steatosis observed in CIT recipients appears different; it is more focal in nature rather than diffuse, which may be related to localized (rather than systemic) hyperinsulinemia as a result of graft dysfunction (Figs. 3 and 4).3-5,7,10,12-14,16,18
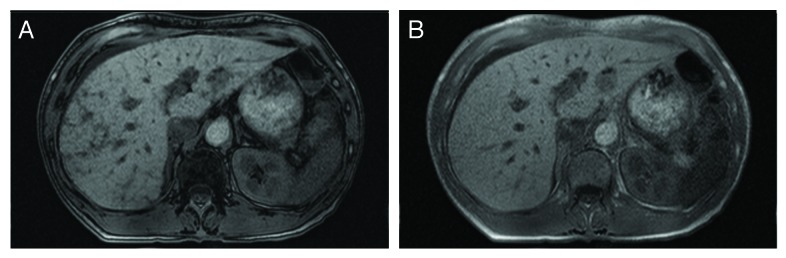
Figure 3. MRI of hepatic steatosis. MR images from an islet transplant recipient with focal hepatic steatosis after clinical islet transplant. Out of phase and in-phase T-1 images are shown in (A) and (B), respectively. The loss of signal on the out of phase images indicates the presence of fat. These images are of a CIT recipient who is not resident in Alberta and who was included as a case in our previous report (4).

Figure 4. Histology image of hepatic steatosis. Histology from liver biopsy from an islet transplant recipient with focal hepatic steatosis after clinical islet transplant whose MRI is shown in Figure 2. Staining is with hematoxylin and eosin. Multiple vacuoles of fat have been deposited in the liver. The vacuoles did not stain for glycogen nor was hepatocellular glycogenosis observed, although normal amounts of glycogen are apparent in hepatocytes.
The time to hepatic steatosis detection in our study (2 y) and others (0.5–1 y) suggest that a prolonged stimulus is needed for the development of hepatic steatosis, although clearly the interval between transplant and the appearance of steatosis is variable and only a minority develop steatosis.
Biochemical parameters did not differ significantly between cases and controls, with the exception of pre-CIT TC, LDL and bilirubin. However, these concentrations did not exceed normal reference ranges and it is not clear if they contributed to the development of hepatic steatosis or indicate susceptibility to steatosis. There were no significant differences in liver function tests (AST, ALT, ALP and total bilirubin) between cases, controls and other CIT patients followed by our clinic (results not shown).
Our study did not find any significant differences in measures of graft function between cases and controls at time of steatosis detection. The need for exogenous insulin, reflecting a degree of islet graft dysfunction, has been associated with an increased risk for steatosis.3 However, supplementary exogenous insulin use did not differ between our cases and controls. Steatosis seems to be associated with graft dysfunction however longer term outcomes (c-peptide positivity and insulin independence) were inferior in cases compared with controls at 1 and 5 y post-transplant. It is difficult to attribute either causality or even the direction of association since graft dysfunction could lead to local hyperinsulinemia or alternatively steatosis may lead to lipotoxicity.
It is reassuring that steatosis has not been associated with any adverse sequelae despite its persistence for several years. The regression of steatosis in half the cases is also reassuring, although the recurrence of steatosis in two subjects raises questions about the reliability of ultrasound for surveillance where there are lesser degrees of fat infiltration. Due to the small sample size it is difficult to ascertain why some subjects’ steatosis resolved while others did not.
Limitations to this study include those inherent to retrospective research. Laboratory results were not always available at time of steatosis detection; therefore a range of ± 1 mo was used. We focused our review on a subset of subjects resident in Alberta with available MRI to limit heterogeneity between subjects, as patients from other parts of the country did not routinely have imaging as frequently, and usually did not have MRI studies. This approach resulted in a small (albeit well controlled) sample, which should be considered when interpreting the data.
Our findings suggest that the presence of hepatic steatosis post-CIT is benign and reversible. Hepatic steatosis was not found to be associated with adverse clinical outcomes (i.e., significant negative biochemical aberrations or increased markers of graft loss/dysfunction) and it resolved in half of the cases. Further prospective investigation on this topic in a larger scale study is warranted to extend the findings of our research, which provides unique longitudinal insights on the natural history of hepatic steatosis in a cohort of CIT recipients.
Patients and Methods
Between 1999 and 2011, 138 patients with T1D underwent CIT at the University of Alberta. Only subjects resident in the province of Alberta who had undergone both MRI and US imaging after CIT were included in this preliminary report. MRI was generally performed at 1 and 5 y post CIT. Recipients from other provinces (n = 54) were excluded from this analysis because the frequency of radiological monitoring was insufficient and not all original images were available for review. Ethics approval was obtained from the Human Research Ethics Board at the University of Alberta.
Identification of hepatic steatosis
54 of 84 Albertan subjects had MRI exam reports available. Cases of hepatic steatosis were defined on the basis of the presence of decreased signal on out-of-phase T1 MRI images of hepatic steatosis (non-invasive gold standard).10,16 Hepatic steatosis (positive/negative) was also assessed by US imaging performed prior to CIT and throughout post-transplant follow-up. No subjects had evidence of hepatic steatosis prior to transplant. Ten patients (18.5%) had MRI-confirmed hepatic steatosis. These cases were matched to controls for age (n = 10). Control subjects had no evidence of steatosis on any MRI. All available case US scans (1999–2011) were reviewed by two radiologists who were not aware of the metabolic status of the subjects.
Clinical characteristics, biochemical parameters and graft function of subjects
Demographic, anthropometric and biochemical parameters were reviewed pre-and-post initial CIT and at the time (± 2 weeks) steatosis was first detected on US to examine potential relationships with metabolic and graft function.
Graft function at time of US steatosis detection ± 6 mo in cases and the corresponding time-point for their respective controls was assessed according to glucose and c-peptide responses to a standardized mixed-meal tolerance test (Ensure meal test), and supplementary exogenous insulin requirements (following most recent CIT and at mixed-meal tolerance test).17 Long-term graft function was assessed by c-peptide status and exogenous insulin use at 1 and 5 y post-CIT.
Statistical analysis
Clinical and biochemical data were reported descriptively as mean ± standard deviation (range). Unpaired Student t-tests were used to compare data from cases and controls. Analyses were performed using Microsoft Excel 2010 and Statistical Analysis Software (SAS; version 9.1 SAS Institute, Cary, NC, USA). P-values < 0.05 were considered statistically significant.
Disclosure of Potential Conflicts of Interest
No potential conflicts of interest were disclosed.
Acknowledgments
Thank you to Sara Campbell for assistance in data collection.
Glossary
Abbreviations:
- ALP
alkaline phosphatase
- ALT
alanine aminotransferase
- AST
aspartate aminotransferase
- BMI
body mass index
- CIT
clinical islet transplantation
- FBG
fasting blood glucose
- HbA1c
hemoglobin A1c
- HDL
high density lipoprotein-cholesterol
- LDL
low density lipoprotein-cholesterol
- MRI
magnetic resonance imaging
- OTTR
organ transplant tracking record
- TC
total cholesterol
- TG
triglycerides
- T1D
type 1 diabetes
- T2D
type 2 diabetes
- US
ultrasound
- vs.
versus
Footnotes
Previously published online: www.landesbioscience.com/journals/islets/article/24058
References
- 1.Shapiro AMJ, Lakey JRT, Ryan EA, Korbutt GS, Toth E, Warnock GL, et al. Islet transplantation in seven patients with type 1 diabetes mellitus using a glucocorticoid-free immunosuppressive regimen. N Engl J Med. 2000;343:230–8. doi: 10.1056/NEJM200007273430401. [DOI] [PubMed] [Google Scholar]
- 2.Ryan EA, Paty BW, Senior PA, Shapiro AM. Risks and side effects of islet transplantation. Curr Diab Rep. 2004;4:304–9. doi: 10.1007/s11892-004-0083-8. [DOI] [PubMed] [Google Scholar]
- 3.Bhargava R, Senior PA, Ackerman TE, Ryan EA, Paty BW, Lakey JRT, et al. Prevalence of hepatic steatosis after islet transplantation and its relation to graft function. Diabetes. 2004;53:1311–7. doi: 10.2337/diabetes.53.5.1311. [DOI] [PubMed] [Google Scholar]
- 4.Toso C, Isse K, Demetris AJ, Dinyari P, Koh A, Imes S, et al. Histologic graft assessment after clinical islet transplantation. Transplantation. 2009;88:1286–93. doi: 10.1097/TP.0b013e3181bc06b0. [DOI] [PubMed] [Google Scholar]
- 5.Venturini M, Angeli E, Maffi P, Losio C, Pozzi P, Paties C, et al. Liver focal fatty changes at ultrasound after islet transplantation: an early sign of altered graft function? Diabet Med. 2010;27:960–4. doi: 10.1111/j.1464-5491.2010.03035.x. [DOI] [PubMed] [Google Scholar]
- 6.Markmann JF, Rosen M, Siegelman ES, Soulen MC, Deng S, Barker CF, et al. Magnetic resonance-defined periportal steatosis following intraportal islet transplantation: a functional footprint of islet graft survival? Diabetes. 2003;52:1591–4. doi: 10.2337/diabetes.52.7.1591. [DOI] [PubMed] [Google Scholar]
- 7.Maffi P, Angeli E, Bertuzzi F, Paties C, Socci C, Fedeli C, et al. Minimal focal steatosis of liver after islet transplantation in humans: a long-term study. Cell Transplant. 2005;14:727–33. doi: 10.3727/000000005783982567. [DOI] [PubMed] [Google Scholar]
- 8.Shannon A, Alkhouri N, Carter-Kent C, Monti L, Devito R, Lopez R, et al. Ultrasonographic quantitative estimation of hepatic steatosis in children With NAFLD. J Pediatr Gastroenterol Nutr. 2011;53:190–5. doi: 10.1097/MPG.0b013e31821b4b61. [DOI] [PMC free article] [PubMed] [Google Scholar]
- 9.Narciso-Schiavon JL, Schiavon LdeL, Carvalho-Filho RJ, Hayashida DY, Wang JHJ, Souza TS, et al. Clinical characteristics associated with hepatic steatosis on ultrasonography in patients with elevated alanine aminotransferase. Sao Paulo Med J. 2010;128:342–7. doi: 10.1590/S1516-31802010000600006. [DOI] [PMC free article] [PubMed] [Google Scholar]
- 10.Rinella ME, McCarthy R, Thakrar K, Finn JP, Rao SM, Koffron AJ, et al. Dual-echo, chemical shift gradient-echo magnetic resonance imaging to quantify hepatic steatosis: Implications for living liver donation. Liver Transpl. 2003;9:851–6. doi: 10.1053/jlts.2003.50153. [DOI] [PubMed] [Google Scholar]
- 11.Mehta SR, Thomas EL, Bell JD, Johnston DG, Taylor-Robinson SD. Non-invasive means of measuring hepatic fat content. World J Gastroenterol. 2008;14:3476–83. doi: 10.3748/wjg.14.3476. [DOI] [PMC free article] [PubMed] [Google Scholar]
- 12.Bohte AE, van Werven JR, Bipat S, Stoker J. The diagnostic accuracy of US, CT, MRI and 1H-MRS for the evaluation of hepatic steatosis compared with liver biopsy: a meta-analysis. Eur Radiol. 2011;21:87–97. doi: 10.1007/s00330-010-1905-5. [DOI] [PMC free article] [PubMed] [Google Scholar]
- 13.Fishbein M, Castro F, Cheruku S, Jain S, Webb B, Gleason T, et al. Hepatic MRI for fat quantitation: its relationship to fat morphology, diagnosis, and ultrasound. J Clin Gastroenterol. 2005;39:619–25. doi: 10.1097/00004836-200508000-00012. [DOI] [PubMed] [Google Scholar]
- 14.Ismail MH. Nonalcoholic fatty liver disease and type 2 diabetes mellitus: the hidden epidemic. Am J Med Sci. 2011;341:485–92. doi: 10.1097/MAJ.0b013e3182018598. [DOI] [PubMed] [Google Scholar]
- 15.Williamson RM, Price JF, Glancy S, Perry E, Nee LD, Hayes PC, et al. Edinburgh Type 2 Diabetes Study Investigators Prevalence of and risk factors for hepatic steatosis and nonalcoholic Fatty liver disease in people with type 2 diabetes: the Edinburgh Type 2 Diabetes Study. Diabetes Care. 2011;34:1139–44. doi: 10.2337/dc10-2229. [DOI] [PMC free article] [PubMed] [Google Scholar]
- 16.Mitchell DG, Kim I, Chang TS, Vinitski S, Consigny PM, Saponaro SA, et al. Fatty liver: chemical shift saturation and phase-difference MR imaging techniques in animals, phantoms and humans. Invest Radiol. 1991;26:1041–52. doi: 10.1097/00004424-199112000-00002. [DOI] [PubMed] [Google Scholar]
- 17.Ryan EA, Lakey JRT, Rajotte RV, Korbutt GS, Kin T, Imes S, et al. Clinical outcomes and insulin secretion after islet transplantation with the Edmonton protocol. Diabetes. 2001;50:710–9. doi: 10.2337/diabetes.50.4.710. [DOI] [PubMed] [Google Scholar]
- 18.Targher G, Bertolini L, Padovani R, Rodella S, Zoppini G, Pichiri I, et al. Prevalence of non-alcoholic fatty liver disease and its association with cardiovascular disease in patients with type 1 diabetes. J Hepatol. 2010;53:713–8. doi: 10.1016/j.jhep.2010.04.030. [DOI] [PubMed] [Google Scholar]