

Abstract
Background and Aims
Phosphorus deficiency is a major limiting factor for crop yield worldwide. Previous studies revealed that PHR1 and it homologues play a key role in regulating the phosphate starvation response in plants. However, the function of PHR homologues in common wheat (Triticum aestivum) is still not fully understood. The aim of the study was to characterize the function of PHR1 genes in regulating phosphate signalling and plant growth in wheat.
Methods
Wheat transgenic lines over-expressing a wheat PHR1 gene were generated and evaluated under phosphorus-deficient and -sufficient conditions in hydroponic culture, a soil pot trial and two field experiments.
Key Results
Three PHR1 homologous genes Ta-PHR1-A1, B1 and D1 were isolated from wheat, and the function of Ta-PHR1-A1 was analysed. The results showed that Ta-PHR1-A1 transcriptionally activated the expression of Ta-PHT1.2 in yeast cells. Over-expressing Ta-PHR1-A1 in wheat upregulated a subset of phosphate starvation response genes, stimulated lateral branching and improved phosphorus uptake when the plants were grown in soil and in nutrient solution. The data from two field trials demonstrated that over-expressing Ta-PHR1-A1 increased grain yield by increasing grain number per spike.
Conclusions
TaPHR1 is involved in phosphate signalling in wheat, and was valuable in molecular breeding of crops, with improved phosphorus use efficiency and yield performance.
Keywords: Triticum aestivum, PHR1, phosphate starvation response, phosphorus uptake, grain yield, lateral root
INTRODUCTION
The world is facing an immense challenge to increase food productivity for its growing population. As phosphorus (P) fertilizers are essential for growing our food, annual consumption of P fertilizers has increased rapidly in the past decades and is expected to increase by 50–100 % by 2050 (Cordell et al., 2009). However, the majority of P applied to soil is immobilized and becomes unavailable for plants; the recovery of applied P by crops in a growing season is often low (Schachtman et al., 1998; Vance et al., 2003). Furthermore, P fertilizer is mainly made from the non-renewable phosphate rock, which is expected to run out in the near future (Cordell et al., 2009). Therefore, systematic approaches need to be made to use soil P and fertilizer P sustainably and efficiently, including development of P-efficient crop varieties (Lynch, 2011).
It is well documented that genetic differences in P use efficiency exist among plant species and genotypes within a species, indicating that it is possible to improve P use efficiency of plants through a genetic approach. Conventional selection methods have been shown to be successful in breeding crops with improved P use efficiency. For example, the CIMMYT (International Maize and Wheat Improvement Centre) wheat programme has selected wheat cultivars that can efficiently acquire P under low P conditions, but also respond to P applications (Manske et al., 2000). As P has low mobility and high fixation in soils (Schachtman et al., 1998), selecting root traits with an increased root–soil contact area and ability to mobilize unavailable P is crucial in improving P use efficiency (Manske et al., 2000). However, these root traits are hidden in the soil; therefore, root breeding through conventional phenotypic selection is time consuming and destructive. It has been shown that quantitative trait loci (QTLs) for root morphology and architecture are linked to those for P acquisition efficiency in soybean (Glycine max), maize (Zea mays) and wheat (Triticum aestivum) (Zhu et al., 2005; Liang et al., 2010; Y. Z. Ren et al., 2012). This suggests that marker-assisted selection will facilitate efficient selection for root traits in root breeding for P use efficiency.
Besides conventional breeding and marker-assisted selection, gene modification has also successfully improved P use efficiency of crops. In response to P deficiency, plants have evolved a wide range of morphological, physiological and biochemical strategies to improve P mobilization and uptake from soil (Raghothama, 1999; Cheng et al., 2011; Plaxton and Tran, 2011). Alterations in root architecture are important to enable plants to explore new Pi resources in the soil more efficiently. Under P-deficient conditions, plants increase their root hair length and density, and lateral or adventitious root number and length (Lopez-Bucio et al., 2002; Lynch, 2011). Recently, a β-expansin gene, Gm-EXPB2, has been shown to regulate root architecture responses to Pi starvation in soybean, and over-expressing Gm-EXPB2 significantly improves P uptake and growth of soybean (Guo et al., 2011). Since most of the soil P presents in sparingly soluble forms which can be mobilized by root-secreted protons (H+), low molecular weight organic anions and phosphatase enzymes (Cordell et al., 2009), stimulating root secretions through gene modification (e.g. over-expressing phosphatase) has been shown to be effective in enhancing Pi acquisition and growth of crops (Tian et al., 2012). For instance, over-expressing a wheat malate transporter (Ta-ALMT1) was shown to enhance P uptake and grain yield of barley (Hordeum vulgare) grown on an acid soil (Delhaize et al., 2009). The phosphate transport gene family PHT1 is pivotal for Pi uptake from soil and the transportation of Pi from root to shoot (Chiou et al., 2001; Schunmann et al., 2004; Nagarajan et al., 2011). Over-expression of the PHT1 gene facilitates Pi uptake in transgenic rice plants, and even results in excess P accumulation toxic to plant development (Jia et al., 2011); however, it does not function in increasing Pi uptake in transgenic barley plants grown in nutrient solution and soil (Rae et al., 2004).
The complex gene network responding to Pi starvation is mediated by a number of regulators (Schachtman and Shin, 2007; Nilsson et al., 2010; Chiou and Lin, et al., 2011; Hammond and White, 2011). Over-expression of a transcription factor, PTF1 (Pi starvation induced transcription factor 1), enhances P uptake and yield under P-deficient conditions in both rice and maize (Yi et al., 2005; Li et al., 2011), showing the importance of transcription factors in improving P use efficiency of crops. In the signalling network in sensing P availability, the MYB-CC (coiled-coil) type transcription factor PHR1 plays a central role (Chiou and Lin et al., 2011). PHR1 was first reported to regulate a small subset of Pi starvation-inducible genes in arabidopsis by binding as a dimer to the cis-element P1BS (GNATATNC) in the promoter region of its downstream gene (Rubio et al., 2001). Defective mutation in At-PHR1 impairs a broad range of Pi starvation responses, including the responsiveness of various Pi starvation-inducible genes, root morphology and metabolic responses (Rubio et al., 2001). Recent genome-wide analysis revealed that the majority of Pi starvation-inducible genes contain the P1BS element, and hence the PHR1 gene has been considered to play a more important role than had been previously reported (Muller et al., 2007; Nilsson et al., 2007, 2010). At-PHR1 and its homologues PHL1 in arabidopsis and Os-PHR2 in rice regulate a set of Pi starvation-inducible genes, including those involving Pi uptake and redistribution (Rubio et al., 2001; Nilsson et al., 2007; Zhou et al., 2008; Bustos et al., 2010). Over-expression of PHR1 in arabidopsis results in strongly increased Pi uptake irrespective of P regime, providing a useful approach for molecular breeding of plants towards more efficient Pi uptake and assimilation (Nilsson et al., 2007). However, enhanced Pi uptake by over-expressing PHR1 does not essentially improve plant growth. For example, over-expression of Os-PHR2 in rice dramatically increases Pi uptake under a range of P supply levels, but it greatly inhibits growth and yield of rice (Zhou et al., 2008). The growth retardation mediated by Os-PHR2 may be caused by toxicity of excessive Pi accumulation in shoots, or by some unknown genetic factor(s) regulated by Os-PHR2 (Wu and Xu, 2010).
Wheat is one of the most important food crops in the world. Worldwide wheat production annually consumes 6·5 Mt of P2O5 (approx. 40 % of P used by cereal crops), much higher than used by other cereals, including rice and maize (FAO, 2006). Therefore, improving P use efficiency of wheat is important in sustainable use of P resources. To breed wheat with improved P use efficiency, understanding the Pi signalling network in wheat is important. Presently, only a few Pi starvation-inducible genes have been cloned and their expression patterns have been analysed, including various PHT1 genes (Davies et al., 2002; Glassop et al., 2005; Tittarelli et al., 2007), thus the Pi signalling network in wheat remains largely unknown. Although improving P use efficiency via transgenic modification has been reported in a number of crops (Ramaekers et al., 2010; Tian et al., 2012), studies of transgenic wheat with improved P use efficiency are still lacking. Here, we isolated three wheat PHR1 genes (Ta-PHR1-A1, B1 and D1) with homology to At-PHR1, and characterized the function of Ta-PHR1-A1 in regulating the Pi starvation response. We found that Ta-PHR1-A1 is involved in Pi signalling in wheat and, when over-expressed, it increased P uptake and grain yield of wheat. Our research promotes the understanding of Pi signalling in wheat, and provides valuable gene resource for breeding wheat with improved P use efficiency and yield.
MATERIALS AND METHODS
Gene cloning
A dbEST search was performed on the web pages of the National Center for Biotechnology Information (NCBI; http://www.ncbi.nlm.nih.gov/nucest/) for the At-PHR1 protein sequence (NP_194590). Primers (Ta-PHR1CF and Ta-PHR1CR, Supplementary Data Table S1) were designed according to identified expressed sequence tags (ESTs) containing At-PHR1 orthologues to amplify specific fragments from a wheat cDNA template. Full-length cDNAs were amplified from wheat variety Xiaoyan 54, designated as Ta-PHR1. Thereafter, three full-length genomic DNA sequences of Ta-PHR1 were isolated by screening a bacterial artificial chromosome (BAC) library of Xiaoyan 54. A set of nullisomic-tetrasomic and deletion lines of Triticum aestivum ‘Chinese Spring’ were used for determining the chromosomal localization of the Ta-PHR1 genes.
Gene alignment and phylogenetic analysis
Gene structures of Ta-PHR1 genes were assembled by alignment of cDNAs with genomic sequences via the Megalign program (DNAstar, Madison, WI, USA). Multiple sequence alignment of the MYB and the predicted CC conserved domains was carried out using the ClustalX 1·81 program (Thompson et al., 1997) with default multiple alignment parameters, and viewed by GeneDoc 3·2 with default BLOSUM score. The phylogenetic analysis was performed by the Neighbor–Joining method. The phylogenetic tree was constructed using PHYLIP version 3.5c (http://bioweb.pasteur.fr) with a bootstrap analysis of 100 resampling replications as described previously (Zhou et al., 2008). The protein sequences for alignment were extracted from NCBI.
Transient analysis of Ta-PHR1-A1 protein–protein interaction in arabidopsis protoplasts
The coding sequence of Ta-PHR1-A1 was amplified with gene-specific primers (Ta-PHR1_BiFC_F and Ta-PHR1_p101-CFP_R, Supplementary Data Table S1) and was cloned into pX-nYFP and pX-cYFP vectors using the Gateway-compatible vector cloning system (Gampala et al., 2007) to generate constructs of BiFC-Ta-PHR1-A1-nYFP and BiFC-Ta-PHR1-A1-cYFP, respectively. The arabidopsis protoplast isolation and transformation were carried out as described elsewhere (Yuan et al., 2008). A confocal laser scanning microscope (Olympus FV500, Japan) was used to detect the fluorescence signals at an excitation wavelength of 488 nm and emission wavelength of 506–538 nm, and the autofluorescence of chloroplasts was observed at an excitation wavelength of 488 nm and emission wavelength of 664–696 nm.
Analysis of Ta-PHR1-A1 regulation of its target gene Ta-PHT1.2 in yeast cells
Yeast two-hybrid analysis was performed according to the protocol of the Hybri-Zap two-hybrid system as described by the manufacturer (Stratagene, La Jolla, CA, USA). The coding sequence of Ta-PHR1-A1 was integrated into pAD-GAL4 and pBD-GAL4 to generate the plasmids pAD-GaL4-Ta-PHR1-A1 and pBD-GaL4- Ta-PHR1-A1, respectively.
The promoter of Ta-PHT1.2 (proTa-PHT1.2) was isolated from Xiaoyan 54 using the PCR primer pair proTa-PHT1.2FK and proTa-PHT1.2RS (Supplementary Data Table S1), and was then replaced by the 2× 35S promoter of the pJIT166 plasmid. The β-glucuronidase (GUS) expression cassette (proTa-PHT1.2::GUS::TCaMV) was cut out from the pJIT166 derivatives, and was integrated into pBD-GaL4-Ta-PHR1-A1and pBD-GAL4 to generate yeast expression plasmids pBD-Ta-PHR1-A1-proTa-PHT1.2::GUS and pBD-proTa-PHT1.2::GUS, respectively. These plasmids were then introduced into yeast strain YRG-2 alone or in pairs with pAD-GaL4-Ta-PHR1-A1. A filter lift assay of LacZ reporter gene activity and total protein and MU quantification were performed as previously described (Yuan et al., 2008).
Generation of transgenic wheat plants with Ta-PHR1-A1
In order to generate the vector for wheat transformation, the maize Ubiquitin promoter (pUbi) was subcloned into the PstI site of pAHC25 (Christensen et al., 1992), resulting in a vector named pUbi-pAHC25. Then the Ta-PHR1-A1 cDNA was inserted into the NotI site of pUbi-pAHC25, resulting in the construct pUbi::Ta-PHR1-pAHC25. The construct was transformed into the immature embryos of wheat variety Shi4185 via the particle bombardment method (Becker et al., 1994). Shi4185 is a commercial winter wheat variety released in 1999, and was used as the control variety in the National Wheat Trial in the North of Huanghuai Region until 2011.
The insertion of pUbi::Ta-PHR1-pAHC25 in the chromosomes of the transgenic lines was detected by fluorescence in situ hybridization (FISH). The seeds of the wild type Shi4185 and the T4 transgenic lines Ov-1 and Ov-2 were germinated at 20 °C for 3 d. The root tips were treated with nitrous oxide for 2 h and then treated with 90 % acetic acid on ice for 30 min. The treated root tips were stored in 70 % ethanol at –20 °C for future analysis by FISH. FISH was performed according to the methods described previously (Kato et al., 2004; Han et al., 2006), by using the linearized pUbi::Ta-PHR1-pAHC25 as probe.
Hydroponic and soil pot experiments
The wild type and the T4 transgenic lines Ov-1 and Ov-2 were used in the hydroponic culture, soil pot experiment and field trials. The hydroponic culture was carried out in a growth chamber which was set at 20 ± 1 °C, 50–70 % relative humidity and a photon fluence rate of 300 µmol photons m−2 s−1 with a 16 h day/8 h night cycle. Two treatments were used, the Pi-sufficient nutrient solution (high P) contained 200 µm KH2PO4 as described previously (Y. Z. Ren et al., 2012), and the Pi-deficient nutrient solution (low P) contained 10 µm KH2PO4 and an additional 190 µm KCl. Seeds were germinated in saturated CaSO4 solution for 7 d at 20 °C, and then the germinated seeds with residual endosperm removed were transferred to plastic pots containing 1 L of nutrient solution. The nutrient solution was refreshed every day and its pH was adjusted to 6·0 with dilute HCl and KOH before refreshing. The pots each contained three plants and were air-aerated and placed randomly in the growth chamber. For evaluating plant growth and P uptake (HC trial 1), the plants were grown in the high and low P nutrient solutions for 21 d, and then the shoots and roots were collected separately to measure dry weight, root morphological parameters and total P concentration. For detection of gene expression (HC trial 2), the plants were grown in the high and low P nutrient solutions for 7 d, and then the shoots and roots were collected separately for future analysis.
The soil pot trial was conducted using a calcareous soil with an Olsen-P level of 5·9 mg kg−1. The soil was collected from the experimental station of the Institute of Genetics and Developmental Biology (IGDB), Chinese Academy of Sciences in Beijing. The trial was carried out from 2 March to 30 April in 2009 (60 d) and consisted of three P supply levels each with four replicates: P0 (0 mg P kg−1 soil), P5 (5 mg P kg−1 soil) and P20 (20 mg P kg−1 soil) as potassium dihydrogen phosphate. All three treatments were provided with 75 mg kg−1 of N (as urea) and 25 mg kg−1 of K (as potassium chloride). The fertilizers were thoroughly mixed with the soil before sowing. The seeds of the wild type and the transgenic lines were germinated at 25 °C for 2 d. Six germinated seedlings were planted in each plastic pot containing 3 kg of air-dried soil, and were thinned to three plants per pot at the three-leaf stage. The pots were placed randomly outdoors, and their positions were changed every week. The aerial parts of the plants were harvested for determination of tiller number, shoot dry weight, Pi concentration and total P concentration. The roots were collected to measure root dry weight and total P concentration.
Field trials
Two field trials were conducted in the 2010–2011 growing season. The first trial was located in the experimental station of the IGDB in Beijing, and the second trial was located in the experimental station of Shijiazhuang Academy of Agricultural and Forestry Sciences in Xinji, Hebei province. Both trials received two P treatments, the –P treatment received no P and the +P treatment received 13·5 g m−2 of P as calcium superphosphate before sowing. In both treatments, 7·4 g m−2 of K were applied in the form of potassium chloride before sowing, and 18·0 g m−2 of N in the form of urea were applied: 12 g m−2 before sowing and 6 g m−2 at the stem elongation stage. A random block design with six replications was used in both trials. Seeds were sown at the end of September, and plants were harvested in the middle of the following June. Both trials had a seed rate of 150 seeds m−2. The Beijing field trial had two 1·5 m long rows with a row spacing of 23 cm in each replication, and the Hebei field trial had three 3 m long rows with a row spacing of 23 cm in each replication. Total biomass yield per plant, grain yield per plant, spike number per plant and grain number of the primary spike were recorded on 30 representative plants. Thousand-grain weight was determined according to the dry weight of 500 dried grains. The total P concentrations in the straw and grain in the Beijing field trial were measured.
Root parameters measurements
Root morphological parameters were measured in HC trial 1. The root systems were scanned with an STD1600 scanner (Epson, Long Beach, CA, USA). The scan images were then used to measure root tip number and total root length with WinRHIZO software developed by Regent Instruments Canada Inc. (Ottawa, ON, Canada), and primary root length using SigmaScan Pro 5 software (Systat Software Inc., Chicago, IL, USA). Total lateral root length was calculated by subtracting the primary root length from the total root length.
Measurements of total P and Pi content in plant samples
Plant samples were dried at 80 °C to determine dry weight. The dried samples were milled and subsequently digested with concentrated H2SO4 and H2O2 for determination of total P using the molybdate-blue colorimetric method (Murphy and Riley, 1962). To measure the Pi concentration in the leaf, the sap of the fresh youngest expanded leaf was extracted by squeezing leaves in an Eppendorf tube. Then the Pi concentration in the sap was determined using the molybdate-blue colorimetric method (Murphy and Riley, 1962).
Real-time PCR analysis
Total RNA was extracted using the TRIzol® reagent (Invitrogen, Carlsbad, CA, USA). The first-strand cDNA was synthesized from 2 µg of DNase I-treated total RNA using a PrimeScript® RT reagent Kit (TaKaRa, Dalian, China), according to the manufacturer's instructions. Real-time PCR was performed by using the SYBR® Premix Ex Taq™ II (TaKaRa, Dalian, China) on a Mastercycler® ep realplex machine (Eppendorf, Hamburg, Germany). Triplicate quantitative assays were performed on each cDNA sample. The relative quantification of each sample was determined by normalization to the amount of Ta-Actin cDNA detected in the same sample. The relative expression level was calculated by the formula 2−ΔΔCt. The PCR primers are given in Supplementary Data Table S1.
Statistical analysis of data
One-way analysis of variance (ANOVA) was performed by SAS statistical software (SAS Institute Inc., Cary, NC, USA).
Accession numbers
Sequence data of Ta-PHR1 genes can be found in the EMBL/GenBank data libraries under the following accession numbers: Ta-PHR1-A1 (KC218925), Ta-PHR1-B1 (KC286910), Ta-PHR1-D1 (KC286911).
RESULTS
Cloning and characterization of Ta-PHR1 genes
By using the protein sequences of At-PHR1 (NP_194590) and Cr-PSR1 (XP_001700553) as queries, we identified possible PHR1 ESTs in wheat through a dbEST search in the NCBI database. According to the EST sequences, we isolated a full-length cDNA sequence, named Ta-PHR1, from wheat variety Xiaoyan 54. Then Ta-PHR1 was used to design PCR primers to screen the Xiaoyan 54 BAC library, and finally three full-length genomic DNA sequences containing Ta-PHR1 homologues were obtained. These three genes were mapped on chromosomes 7A, 4B and 4D by using a set of deletion lines of ‘Chinese Spring’ (Supplementary Data Fig. S1), and thus were named Ta-PHR1-A1, Ta-PHR1-B1 and Ta-PHR1-D1, respectively. These three genes had the same gene structures with identical exon sizes and similar intron sizes, except that there was a 1035 bp miniature inverted transposable element (MITE) insertion in intron 4 of Ta-PHR1-B1 (Fig. 1A). Their deduced protein sequences each had 451 amino acids, and contained a conserved MYB DNA-binding domain and a predicted CC domain (Supplementary Data Fig. S2), as has been shown for At-PHR1, Cr-PSR1 and Os-PHRs (Rubio et al., 2001; Zhou et al., 2008). Phylogenetic analysis revealed that the Ta-PHR1s belonged to the same subgroup with Os-PHR1, Os-PHR2 and At-PHR1, and were more closely related to Os-PHR1 (Fig. 1B).
Fig. 1.

Structures of the Ta-PHR1 genes and phylogenetic analysis with other related MYB-CC proteins. (A) Structures of the Ta-PHR1 genes. Exons are indicated as black boxes and introns as white boxes. Numbers indicate the length of each exon and intron. ATG and the stop codon are indicated by arrowheads. (B) Phylogenetic tree of the proteins sharing the MYB and predicted CC domains. The phylogenetic tree was constructed using the CLUSTAL_X (Thompson et al., 1997) program and the Neighbor–Joining method. The numbers above the lines refer to bootstrap values (of 100 samples). Scale bar = 0·1 substitutions per site. Protein accession numbers are: Ta-PHR1-A1, KC218925; Ta-PHR1-B1, KC286910; Ta-PHR1-D1, KC286911; Os-PHR1, NP_001050006; Os-PHR2, AA072597; At-PHR1, NP_194590; and CrPSR1, XP_001700553.
Expression patterns of Ta-PHR1
As Ta-PHR1-A1, B1 and D1 were highly similar in their nucleotide sequences, gene-specific primers could not be designed and therefore here the relative expression levels reflected the transcript abundances of all three genes. We first investigated the spatial expression pattern of Ta-PHR1 in the above-ground part of wheat plants at the grain filling stage (2 weeks after flowering), and found that Ta-PHR1 was expressed most strongly in the flag leaf, moderately in the stem and weakly in the spike and developing seed (Fig. 2A). We then analysed the response of Ta-PHR1 to P supply levels in the seedlings of Xiaoyan 54 grown in nutrient solutions containing 200 µm Pi (high P) and 10 µm Pi (low P) for 7 d in HC trial 2. Compared with the high P treatment, the low P treatment slightly downregulated Ta-PHR1 in the shoots and upregulated Ta-PHR1 in the roots (Fig. 2B). At the seedling stage under our experimental conditions, Ta-PHR1 was expressed more abundantly in the shoots than in the roots in both high and low P conditions (Fig. 2B).
Fig. 2.
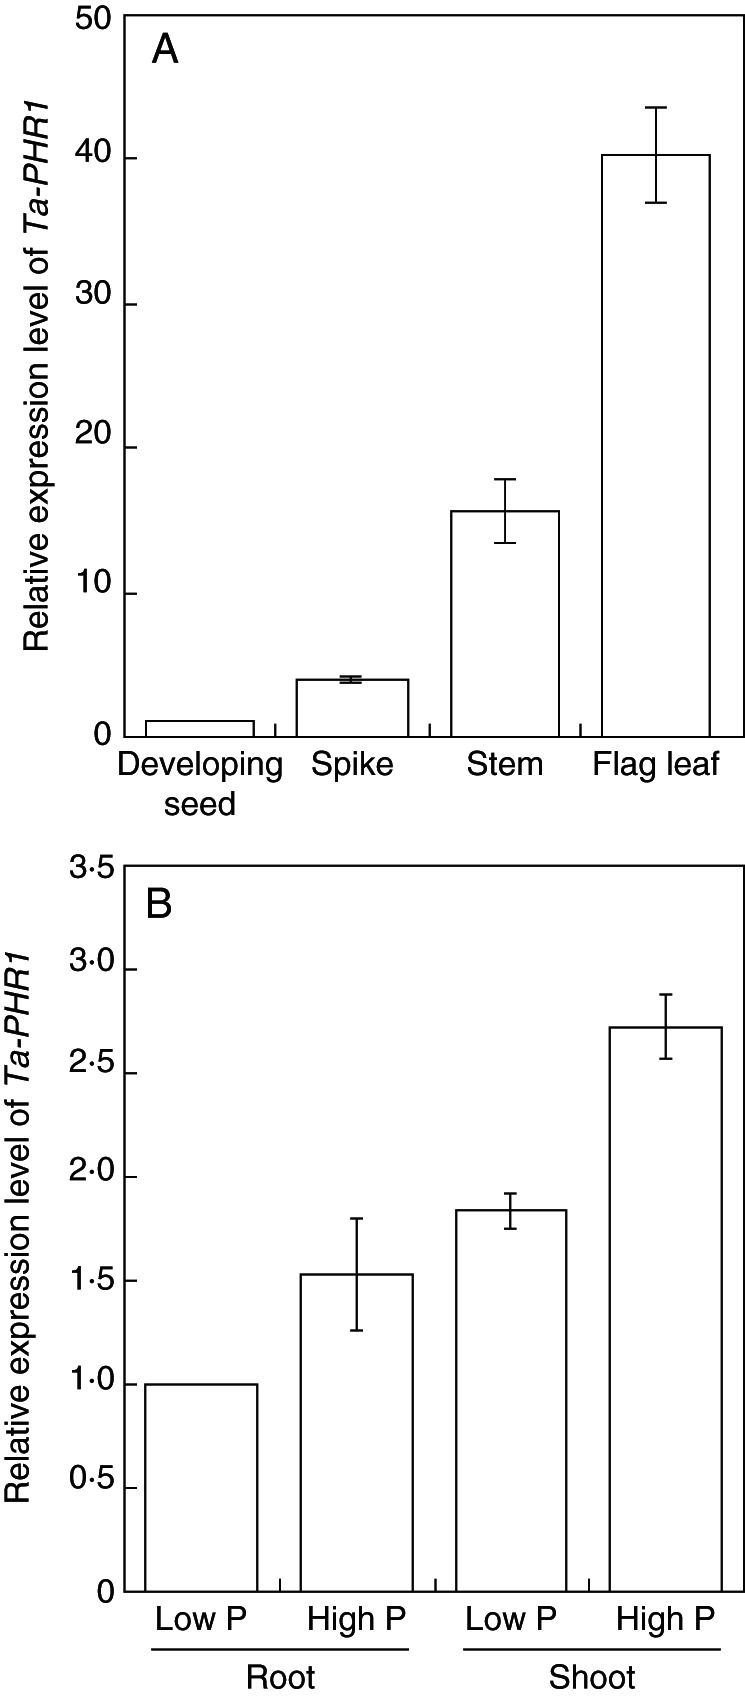
Expression patterns of Ta-PHR1. (A) Expression of Ta-PHR1 in different organs of Xiaoyan 54 plants 2 weeks after flowering. Data are the mean ± s.e. of three replicates. (B) Expression level of Ta-PHR1 in the shoots and roots under low and high P conditions. Xiaoyan 54 seeds were germinated for 7 d, and then the seedlings were grown in a nutrient solution containing 200 µm Pi for 7 d. Thereafter, the seedlings were divided into two groups. These two groups were grown in nutrient solution containing 200 µM Pi (high P) and 10 µm Pi (low P), respectively. After 7 d, the roots and shoots were harvested for gene expression analysis. Data are the mean ± s.e. of three replicates.
Ta-PHR1-A1 homodimer confers transcriptional activation of Ta-PHT1.2 in yeast cells
As Ta-PHR1s were predicted to contain a CC domain (Supplementary Data Fig. S2), a fold usually involved in protein–protein interactions, we used the bimolecular fluorescence complementation (BiFC) assay system described in Gampala et al. (2007) to detect Ta-PHR1 homodimer in arabidopsis protoplast cells. The coding sequence of Ta-PHR1-A1 was cloned in-frame into pX-nYFP and pX-cYFP vectors to generate the constructs Ta-PHR1-nYFP and Ta-PHR1-cYFP, respectively. When protoplast cells were transformed with the empty vectors pX-nYFP + pX-cYFP, a yellow fluorescent protein (YFP) signal was produced throughout the cytoplasm (Fig. 3A), indicating that the BiFC system worked well under our experimental conditions. Protoplast cells transformed with the constructs Ta-PHR1-nYFP + Ta-PHR1-cYFP generated a strong YFP signal in the nuclei (Fig. 3A), whereas no YFP signal was observed in the nuclei of the protoplast cells transformed with pX-nYFP + pX-cYFP, pX-nYFP + Ta-PHR1-cYFP or Ta-PHR1-nYFP + pX-cYFP (Fig. 3A). These results clearly illustrated that Ta-PHR1-A1 formed a homodimer in plant cells, and the nuclear location of Ta-PHR1 implied that it may function as a transcription factor.
Fig. 3.

Ta-PHR1-A1 homodimer confers transcriptional activation of Ta-PHT1.2. (A) BiCF demonstrated that Ta-PHR1-A1 formed a homodimer in vivo. Images were captured 20 h after transient expression under an Olympus confocal microscope. Scale bars = 20 µm. (B) Ta-PHR1-A1 activated the expression of the reporter gene GUS driven by the Ta-PHT1.2 promoter. Left panel: the growth of the yeast cells on SD-Leu/Trp media. Right panel: GUS staining. 1, pAD-GAL4-Ta-PHR1-A1 + pBD-Ta-PHR1- A1-proTa-PHT1.2::GUS; 2, pAD-GAL4-Ta-PHR1-A1 + pBD-GAL4-Ta-PHR1-A1; 3, pAD-GAL4 + pBD-proTa-PHT1.2::GUS. (C) GUS activities of the yeast cells from (B); ** indicates that the difference was significant at the 0·01 level.
We next examined whether Ta-PHR1-A1 homodimer activated the expression of a putative high-affinity Pi transporter Ta-PHT1.2, the promoter of which was previously predicted to contain a putative P1BS element (Miao et al., 2009). Histochemical assay showed that no GUS activity was detected in yeast strains containing the plasmids pAD-GAL4 + pBD-GAL4-proTa-PHT1.2::GUS, indicating that the expression cassette of proTa-PHT1.2::GUS cannot be activated by yeast transcription. Filter lift assays for GUS staining showed that strong blue colour appeared in the yeast cells containing plasmids pAD-Ta-PHR1-A1 + pBD-Ta-PHR1-A1-proTa-PHT1.2::GUS, whereas no blue colour was observed in the yeast cells with other plasmid combinations (Fig. 3B). In addition, higher GUS activity was detected in the yeast cells containing the plasmids pAD-Ta-PHR1-A1 + pBD-Ta-PHR1-A1-proTa-PHT1.2::GUS than other plasmid combinations (Fig. 3C). These results clearly showed that the interaction of Ta-PHR1 with itself activated the expression of GUS driven by the Ta-PHT1.2 promoter in yeast cells.
Over-expression of Ta-PHR1-A1 upregulates Ta-PHT1 and Ta-IPS1.1
In order to investigate the function of Ta-PHR1, we developed Ta-PHR1-A1 transgenic wheat plants using maize ubiquitin promoter-controlled constructs. FISH analysis using the pUbi::Ta-PHR1-pACH25 probe showed that there was no fluorescence signal on the chromosomes of the wild type (Fig. 4A), but there were fluorescence signals on a pair of chromosomes of the two independent transgenic lines (designated as Ov-1 and Ov-2) (Fig. 4B, C), indicating that pUbi::Ta-PHR1-A1 was successfully introduced into the genome of the wild type. These two transgenic lines expressed Ta-PHR1 more stronly than the wild type under both low P and high P conditions in HC trial 2, indicating that Ta-PHR1-A1 was over-expressed in the transgenic lines (Fig. 4D).
Fig. 4.

Fluorescent in situ hybridization (FISH) and expression analysis of Ta-PHR1-A1 in the wild type (WT) and its transgenic lines. (A–C) pUBI::Ta-PHR1-A1 vector was used as the detection probe in FISH of the wild type (A) and the transgenic lines Ov-1 (B) and Ov-2 (C). Fluorescent signals are indicated by arrows. Scale bar = 10 µm. (D) Relative expression levels of Ta-PHR1 in the WT and the transgenic lines Ov-1 and Ov-2 grown in nutrient solution. Seeds were germinated for 7 d, and then the germinated seeds with residual endosperm removed were transferred to nutrient solution containing 10 µm Pi (low P) and 200 µm Pi (high P) for 7 d, respectively. Then the seedlings were collected for gene expression analysis. Data are the mean ± s.e. of three biological replications.
The members of the MT4/TPS1 family have been used as molecular indicators of plant Pi status (Shin et al., 2006), and have been found to be regulated by PHR1 and its rice homologue Os-PHR2 (Rubio et al., 2001; Zhou et al., 2008). To determine whether this is the same case in wheat, we checked the expression of Ta-IPS1.1 and Ta-IPS1.2, members of the MT4/TPS1 family, in the wild type and the Ta-PHR1-A1 transgenic lines in a hydroponic trial (HC trial 2). In the wild type, Ta-IPS1.1 and Ta-IPS1.2 were strongly upregulated by the low P treatment in both the roots and shoots (Fig. 5A; Supplementary Data S3A), indicating that both the roots and shoots in the low P treatment were P starved. By comparing the expression levels of Ta-IPS1.1 and Ta-IPS1.2 between the wild type and transgenic lines, we found that the over-expression of Ta-PHR1-A1 mainly affected the expression of Ta-IPS1.1 under low P conditions. In the low P treatment, the mRNA levels of Ta-IPS1.1 in the transgenic lines Ov-1 and Ov-2 were slightly higher in the shoots, and about 2-fold higher in the roots than those in the wild type (Fig. 5A). No significant difference was found in the expression of Ta-IPS1.2 between the wild type and transgenic lines under either high P or low P conditions (Supplementary Data Fig. S3A).
Fig. 5.
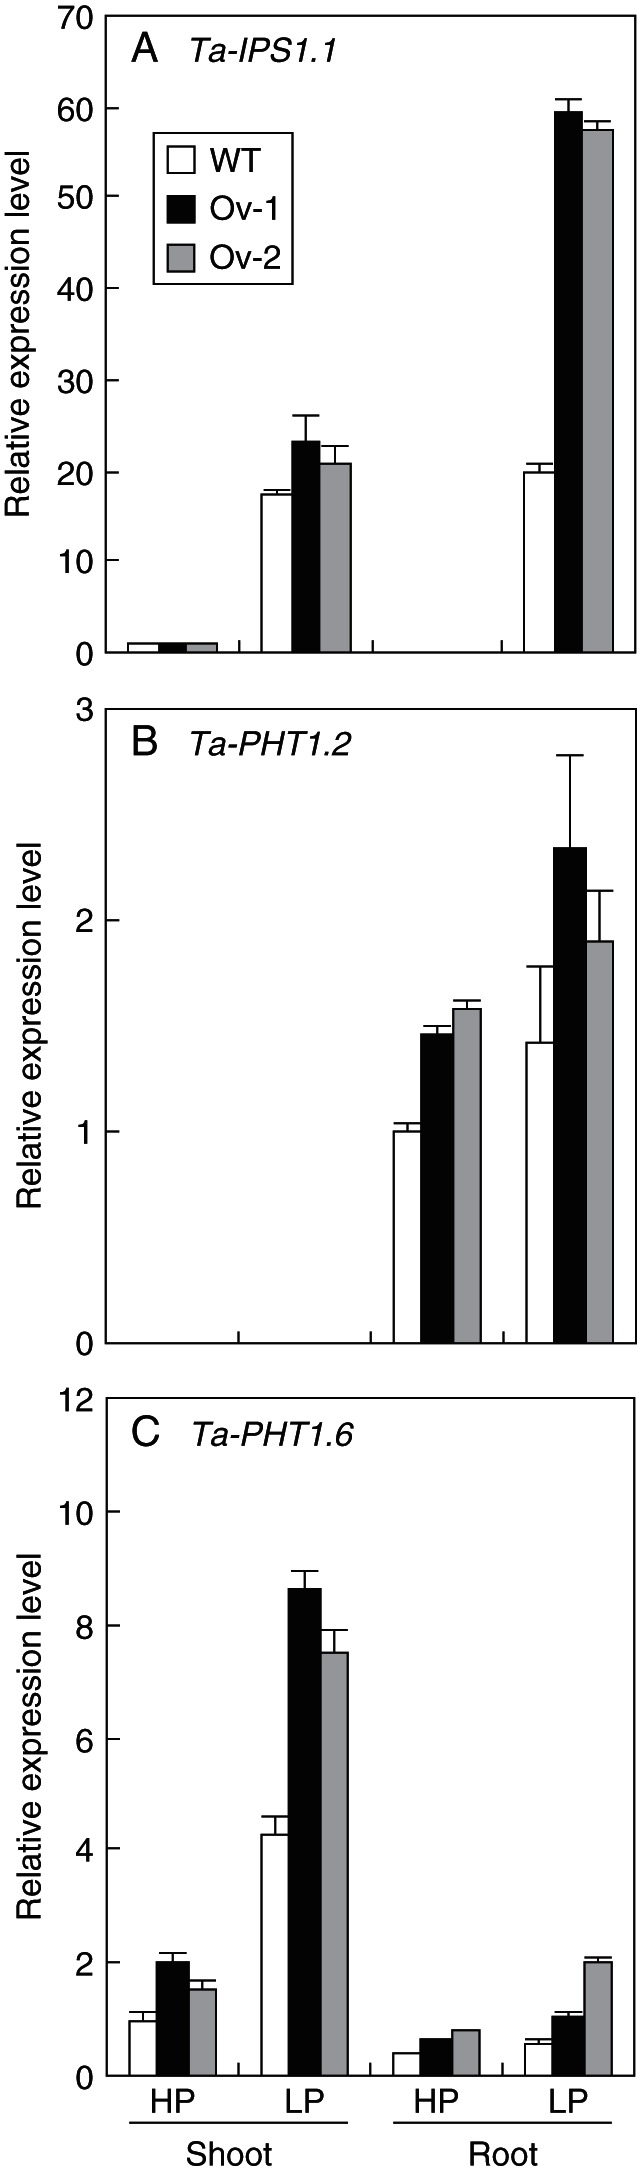
Relative expression levels of (A) Ta-IPS1.1, (B) Ta-PHT1.2 and (C) Ta-PHT1.6 in the shoots and roots of the wild type (WT) and the Ta-PHR1-A1 transgenic lines (Ov-1 and Ov-2). Seeds were germinated for 7 d, and then the germinated seeds with residual endosperm removed were transferred to nutrient solution containing 10 µm Pi (low P, LP) and 200 µm Pi (high P, LP), respectively. After the plants were grown in the low and high P nutrient solutions for 7 d, the shoots and roots were collected separately for gene expression analysis. Data were the mean ± s.e. of three replications.
As has been shown above, Ta-PHR1-A1 activated the expression of GUS driven by the Ta-PHT1.2 promoter in yeast cells (Fig. 3C). Therefore, we examined the expression of the Ta-PHT1.2 gene in the wild type and transgenic lines. As has been shown previously (Davies et al., 2002), Ta-PHT1.2 was specifically expressed in the roots, and was upregulated by the low P treatment in both the wild type and transgenic lines (Fig. 5B). Compared with the wild type, the two transgenic lines had higher expression levels of Ta-PHT1.2 in the roots under both high and low P conditions (Fig. 5B), indicating that over-expression of Ta-PHR1 up-regulated Ta-PHT1.2. We also investigated the expression levels of Ta-PHT1.6, a PHT1 gene mainly expressed in the shoots. Ta-PHT1.6 had detectable expression in both the shoots and the roots, and was upregulated by the low P treatment in the shoots (Fig. 5C). Compared with the wild-type plants, the Ta-PHR1-A1 transgenic plants had higher Ta-PHT1.6 mRNA levels in the shoots and roots under both high and low P conditions, and particularly in the shoots under low P conditions (Fig. 5C).
Besides the above-mentioned Pi starvation-inducible genes, we also analysed other Pi starvation-inducible genes, including Ta-PHF1 homologous to arabidopsis and rice PHOSPHATE TRANSPORTER TRAFFIC FACILITATOR1 (PHF1) (Gonzalez et al., 2005; Chen et al., 2011), Ta-PHO2, homologous to arabidopsis At-PHO2/UBC24 (Bari et al., 2006), Ta-SPX3 homologous to the rice SPX domain gene Os-SPX3 (Wang et al., 2009), Ta-PAP16 encoding a purple acid phosphatase homologous to arabidopsis PAP16 (Li et al., 2002), Ta-SQD2 encoding sulfolipid synthase homologous to arabidopsis SQD2 (Yu et al., 2002), and Ta-MGD2 encoding a UDP-galactose-dependent digalactosyldiacylglycerol synthase homologous to arabidopsis MGD2 (Kelly and Dörmann, 2002). The expression of these genes did not show obvious difference between the wild type and transgenic lines (Supplementary Data Fig. S3).
Over-expression of Ta-PHR1-A1 promotes shoot development and root branching of wheat seedlings
We investigated the effects of over-expressing Ta-PHR1-A1 on the growth of wheat seedlings using both hydroponic culture (HC trial 1) and a soil pot trial. In HC trial 1, the low P treatment reduced tiller number and shoot dry weight, and increased root dry weight and the root/shoot ratio of both the wild type and transgenic lines, compared with the high P treatment (Fig. 6A–E), indicating that the wheat plants grown in the low P treatment were subjected to P-deficient stress. In the low P treatment, both of the transgenic lines had a significantly higher tiller number, root dry weight and root/shoot ratio than the wild type; however, only one of the transgenic lines had significantly higher shoot dry weight and root dry weight than the wild type in the high P treatment (Fig. 6B–E).
Fig. 6.

Growth performance and P uptake of the wild type and the transgenic lines grown in hydroponic culture. Seeds were germinated for 7 d, and then the germinated seeds with residual endosperm removed were transferred to nutrient solution containing 10 µm Pi (low P) and 200 µM Pi (high P), respectively. After the plants were grown in the low and high P nutrient solutions for 21 d, the shoots and roots were collected separately for further analysis. Data were the mean ± s.e. of four replications. * and ** indicate that the difference between the means of the wild type and the transgenic line was significant at P < 0·05 and P < 0·01, respectively. (A) The shoot and root phenotypes of the wild type and the transgenic line Ov-1 under low and high P conditions. (B) TN, tiller number. (C) SDW, shoot dry weight. (D) RDW, root dry weight. (E) Root/shoot dry weight ratio. (F) Shoot P conc., shoot total P concentration. (G) Root P conc., root total P concentration. (H) Shoot P content, total P accumulated in the shoot. (I) Root P content, total P accumulated in the root. (J) P uptake, total P accumulated in the root and shoot. (K) Shoot P/P uptake, ratio of shoot P content over P uptake.
As over-expressing Ta-PHR1-A1 increased root dry weight, we then analysed how Ta-PHR1-A1 affected root morphology. Over-expression of Ta-PHR1-A1 did not always increase primary root length, as only the transgenic line Ov-2 had a higher primary root length than the wild type in the high P treatment (Fig. 7A). The two transgenic lines had a higher root tip number, lateral root length and total root length than the wild type under both high and low P conditions (Fig. 7B–D). These results suggested that over-expressing Ta-PHR1-A1 mainly increased lateral root branching.
Fig. 7.
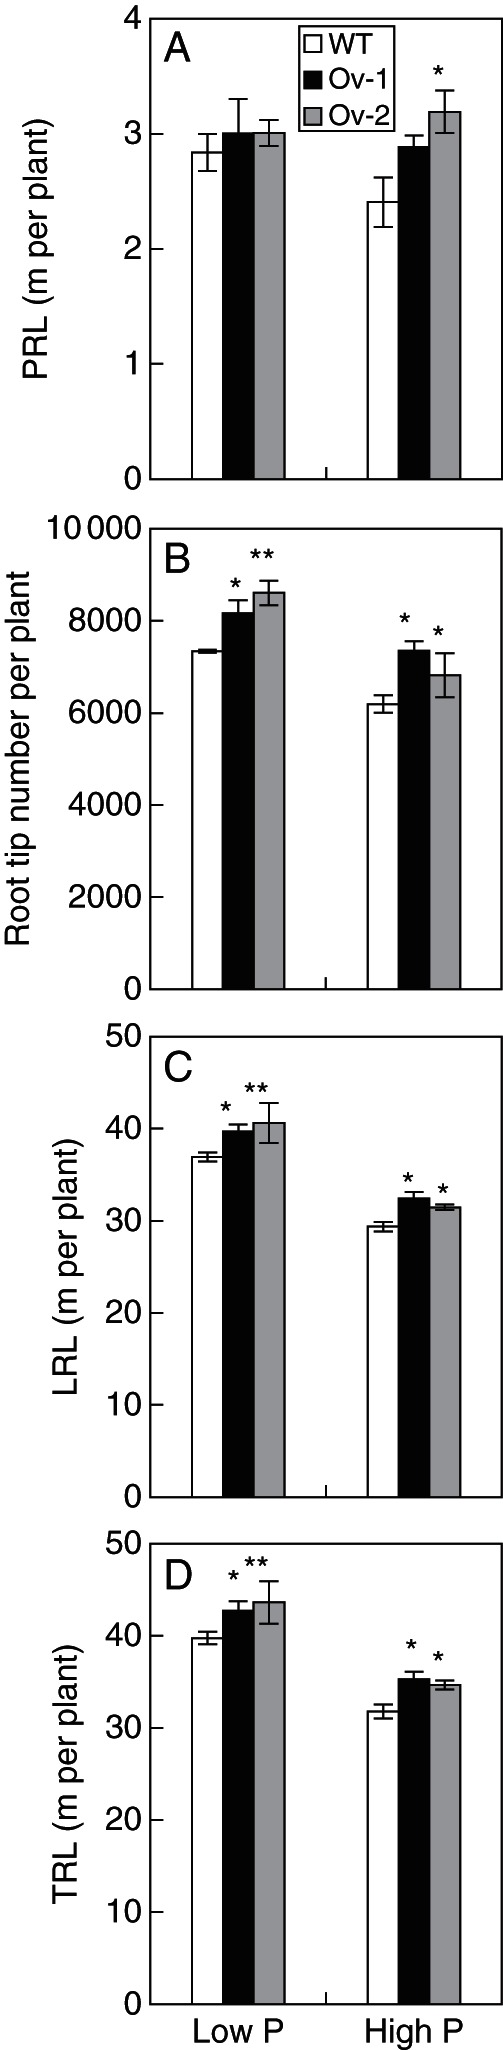
Root morphological parameters of the wild type and the Ta-PHR1 transgenic lines grown in hydroponic culture. The fresh root samples from the hydroponic culture (see Fig. 6) were scanned with an STD1600 scanner (Epsom, USA). The scan images were then used to measure root tip number (B) and total root length (TRL, D) with WinRHIZO software. Primary root length (PRL, A) was measured by using SigmaScan Pro 5 software (Systat Software Inc.). Total lateral root length (LRL, C) was calculated by subtracting the primary root length from the total root length. Data were the mean ± s.e. of four replications. * and ** indicate that the difference between the means of the wild type and the transgenic line was significant at P < 0·05 and P < 0·01, respectively.
The effects of over-expressing Ta-PHR1-A1 on increasing wheat seedling growth were also observed when the wheat plants were grown in soil. In the pot trial, the two transgenic lines had significantly higher tiller number than the wild type at all the three P fertilizer rates (Fig. 8A), and significantly higher shoot dry weight and root dry weight than the wild type in the P0 (0 mg P kg−1 soil) and P5 (5 mg P kg−1 soil) treatments (Fig. 8B, C).
Fig. 8.

Growth performance and P uptake of the wild type and the Ta-PHR1 transgenic lines grown in the soil pot trial. The plants were grown in the soils supplied with 0 (P0), 5 (P5) and 20 (P20) mg P kg−1 soil. Data are the mean ± s.e. of four replications. * and ** indicate that the difference between the means of the wild type and the transgenic lines was significant at P < 0·05 and P < 0·01, respectively. (A) TN/plant, tiller number per plant. (B) SDW, shoot dry weight per plant. (C) RDW, root dry weight per plant. (D) Shoot P conc., shoot total P concentration. (E) Root P conc., root total P concentration. (F) Leaf Pi conc., inorganic phosphate (Pi) concentration in the fresh youngest expanded leaf. (G) Shoot P content, total P accumulated in the shoot. (H) Root P content, total P accumulated in the root. (I) P uptake, total P accumulated in the whole plant.
Over-expression of Ta-PHR1-A1 increases grain yield
Two field trials were carried out in Beijing and Hebei province to investigate the effects of over-expressing Ta-PHR1 on the yield traits (Table 1). We observed positive effects of over-expressing Ta-PHR1 on grain yield in both –P and +P treatments, especially in the +P treatment, in that the transgenic line Ov-1 had a significantly higher grain yield than the wild type in Beijing and Hebei, and the transgenic line Ov-2 had a significantly higher grain yield than the wild type in Hebei. We further analysed the effects of over-expressing Ta-PHR1 on the yield components. As shown in Table 1, over-expressing Ta-PHR1 significantly increased grain number per spike in the +P treatment in both Beijing and Hebei, and in the –P treatment (for Ov-2 only) in Hebei, but did not significantly affect spike number per plant and 1000-grain weight (Table 1).
Table 1.
Agronomic traits and P uptake of the wild type and its Ta-PHR1-A1 transgenic lines under –P and +P conditions in the field trials in Beijing and Hebei province
| –P (mean ± s.e.) |
+ P (mean ± s.e.) |
|||||
|---|---|---|---|---|---|---|
| Trait | WT | Ov-1 | Ov-2 | WT | Ov-1 | Ov-2 |
| Beijing | ||||||
| Grain yield (g per plant) | 5·4 ± 0·1 | 5·6 ± 0·3 | 5·5 ± 0·2 | 6·1 ± 0·2 | 7·1 ± 0·2* | 6·4 ± 0·2 |
| Grain number per spike | 48·4 ± 0·9 | 49·1 ± 1·0 | 50·2 ± 0·8 | 50·4 ± 0·8 | 54·3 ± 0·8* | 52·4 ± 0·6* |
| Spike number per plant | 3·8 ± 0·1 | 4·0 ± 0·3 | 3·9 ± 0·4 | 4·1 ± 0·1 | 4·3 ± 0·1 | 4·1 ± 0·2 |
| 1000-grain weight (g) | 40·8 ± 0·4 | 41·1 ± 0·6 | 41·9 ± 0·7 | 43·4 ± 0·4 | 43·0 ± 0·7 | 42·7 ± 0·5 |
| Grain total P concentration (mg g−1) | 4·14 ± 0·05 | 4·82 ± 0·12* | 4·92 ± 0·14* | 5·35 ± 0·05 | 5·61 ± 0·08 | 5·52 ± 0·09 |
| Grain P content (mg per plant) | 22·4 ± 0·9 | 27·0 ±1 ·2* | 27·1 ± 1·3* | 32·6 ± 0·7 | 39·8 ± 1·6* | 35·3 ± 1·1 |
| Straw total P concentration (mg g−1) | 0·35 ± 0·01 | 0·47 ± 0·02* | 0·46 ± 0·01* | 0·63 ± 0·02 | 0·63 ± 0·01 | 0·54 ± 0·02 |
| Straw P content (mg per plant) | 2·2 ± 0·13 | 2·8 ± 0·1* | 2·9 ± 0·2* | 4·4 ± 0·1 | 4·2 ± 0·1 | 3·8 ± 0·1 |
| P uptake (mg per plant) | 24·6 ± 1·0 | 29·8 ± 1·3* | 30·0 ± 1·3* | 37·0 ± 0·7 | 44·0 ± 1·6* | 39·1 ± 1·3 |
| Phosphate harvest index | 0·91 ± 0·01 | 0·91 ± 0·01 | 0·90 ± 0·01 | 0·88 ± 0·02 | 0·90 ± 0·01 | 0·90 ± 0·01 |
| Hebei Province | ||||||
| Grain yield (g per plant) | 5·3 ± 0·3 | 5·8 ± 0·2 | 6·2 ± 0·3 | 6·1 ± 0·3 | 7·7 ± 0·6* | 7·5 ± 0·6* |
| Grain number per spike | 50·1 ± 2·0 | 51·4 ± 1·2 | 56·7 ± 0·6* | 47·9 ± 0·9 | 54·4 ± 1·6* | 54·1 ± 1·8* |
| Spike number per plant | 2·2 ± 0·2 | 2·4 ± 0·0 | 2·3 ± 0·1 | 2·7 ± 0·2 | 3·0 ± 0·2 | 3·0 ± 0·3 |
| 1000-grain weight (g) | 47·0 ± 0·8 | 46·2 ± 0·3 | 45·6 ± 0·5 | 44·9 ± 0·5 | 44·3 ± 0·4 | 44·1 ± 0·8 |
In both trials, the –P treatment involved the application of no P, and the +P treatment 13·5 g m−2 of P as calcium superphosphate before sowing.
Data are the mean ± s·e· of six replications.
*Indicates that the difference between the means of the wild type and transgenic lines was significant at P < 0·05.
Over-expression of Ta-PHR1-A1 improves P uptake
We analysed P uptake by wheat seedlings grown in nutrient solution in HC trial 1, and in the soils in the pot trial. In HC trial 1, both of the transgenic lines had significantly higher total P concentration and P content in the shoots, and significantly higher P uptake than the wild type under both high and low P conditions (Fig. 6F, H, J), but had a similar total P concentration and P content in the roots to the wild type (Fig. 6G, I). These results indicated that over-expressing Ta-PHR1-A1 increased P uptake, and promoted P translocation from roots to shoots as reflected by the ratios of shoot P content over P uptake (Fig. 6K). In the pot trial, only the transgenic line Ov-2 was found to have an increased total P concentration in the shoots at the P-fertilizer rate P0, and P content in the roots at the P-fertilizer rates P0 and P5 (Fig. 8D, H). However, one or both of the transgenic lines were found to have an increased leaf Pi concentration (Fig. 8F) and P uptake at the P-fertilizer rates P0 and P5 (Fig. 8I).
In the field trial in Beijing, we analysed the total P concentration in the grains and straw. In the –P treatment, both of the transgenic lines had a higher total P concentration and P content in the grains and straw, and higher P accumulation in the above-ground parts; in the +P treatment, only the transgenic line Ov-1 was found to have increased grain P content and P accumulation in the above-ground parts (Table 1). Over-expressing Ta-PHR1-A1 did not significantly affect the distribution of P in the grains (P harvest index; Table 1).
DISCUSSION
Ta-PHR1-A1 is involved in Pi starvation signalling in wheat
By screening a common wheat BAC library, we cloned three PHR1 homologous genes Ta-PHR1-A1, Ta-PHR1-B1 and Ta-PHR1-D1 which are located on chromosomes 7A, 4B and 4D, respectively (Supplementary Data Fig. S1). The location of Ta-PHR1-A1 on chromosome 7A may be caused by structural rearrangement between chromosome arms 7AL and 4BS (Devos et al., 1995). These three genes had the same gene structures with identical exon sizes and similar intron sizes (Fig. 1A), and their deduced protein sequences showed high similarities to each other (Fig. 1B). The high similarity in gene sequence, structure and chromosomal location indicates that Ta-PHR1-A1, B1 and D1 were homologous alleles. The deduced proteins of these three genes contained a conserved MYB DNA-binding domain and a predicted CC domain (Supplementary Data Fig. S2), as have been shown for At-PHR1, At-PHL1 and Os-PHR1/2 (Rubio et al., 2001; Zhou et al., 2008; Bustos et al., 2010).
At-PHR1 and its homologues At-PHL1 in arabidopsis and Os-PHR2 in rice regulate a set of Pi starvation-inducible genes (Rubio et al., 2001; Nilsson et al., 2007; Zhou et al., 2008; Bustos et al., 2010), reflecting the key role of PHR1 in Pi starvation signalling. The direct targets of PHR1 are found to be greatly enriched in P1BS containing Pi starvation-inducible genes (Bustos et al., 2010). Our current study showed that Ta-PHR1-A1 formed a homodimer (Fig. 3A), and conferred transcriptional activation of Ta-PHT1.2 (Fig. 3B, C), whose promoter contains a putative P1BS element (Miao et al., 2009). This result demonstrated that Ta-PHR1-A1 was a functional transcriptional factor in regulating Pi starvation-inducible genes. Over-expression of Ta-PHR1-A1 in wheat upregulated Ta-PHT1.2, and other Pi starvation-inducible genes, including Ta-IPS1.1 and Ta-PHT1.6 (Fig. 5), further confirming the role of Ta-PHR1-A1 in Pi signalling in wheat. As the expression of Ta-PHR1, like that of At-PHR1 and Os-PHR2, was not dramatically regulated by Pi supply levels (Fig. 2B), it is assumed that Ta-PHR1s might be subjected to post-translational regulation in Pi starvation signalling in wheat. Previously the post-translational regulation on PHR1 protein has been shown in arabidopsis, in which At-PHR1 protein can be sumoylated by SUMO E3 ligase SIZ1 (Miura et al., 2005). Over-expression of Ta-PHR1-A1 did not obviously alter the expression levels of Ta-IPS1.2, Ta-PHF1, Ta-PHO2, TaSPX3, Ta-PAP16, Ta-SQD2 and Ta-MGD2 (Supplementary Data Fig. S3), suggesting that transcriptional factors other than Ta-PHR1-A1 may function in Pi signalling in wheat. In each genome of arabidopsis and rice, there are at least two PHR1 homologues that differentially regulate Pi starvation-inducible genes (Rubio et al., 2001; Zhou et al., 2008; Bustos et al., 2010). For example, the rice Pi starvation-inducible genes Os-IPS1, Os-IPS2, Os-PAP16 and Os-SQD2 are regulated by Os-PHR2, but not by Os-PHR1 (Zhou et al., 2008).
Over-expression of Ta-PHR1-A1 promotes wheat growth and grain yield
Over-expressing Ta-PHR1-A1 enhanced wheat seedling development when grown in the soil or in nutrient solution. At the seedling stage in the pot trial, over-expression of Ta-PHR1-A1 promoted tiller number regardless of P supply levels (Fig. 8A), and increased shoot dry weight under P-deficient conditions (P-fertilizer rates P0 and P5) (Fig. 8B). When the plants were grown in the nutrient solution (HC trial 1), the effects of over-expressing Ta-PHR1-A1 on increasing tiller number and shoot dry weight were also observed (Fig. 6B, C). However, over-expressing Ta-PHR1-A1 did not increase average tiller size as reflected by average shoot dry weight per tiller (shoot dry weight/tiller number). We calculated shoot dry weight/tiller number values according to the data of tiller number and shoot dry weight in the pot trial (Fig. 8A, B), and found that shoot dry weight/tiller number was lower for the transgenic lines than for the wild type at all the three P-fertilizer rates. For example, shoot dry weight/tiller number was 0·150 for the wild type, and was 0·137 and 0·124 for Ov-1 and Ov-2 at the P-fertilizer rate P0, respectively. The smaller tiller size of the transgenic lines may partially explain the results of the two field trials in that over-expressing Ta-PHR1-A1 did not increase spike number per plant (Table 1), as a small tiller size may not favour its development into a productive spike.
Over-expressing Ta-PHR1-A1 also improved grain yield of wheat under field conditions. In the field trials carried out at two different sites (Beijing and Hebei), over-expressing Ta-PHR1-A1 increased grain yield under P-sufficient conditions, and also showed positive effects on grain yield under P-deficient conditions (Table 1). Compared with the wild type, the increased grain yields of the transgenic lines were due to the effects of over-expressing Ta-PHR1-A1 on increasing grain number per spike, but not spike number per plant and 1000-grain weight (Table 1). Taken together, our research demonstrated the positive regulation by Ta-PHR1-A1 on wheat growth and yield performance. The regulation of plant growth has been reported for PHR1 and its homologues previously. In arabidopsis, the functional loss of PHR1 results in reduced growth of the shoot, irrespective of external Pi conditions (Nilsson et al., 2007). Over-expressing PHR1 and its homologues has been reported to inhibit growth in rice and Brassica napus; the growth retardation may be caused by excessive Pi accumulation in the shoots of the transgenic lines (Zhou et al., 2008; F. Ren et al., 2012). In these two studies on rice and B. napus, OsPHR2 and BnPHR1 were upregulated by several fold, and consequently the shoots of the transgenic lines accumulated several fold higher Pi concentrations than those of the wild type. When we over-expressed Ta-PHR1-A1 in arabidopsis, we also observed that the transgenic lines accumulated a much higher Pi concentration in the shoot, and had less shoot biomass than the wild type (unpublished data). Therefore, the increasing effect of over-expressing Ta-PHR1-A1 on wheat growth was possibly due to the fact that the expression levels of Ta-PHR1 were only moderately upregulated (about 50 % higher) in the transgenic lines (Fig. 4D), and the leaf Pi concentrations in the transgenic lines were also moderately increased (about 30 % higher, Fig. 8F).
Over-expression of Ta-PHR1-A1 increases lateral root branching
In response to low availability of P in the rhizosphere, plants have developed highly specialized morphological adaptive mechanisms to increase the ability of their root systems to utilize Pi from soils; these include increased root/shoot ratio, enhanced adventitious rooting and lateral root branching, and greater root hair density (George et al., 2011). Besides its role in regulating the expression of Pi starvation-inducible genes, PHR1 and its homologues have been found to regulate root growth. In arabidopsis, the functional loss of PHR1 reduces root growth, regardless of external Pi conditions (Nilsson et al., 2007). A more detailed study showed that the phr1 mutant has decreased root hair length, while over-expressing PHR1 increases root hair length under P-deficient conditions (Bustos et al., 2010). In rice, over-expression of Os-PHR2 has also been found to increase root hair length and density, and to enhance the elongation of the primary root and adventitious roots under P-deficient conditions (Zhou et al., 2008). To the best of our knowledge, the effect of PHR1 and its homologues on lateral root development is not yet known. In the current study, the Ta-PHR1-A1 transgenic plants had higher root dry weight than the wild type under P-deficient conditions in the pot trial (Fig. 8C). When grown in the nutrient solution in HC trial 1, the Ta-PHR1-A1 transgenic lines also had a higher root dry weight than the wild type under low P conditions, and also under high P conditions (Fig. 6D), and an increased root/shoot ratio under low P condition (Fig. 6E), indicating that over-expressing Ta-PHR1-A1 increased root response to P deficiency, and further confirming the roles of Ta-PHR1-A1 in Pi signalling. More detailed analysis demonstrated that over-expressing Ta-PHR1-A1 increased root tip number (Fig. 7B), lateral root length (Fig. 7C) and, consequently, total root length, under both low and high P conditions (Fig. 7D). These results supported the positive regulation by Ta-PHR1-A1 of lateral root branching. However, over-expressing Ta-PHR1-A1 did not constitutively increase primary root length, as only the transgenic line Ov-2 had a longer primary root length than the wild type under high P conditions (Fig. 7A). Taking these results together, At-PHR1, Os-PHR2 and Ta-PHR1-A1 differentially regulate root morphology, although they all are involved in Pi signalling.
Over-expression of Ta-PHR1-A1 increases P uptake
Over-expressing Ta-PHR1-A1 increased P uptake when the plants were grown either in the nutrient solution (Fig. 6) or in the soil (Fig. 8, Table 1). However, the increasing effects were more pronounced in the nutrient solution than in the soil; this phenomenon was possibly due to the low mobility of Pi in the soil (Schachtman et al., 1998). In the hydroponic culture (HC trial 1), over-expressing Ta-PHR1-A1 increased shoot total P concentration (Fig. 6F), shoot P content (Fig. 6H) and P uptake under both low and high P conditions (Fig. 6J), but not root total P concentration (Fig. 6G) and root P content (Fig. 6I), resulting in a greater distribution of P from roots to shoots in the transgenic lines than in the wild type (Fig. 6K). The increased P distributions in shoots have also been observed in At-PHR1 and Os-PHR2 over-expressing lines (Nilsson et al., 2007; Zhou et al., 2008). Although over-expressing Ta-PHR1-A1 increased the distribution of P from roots to shoots at the seedling stage in the hydroponic culture, it did not increase the distribution of P from shoots to grains, as the P harvest index showed no difference between the transgenic lines and the wild type in the field trial in Beijing (Table 1). When the plants were grown in soil in the pot trial and the field trial in Beijing, increases of P uptake mediated by over-expressing Ta-PHR1-A1 were mainly detected under P-deficient conditions (Fig. 8I, Table 1), this was possible because over-expression of Ta-PHR1-A1 increased root dry weight under P-deficient conditions (Fig. 8C). Enhanced root development has been reported by many researchers to increase the ability of the root system to utilize P from soils (for a review, see George et al., 2011).
The increased P uptake and distribution in the shoots in the transgenic lines may also be due to the fact that over-expressing Ta-PHR1-A1 upregulated the expression of Ta-PHT1.2 and 1.6 (Fig. 5B, C). The PHT1 type of Pi transporters mainly function in Pi acquisition from soils and translocation from roots to other parts of plants (Bucher, 2007). Ta-PHT1.2 encodes a functional high-affinity Pi transporter (Zeng et al., 2002), and is predominantly expressed in the roots (Fig. 5B), suggesting its role in P uptake. Ta-PHT1.6 is expressed in both shoots and roots under high P conditions, and more abundantly in the shoots of P-starved plants (Fig. 5C), implying that Ta-PHT1.6 may play a role in mediating the distribution of P from roots to shoots. The upregulation of PHT1 transporters by over-expressing At-PHR1 and Os-PHR2 has been reported in arabidopsis and rice (Nilsson et al., 2007; Zhou et al., 2008), respectively, and was found to be responsible for most of the Os-PHR2-mediated accumulation of excess shoot Pi (Liu et al., 2010). As information on the sequence, function and expression of PHT1 genes in wheat remains largely unknown, further detailed research on PHT1 genes and their regulation by Ta-PHR1-A1 will help us to better understand the mechanism of the control of Ta-PHR1-A1 in P uptake and re-distribution within wheat plants.
In summary, we cloned three PHR1 genes on chromosomes 7A, 4B and 4D in wheat. The three Ta-PHR1 genes are highly similar in sequence, and share the same gene structures. Our data showed that Ta-PHR1-A1 was involved in Pi signalling in wheat, and over-expressing Ta-PHR1-A1 in wheat upregulated Pi starvation-inducible genes, stimulated later root growth and hence improved P uptake. Over-expressing Ta-PHR1-A1 also improved shoot growth and grain yield. The positive regulation by Ta-PHR1-A1 of P uptake and plant growth will provide a valuable approach to engineer crops with improved P use efficiency and yield performance.
SUPPLEMENTARY DATA
ACKNOWLEDGEMENTS
This work was supported by the Ministry of Science and Technology of China (2011CB100304), the Keystone Project of Transfergene in China (2011ZX08002-005) and the National Natural Science Foundation of China (30890133).
LITERATURE CITED
- Bari R, Datt Pant B, Stitt M, Scheible WR. PHO2, microRNA399, and PHR1 define a phosphate-signaling pathway in plants. Plant Physiology. 2006;141:988–999. doi: 10.1104/pp.106.079707. [DOI] [PMC free article] [PubMed] [Google Scholar]
- Becker D, Brettschneider R, Lorz H. Fertile transgenic wheat from microprojectile bombardment of scutellar tissue. The Plant Journal. 1994;5:299–307. doi: 10.1046/j.1365-313x.1994.05020299.x. [DOI] [PubMed] [Google Scholar]
- Bucher M. Functional biology of plant phosphate uptake at root and mycorrhiza interfaces. New Phytologist. 2007;173:11–26. doi: 10.1111/j.1469-8137.2006.01935.x. [DOI] [PubMed] [Google Scholar]
- Bustos R, Castrillo G, Linhares F, et al. A central regulatory system largely controls transcriptional activation and repression responses to phosphate starvation in Arabidopsis. PLoS Genetics. 2010;6 doi: 10.1371/journal.pgen.1001102. e1001102. http://dx.doi.org/10.1371/journal.pgen.1001102 . [DOI] [PMC free article] [PubMed] [Google Scholar]
- Chen J, Liu Y, Ni J, et al. OsPHF1 regulates the plasma membrane localization of low- and high-affinity Pi transporters and determines Pi uptake and translocation in rice. Plant Physiology. 2011;157:269–278. doi: 10.1104/pp.111.181669. [DOI] [PMC free article] [PubMed] [Google Scholar]
- Cheng L, Bucciarelli B, Shen J, Allan D, Vance CP. Update on white lupin cluster root acclimation to phosphorus deficiency. Plant Physiology. 2011;156:1025–1032. doi: 10.1104/pp.111.175174. [DOI] [PMC free article] [PubMed] [Google Scholar]
- Chiou TJ, Lin SI. Signaling network in sensing phosphate availability in plants. Annual Review of Plant Biology. 2011;62:185–206. doi: 10.1146/annurev-arplant-042110-103849. [DOI] [PubMed] [Google Scholar]
- Chiou TJ, Liu H, Harrison MJ. The spatial expression patterns of a phosphate transporter (MtPT1) from Medicago truncatula indicate a role in phosphate transport at the root/soil interface. The Plant Journal. 2001;25:281–293. doi: 10.1046/j.1365-313x.2001.00963.x. [DOI] [PubMed] [Google Scholar]
- Christensen AH, Sharrock RA, Quail PH. Maize polyubiquitin genes: structure, thermal perturbation of expression and transcript splicing, and promoter activity following transfer to protoplasts by electroporation. Plant Molecular Biology. 1992;18:675–689. doi: 10.1007/BF00020010. [DOI] [PubMed] [Google Scholar]
- Cordell D, Drangert JO, White S. The story of phosphorus: global food security and food for thought. Global Environmental Change. 2009;19:292–305. [Google Scholar]
- Davies TGE, Ying J, Xu Q, Li ZS, Li JY. Expression analysis of putative high-affinity phosphate transporters in Chinese winter wheats. Plant, Cell and Environment. 2002;25:1325–1340. [Google Scholar]
- Delhaize E, Taylor P, Hocking PJ, Simpson RJ, Ryan PR, Richardson AE. Transgenic barley (Hordeum vulgare L.) expressing the wheat aluminium resistance gene (TaALMT1) shows enhanced phosphorus nutrition and grain production when grown on an acid soil. Plant Biotechnology Journal. 2009;7:391–400. doi: 10.1111/j.1467-7652.2009.00403.x. [DOI] [PubMed] [Google Scholar]
- Devos KM, Dubcovsky J, Dvořák J, Chinoy CN, Gale MD. Structural evolution of wheat chromosomes 4A, 5A, and 7B and its impact on recombination. Theoretical and Applied Genetics. 1995;91:282–288. doi: 10.1007/BF00220890. [DOI] [PubMed] [Google Scholar]
- FAO (Food Agriculture Organization) Fertilizer and Plant Nutrition Bulletin 17. Rome: FAO; 2006. Fertilizer use by crop. [Google Scholar]
- Gampala SS, Kim TW, He JX, et al. An essential role for 14-3-3 proteins in brassinosteroid signal transduction in Arabidopsis. Developmental Cell. 2007;13:177–189. doi: 10.1016/j.devcel.2007.06.009. [DOI] [PMC free article] [PubMed] [Google Scholar]
- George TS, Fransson AM, Hammond JP, White PJ. Phosphorus nutrition: rhizosphere processes, plant response and adaptations. Dordrecht, The Netherlands: Springer; 2011. [Google Scholar]
- Glassop D, Smith SE, Smith FW. Cereal phosphate transporters associated with the mycorrhizal pathway of phosphate uptake into roots. Planta. 2005;222:688–698. doi: 10.1007/s00425-005-0015-0. [DOI] [PubMed] [Google Scholar]
- Gonzalez E, Solano R, Rubio V, Leyva A, Paz-Ares J. PHOSPHATE TRANSPORTER TRAFFIC FACILITATOR1 is a plant-specific SEC12-related protein that enables the endoplasmic reticulum exit of a high-affinity phosphate transporter in Arabidopsis. Plant, Cell and Environment. 2005;17:3500–3512. doi: 10.1105/tpc.105.036640. [DOI] [PMC free article] [PubMed] [Google Scholar]
- Guo W, Zhao J, Li X, Qin L, Yan X, Liao H. A soybean β-expansin gene GmEXPB2 intrinsically involved in root system architecture responses to abiotic stresses. The Plant Journal. 2011;66:541–552. doi: 10.1111/j.1365-313X.2011.04511.x. [DOI] [PubMed] [Google Scholar]
- Hammond JP, White PJ. Sugar signaling in root responses to low phosphorus availability. Plant Physiology. 2011;156:1033–1040. doi: 10.1104/pp.111.175380. [DOI] [PMC free article] [PubMed] [Google Scholar]
- Han F, Lamb JC, Birchler JA. High frequency of centromere inactivation resulting in stable dicentric chromosomes of maize. Proceedings of the National Academy of Sciences, USA. 2006;103:3238–3243. doi: 10.1073/pnas.0509650103. [DOI] [PMC free article] [PubMed] [Google Scholar]
- Jia H, Ren H, Gu M, et al. The phosphate transporter gene OsPht1;8 is involved in phosphate homeostasis in rice. Plant Physiology. 2011;156:1164–1175. doi: 10.1104/pp.111.175240. [DOI] [PMC free article] [PubMed] [Google Scholar]
- Kato A, Lamb JC, Birchler JA. Chromosome painting using repetitive DNA sequences as probes for somatic chromosome identification in maize. Proceedings of the National Academy of Sciences, USA. 2004;101:13554–13559. doi: 10.1073/pnas.0403659101. [DOI] [PMC free article] [PubMed] [Google Scholar]
- Kelly AA, Dörmann P. DGD2, an Arabidopsis gene encoding a UDP-galactose-dependent digalactosyldiacylglycerol synthase is expressed during growth under phosphate-limiting conditions. Journal of Biological Chemistry. 2002;277:1166–1173. doi: 10.1074/jbc.M110066200. [DOI] [PubMed] [Google Scholar]
- Li D, Zhu H, Liu K, et al. Purple acid phosphatases of Arabidopsis thaliana. Comparative analysis and differential regulation by phosphate deprivation. Journal of Biological Chemistry. 2002;277:27772–27781. doi: 10.1074/jbc.M204183200. [DOI] [PubMed] [Google Scholar]
- Li Z, Gao Q, Liu Y, He C, Zhang X, Zhang J. Over-expression of transcription factor ZmPTF1 improves low phosphate tolerance of maize by regulating carbon metabolism and root growth. Planta. 2011;233:1129–1143. doi: 10.1007/s00425-011-1368-1. [DOI] [PubMed] [Google Scholar]
- Liang Q, Cheng X, Mei M, Yan X, Liao H. QTL analysis of root traits as related to phosphorus efficiency in soybean. Annals of Botany. 2010;106:223–234. doi: 10.1093/aob/mcq097. [DOI] [PMC free article] [PubMed] [Google Scholar]
- Liu F, Wang Z, Ren H, et al. OsSPX1 suppresses the function of OsPHR2 in the regulation of expression of OsPT2 and phosphate homeostasis in shoots of rice. The Plant Journal. 2010;62:508–517. doi: 10.1111/j.1365-313X.2010.04170.x. [DOI] [PubMed] [Google Scholar]
- Lopez-Bucio J, Hernandez-Abreu E, Sanchez-Calderon L, Nieto-Jacobo MF, Simpson J, Herrera-Estrella L. Phosphate availability alters architecture and causes changes in hormone sensitivity in the Arabidopsis root system. Plant Physiology. 2002;129:244–256. doi: 10.1104/pp.010934. [DOI] [PMC free article] [PubMed] [Google Scholar]
- Lynch JP. Root phenes for enhanced soil exploration and phosphorus acquisition: tools for future crops. Plant Physiology. 2011;156:1041–1049. doi: 10.1104/pp.111.175414. [DOI] [PMC free article] [PubMed] [Google Scholar]
- Manske GGB, Ortiz-Monasterio JI, Ginklel MV, et al. Traits associated with improved P-uptake efficiency in CIMMYT's semidwarf spring bread wheat grown on an acid Andisol in Mexico. Plant and Soil. 2000;221:189–204. [Google Scholar]
- Miao J, Sun J, Liu D, et al. Characterization of the promoter of phosphate transporter TaPHT1.2 differentially expressed in wheat varieties. Journal of Genetics and Genomics. 2009;36:455–466. doi: 10.1016/S1673-8527(08)60135-6. [DOI] [PubMed] [Google Scholar]
- Miura K, Rus A, Sharkhuu A, et al. The Arabidopsis SUMO E3 ligase SIZ1 controls phosphate deficiency responses. Proceedings of the National Academy of Sciences, USA. 2005;102:7760–7765. doi: 10.1073/pnas.0500778102. [DOI] [PMC free article] [PubMed] [Google Scholar]
- Muller R, Morant M, Jarmer H, Nilsson L, Nielsen TH. Genome-wide analysis of the Arabidopsis leaf transcriptome reveals interaction of phosphate and sugar metabolism. Plant Physiology. 2007;143:156–171. doi: 10.1104/pp.106.090167. [DOI] [PMC free article] [PubMed] [Google Scholar]
- Murphy JR, Riley JP. A modified single solution method for the determination of phosphate in natural waters. Analytica Chimica Acta. 1962;27:31–36. [Google Scholar]
- Nagarajan VK, Jain A, Poling MD, Lewis AJ, Raghothama KG, Smith AP. Arabidopsis Pht1;5 mobilizes phosphate between source and sink organs and influences the interaction between phosphate homeostasis and ethylene signaling. Plant Physiology. 2011;156:1149–1163. doi: 10.1104/pp.111.174805. [DOI] [PMC free article] [PubMed] [Google Scholar]
- Nilsson L, Müller R, Nielsen TH. Increased expression of the MYB-related transcription factor, PHR1, leads to enhanced phosphate uptake in Arabidopsis thaliana. Plant, Cell and Environment. 2007;30:1499–1512. doi: 10.1111/j.1365-3040.2007.01734.x. [DOI] [PubMed] [Google Scholar]
- Nilsson L, Müller R, Nielsen TH. Dissecting the plant transcriptome and the regulatory responses to phosphate deprivation. Physiologia Plantarum. 2010;139:129–143. doi: 10.1111/j.1399-3054.2010.01356.x. [DOI] [PubMed] [Google Scholar]
- Plaxton WC, Tran HT. Metabolic adaptations of phosphate-starved plants. Plant Physiology. 2011;156:1006–1015. doi: 10.1104/pp.111.175281. [DOI] [PMC free article] [PubMed] [Google Scholar]
- Rae AL, Jarmey JM, Mudge SR, Smith FW. Over-expression of a high-affinity phosphate transporter in transgenic barley plants does not enhance phosphate uptake rates. Functional Plant Biology. 2004;31:141–148. doi: 10.1071/FP03159. [DOI] [PubMed] [Google Scholar]
- Raghothama KG. Phosphate acquisition. Annual Review of Plant Physiology and Plant Molecular Biology. 1999;50:665–693. doi: 10.1146/annurev.arplant.50.1.665. [DOI] [PubMed] [Google Scholar]
- Ramaekers L, Remans R, Rao IM, Blair MW, Vanderleyden J. Strategies for improving phosphorus acquisition efficiency of crop plants. Field Crops Research. 2010;117:169–176. [Google Scholar]
- Ren F, Guo Q, Chang L, et al. Brassica napus PHR1 gene encoding a MYB-like protein functions in response to phosphate starvation. PLoS One. 2012;7 doi: 10.1371/journal.pone.0044005. e44005. http://dx.doi.org/10.1371/journal.pone.0044005 . [DOI] [PMC free article] [PubMed] [Google Scholar]
- Ren YZ, He X, Liu DC, et al. Major quantitative trait loci for seminal root morphology of wheat seedlings. Molecular Breeding. 2012;30:139–148. [Google Scholar]
- Rubio V, Linhares F, Solano R, et al. A conserved MYB transcription factor involved in phosphate starvation signaling both in vascular plants and in unicellular algae. Genes and Development. 2001;15:2122–2133. doi: 10.1101/gad.204401. [DOI] [PMC free article] [PubMed] [Google Scholar]
- Schachtman DP, Reid RJ, Ayling SM. Phosphorus uptake by plants: from soil to cell. Plant Physiology. 1998;116:447–453. doi: 10.1104/pp.116.2.447. [DOI] [PMC free article] [PubMed] [Google Scholar]
- Schachtman DP, Shin R. Nutrient sensing and signaling: NPKS. Annual Review of Plant Biology. 2007;58:47–69. doi: 10.1146/annurev.arplant.58.032806.103750. [DOI] [PubMed] [Google Scholar]
- Schunmann PH, Richardson AE, Vickers CE, Delhaize E. Promoter analysis of the barley Pht1;1 phosphate transporter gene identifies regions controlling root expression and responsiveness to phosphate deprivation. Plant Physiology. 2004;136:4205–4214. doi: 10.1104/pp.104.045823. [DOI] [PMC free article] [PubMed] [Google Scholar]
- Shin H, Shin HS, Chen RJ, Harrison MJ. Loss of At4 function impacts phosphate distribution between the roots and the shoots during phosphate starvation. The Plant Journal. 2006;45:712–726. doi: 10.1111/j.1365-313X.2005.02629.x. [DOI] [PubMed] [Google Scholar]
- Thompson JD, Gibson TJ, Plewniak F, Jeanmougin F, Higgins DG. The CLUSTAL_X windows interface: flexible strategies for multiple sequence alignment aided by quality analysis tools. Nucleic Acids Research. 1997;25:4876–4882. doi: 10.1093/nar/25.24.4876. [DOI] [PMC free article] [PubMed] [Google Scholar]
- Tian J, Wang X, Tong Y, Chen X, Liao H. Bioengineering and management for efficient phosphorus utilization in crops and pastures. Current Opinion in Biotechnology. 2012;23:866–871. doi: 10.1016/j.copbio.2012.03.002. [DOI] [PubMed] [Google Scholar]
- Tittarelli A, Milla L, Vargas F, et al. Isolation and comparative analysis of the wheat TaPT2 promoter: identification in silico of new putative regulatory motifs conserved between monocots and dicots. Journal of Experimental Botany. 2007;58:2573–2582. doi: 10.1093/jxb/erm123. [DOI] [PubMed] [Google Scholar]
- Vance CP, Uhde-stone C, Allan DL. Phosphorus acquisition and use: critical adaptations by plants for securing a non renewable resource. New Phytologist. 2003;157:423–427. doi: 10.1046/j.1469-8137.2003.00695.x. [DOI] [PubMed] [Google Scholar]
- Wang Z, Hu H, Huang H, Duan K, Wu Z, Wu P. Regulation of OsSPX1 and OsSPX3 on expression of OsSPX domain genes and Pi-starvation signaling in rice. Journal of Integrative Plant Biology. 2009;51:663–674. doi: 10.1111/j.1744-7909.2009.00834.x. [DOI] [PubMed] [Google Scholar]
- Wu P, Xu J. Does OsPHR2, central Pi-signaling regulator, regulate some unknown factors crucial for plant growth? Plant Signal and Behavior. 2010;5:712–714. doi: 10.4161/psb.5.6.11645. [DOI] [PMC free article] [PubMed] [Google Scholar]
- Yi K, Wu Z, Zhou J, et al. OsPTF1, a novel transcription factor involved in tolerance to phosphate starvation in rice. Plant Physiology. 2005;138:2087–2096. doi: 10.1104/pp.105.063115. [DOI] [PMC free article] [PubMed] [Google Scholar]
- Yu B, Xu C, Benning C. Arabidopsis disrupted in SQD2 encoding sulfolipid synthase is impaired in phosphate-limited growth. Proceedings of the National Academy of Sciences, USA. 2002;99:5732–5737. doi: 10.1073/pnas.082696499. [DOI] [PMC free article] [PubMed] [Google Scholar]
- Yuan Y, Wu H, Wang N, et al. FIT interacts with AtbHLH38 and AtbHLH39 in regulating iron uptake gene expression for iron homeostasis in Arabidopsis. Cell Research. 2008;18:385–397. doi: 10.1038/cr.2008.26. [DOI] [PubMed] [Google Scholar]
- Zeng YJ, Ying J, Liu JZ, et al. Function analysis of a wheat phosphate transporter in yeast mutant. Journal of Genetics and Genomics. 2002;29:1017–1020. [PubMed] [Google Scholar]
- Zhou J, Jiao F, Wu Z, et al. OsPHR2 is involved in phosphate-starvation signaling and excessive phosphate accumulation in shoots of plants. Plant Physiology. 2008;146:1673–1686. doi: 10.1104/pp.107.111443. [DOI] [PMC free article] [PubMed] [Google Scholar]
- Zhu J, Kaeppler SM, Lynch JP. Mapping of QTLs for lateral root branching and length in maize (Zea mays L.) under differential phosphorus supply. Theoretical and Applied Genetics. 2005;111:688–695. doi: 10.1007/s00122-005-2051-3. [DOI] [PubMed] [Google Scholar]
Associated Data
This section collects any data citations, data availability statements, or supplementary materials included in this article.