

SUMMARY
Rhythmic oscillations are common features of nervous systems. One of the fundamental questions posed by these rhythms is how individual neurons or groups of neurons are recruited into different network oscillations. We modeled competing fast and slow oscillators connected to a hub neuron with electrical and inhibitory synapses. We explore the patterns of coordination shown in the network as a function of the electrical coupling and inhibitory synapse strengths with the help of a novel visualization method that we call the “parameterscape.” The hub neuron can be switched between the fast and slow oscillators by multiple network mechanisms, indicating that a given change in network state can be achieved by degenerate cellular mechanisms. These results have importance for interpreting experiments employing optogenetic, genetic, and pharmacological manipulations to understand circuit dynamics.
INTRODUCTION
Oscillatory neuronal circuits are ubiquitous throughout the nervous system (Wang, 2010) and play important roles in numerous complex behaviors, including sensory perception, decision making (Berke, 2009), attention (Heerebout and Phaf, 2010), and memory (Clapp et al., 2011), as well as in the generation of rhythmic behaviors such as respiration (Ramirez et al., 2004) and locomotion (Grillner, 2006). We study a computational model loosely motivated by the connectivity found in the crab stomatogastric ganglion (STG). The problem posed in this study is general: how are individual neurons or groups of neurons switched between, or recruited into, different oscillatory networks as a function of the strength of the electrical and chemical synapses in the network?
There are numerous examples of pattern-generating circuits that are multifunctional (Briggman and Kristan, 2008). Analysis of small rhythmic circuits has shown that the same neurons can participate in the generation of different rhythms and different behaviors (Dickinson et al., 1990; Hooper and Moulins, 1989, 1990; Hooper et al., 1990; Meyrand et al., 1991, 1994; Weimann and Marder, 1994; Weimann et al., 1991). In principle, a number of different cellular mechanisms could account for such switching of neurons from being part of one or another circuit, including changes in synaptic strength or alterations in the cellular properties of network components. These switchable components make it possible for circuits to recruit neurons into their rhythmic pattern and to interact with other ongoing rhythmic patterns. Distinct rhythms and rhythm-generating circuits can interact to gate information transfer and processing in the cortex; these interactions can occur via synchrony and interference between rhythms of differing frequencies (Roopun et al., 2008). An example is found in the neurons in layer 5 of auditory cortex that switch between distinct gamma oscillations in the granular layers and supragranular layers as a result of changing excitation (Ainsworth et al., 2011).
While electrical coupling often supports neuronal synchrony (Connors et al., 2010), there are numerous instances of electrical coupling between neurons that do not fire synchronously (Marder, 1998; Marder and Calabrese, 1996). Moreover, when oscillatory neurons are coupled to neurons with different intrinsic properties, the electrical coupling can increase or decrease the oscillation frequency of a neuron depending on a number of factors such as the voltage oscillation waveform, the intrinsic properties of the coupled cell, and the strength of the coupling (Kepler et al., 1990; Kopell et al., 1998; Soto-Treviño et al., 2005). Modeling and electrophysiology studies have shown that the oscillations of a mutually inhibitory pair of neurons can be stabilized by electrical coupling (Bem and Rinzel, 2004) and that electrical coupling can induce bistable switching between firing patterns (Bem et al., 2005).
Electrical coupling may add complexity to neuronal circuits containing chemical synapses by creating parallel pathways: multiple ways in which a given presynaptic neuron caninfluence the activity of a postsynaptic neuron, such as seen in C. elegans (Bargmann, 2012; Macosko et al., 2009) and the crustacean stomatogastric nervous system (Marder, 1984; Marder and Bucher, 2007). In both cases, the parallel pathways are important for understanding how these circuits can produce different behaviors.
This led us to explore the general problem of how the strength of electrical and chemical synapses influences how neurons switch between two different oscillatory behaviors. In the process of doing this work, we developed a new visualization tool, the parameterscape, which will be invaluable for developing intuitions about how circuit dynamics arise from the behavior of individual components. The parameterscapes allow us to see the extent over which network behaviors are robust to parameter variation, as well as to identify multiple paths by which transitions between behaviors may occur.
RESULTS
Circuit Switching in the STG Motivated this Study
The STG generates two rhythms, the fast pyloric rhythm and the slow gastric mill rhythm. Although it is sometimes convenient to think of the STG as having two separate networks, in reality there are numerous chemical and electrical synaptic interactions among neurons in both subnetworks, and many neurons switch between firing in time with the pyloric and gastric mill rhythms (Bucher et al., 2006; Dickinson et al., 1990; Katz and Harris-Warrick, 1991; Meyrand et al., 1991, 1994; Weimann and Marder, 1994; Weimann et al., 1991). The connectivity of the STG is shown in Figure 1A. Note that the IC neuron (black) is electrically coupled to both the lateral pyloric (LP) neuron, which fires in antiphase with the PD neurons in the pyloric rhythm, and to the LG neuron, which commonly fires in antiphase with Interneuron 1 (Int1) during robust gastric mill rhythms. The IC neuron also receives inhibitory input from both gastric and pyloric neurons and is known to switch between pyloric and gastric-timed activity under different modulatory conditions that change network parameters (Weimann and Marder, 1994; Weimann et al., 1991).
Figure 1. Connectivity Diagram of the C. borealis STG and Model Circuit.

In all diagrams colored circles represent neurons, resistor symbols indicate electrical coupling, and arcs terminating in filled circles indicate inhibitory chemical synapses.
(A) The PD and LP cells (red) are conventionally part of the pyloric (fast) circuit; LG and Int1 (blue) are nominally part of the (slow) gastric circuit. The IC neuron (black) has synaptic connections between the pyloric and gastric circuits.
(B–D) Voltage trace of the isolated hub neuron, which has an intrinsic oscillation frequency of 0.57 Hz (B). Half-center oscillators are formed by reciprocally inhibiting fast (C) and slow (D) cells, producing rhythmic frequencies of 0.79 Hz and 0.36 Hz respectively.
(E) Electrically coupling (gel = 5 nS) hn to f2 and s2 results in synchronous firing.
(F) Connectivity diagram of the full model network used in this study.
(G and H) Model-network voltage traces, from top to bottom: f1 (red), f2 (red), hn (black), s2 (blue), s1 (blue). (G) Example of hn oscillating with fast rhythm for a fixed set of synaptic parameters (gsynA = 1.5 nS, gel = 1.5 nS, gsynB = 5 nS). (H) Example of hn oscillating with the slow rhythm (gsynA = 2.5 nS, gel = 2.5 nS, gsynB = 5 nS). Black dashes indicate where membrane voltage is 0 mV.
The highlighted neurons in Figure 1A reveal a five-cell symmetrical circuit in which a central hub neuron interacts with two reciprocally inhibitory oscillatory subcircuits. This prompted us to construct a generic, conductance-based model with two intrinsic oscillator cell pairs coupled to a central cell to investigate which circuit parameters affect switching. While motivated by the connectivity of the STG, the model described below was not intended to model the specifics of STG dynamics, but to address more general questions about the interaction between electrical coupling and pattern generation.
The Model
Each cell in the five-cell network is modeled as an oscillatory Morris-Lecar (Morris and Lecar, 1981) neuron with an additional hyperpolarization-activated conductance (Experimental Procedures). Morris-Lecar neurons exhibit slow oscillations that were originally intended to model calcium- and potassium-dependent bursting in barnacle muscle, but the bursting mechanism is equivalent to that found in many invertebrate and vertebrate neurons (Izhikevich, 2007). This model can therefore be taken as a generic model of neurons with slow oscillations that drive bursts of fast action potentials, such as in the STG. In keeping with the known physiology of STG neurons, the synaptic connections within the model network are a graded function of membrane potential. While we do not model fast action potentials explicitly, we define a threshold (0 mV) above which the cells are considered to be firing.
Figure 1B shows the activity of a single model neuron in isolation. To avoid artifactual synchrony in the connected network, we set the frequencies of the isolated neurons to noninteger multiples of each other (Experimental Procedures). We refer to the cells in the “fast” and “slow” oscillator pairs as f1, f2 and s1, s2, respectively. When these fast and slow oscillator neuron pairs are coupled with reciprocal inhibitory synapses, they fire in antiphase as half-center oscillators (Figures 1C and 1D). In contrast, serial electrical coupling of a three-cell network comprising a fast and slow oscillating neuron and an intermediate “hub” neuron (hn) induces synchronous membrane potential activity in spite of the cells’ differing intrinsic frequencies (Figure 1E). These simple network motifs—reciprocal inhibition and serial electrical coupling—give rise to antiphase and in-phase synchrony, respectively (Kopell and Ermentrout, 2004).
The five model neurons are connected as shown in Figure 1F, which recapitulates the motif seen in the STG network in Figure 1A. f2 and s2 are electrically coupled to hn while f1 and s1 make inhibitory synapses onto hn. Given the topology of hn’s synaptic connections with the fast and slow cell pairs, we hypothesized that the relative strengths of these electrical and chemical synapses constitute an important set of circuit parameters that may cause hn to follow either the fast or the slow rhythm. A preliminary investigation in which electrical and synaptic connection weights were kept equal to each other revealed more than one outcome. Hn joined the fast rhythm (Figure 1G) when conductances of both the electrical (gel) and chemical (gsynA) synapses were both 1.5 nS, but setting both parameters to 2.5 nS caused hn to join the slow rhythm (Figure 1H). We therefore decided to investigate how hn’s activity is influenced across a range of conductances for the electrical and inhibitory synaptic connections.
Hub Neuron Behavior as a Function of gel and gsynA
Figure 2 shows a map of hn’s output frequency when the network is simulated for a range of gel and gsynA values. Several regions of parameter space show relatively constant frequency with sharp transitions between them. Of particular note is a thin “tongue” region (we use this term as it is often used in dynamical systems theory for thin regions of parameter space) of fast frequency output corresponding to a low, constant electrical coupling strength of 0.5 nS (Figure 2B). A small increase in gel above the tongue causes hn’s frequency to drop and remain low throughout a large region (Figures 2C and 2D).
Figure 2. Hub Neuron Frequency as a Function of gel and gsynA.

Color map of mean hn frequency as a function of electrical synaptic conductance (gel) and inhibitory synaptic conductance (gsynA). Half-center synaptic strength is fixed throughout (gsynB = 5 nS). Hub neuron frequency is color coded with warm colors representing high frequencies (maximum = red = 0.80 Hz) and cool colors representing low frequencies (minimum = dark blue = 0.3 Hz). Labeled points (A–H) on the plot represent parameter sets corresponding to different regimes of hub neuron activity, with example traces shown beneath (scale bars represent 1 s, 100 mV; intersecting mark = 0 mV in each trace). The dashed white box indicates the tongue region examined in Figure 3.
At low values of gsynA, hn frequency is high but relatively sensitive to the value of gel (Figures 2E–2H). Over the majority of parameter space, hn’s frequency is close to the intrinsic frequency of either the fast or the slow half-center oscillators. Nonetheless, there are extended regions of parameter space where hn exhibits intermediate frequencies (region G) or makes smooth frequency transitions (Figures 2E, 2F, and 2H).
These results indicate a complex relationship between hn’s behavior and synaptic coupling strength in spite of the fact that the electrical and synaptic conductances connecting hn to both oscillators were varied symmetrically (Figure 1F). One aspect of this complexity is illustrated in the many-to-one relationship between the synaptic parameters we varied and hn’s output. For example, hn’s frequency at the start of the tongue region (gsynA = 3 nS, gel = 0.5 nS) is similar to that at the point in parameter space where these values are swapped (gsynA = 0.5 nS, gel = 3 nS).
The Transition through the Tongue
Figures 2 and 3 show that hn makes a transition from low to high frequencies as gel goes from 0 nS to 0.5 nS and then down again as gel is further increased for values of gsynA above 2.5 nS. A detailed inspection of the transition through the tongue demonstrates the mechanisms that are responsible for the complex behaviors exhibited by the network.
Figure 3. Close-Up of Tongue Region.

Voltage traces for the tongue region (as highlighted in the dashed, white box in Figure 2) with finer increments in gel; gsynA = 3 nS throughout. Background color roughly corresponds to hn frequency (red = high, blue = low) with the darker bands indicating the three points in the dashed white box of Figure 2. Dashed lines corresponding to s1 spikes are overlaid on all traces to elucidate when integer coupling becomes apparent. Scale bars for all traces represent 50 mV, 1 s. Five-cell network connectivity is displayed at the bottom.
Figure 3 shows voltage traces of the neurons in small increments of gel with gsynA set to 3 nS. When gel is low (bottom traces, Figure 3), hn fires irregularly and the fast oscillators are not phase locked to the slow oscillators. As electrical coupling is increased, this continues to be the case until gel reaches the critical value of 0.5 nS. At that point, the fast and slow oscillators lock into a 2:1 frequency relationship and hn fires regularly with the fast oscillators. Stable hn firing, and thus stable network output, coincides with the integer coupling between the fast and slow oscillators. The transition out of the tongue occurs once the electrical coupling is high enough to divert current from hn during s2’s and f2’s off-phases. Here, in-phase electrical synchrony emerges between s2 and hn, which, combined with antiphase inhibitory inputs from the other half-center cells, f1 and s1, serve to maintain a stable pattern of network activity as gel increases (top traces, Figure 3).
Evaluating the Role of the Electrical Coupling
Examining a small vertical region through the tongue demonstrated the importance of integer coupling for this system: hn transitions from firing sporadically to oscillating with one of the rhythmic competitors as integer coupling arises. To evaluate the effect of the electrical synapses on the network dynamics, we forced hn with the total synaptic drive (both electrical and chemical) from the fast and slow oscillators but turned off the electrical coupling back to the f2 and s2 neurons from hn. This is analogous to using a dynamic clamp by introducing electrical and inhibitory conductances in hn with a “presynaptic” voltage waveform corresponding to the slow and fast half-centers oscillating independently of hn’s influence. We did this in two different conditions: (1) with forcing frequencies equal to the initial, non-integer-coupled frequencies of the isolated half-centers (Figures 1C and 1D), and (2) with in-phase forcing at a 2:1 frequency ratio.
Figure 4A shows the effect of forcing hn at the frequencies of the non-integer-coupled isolated oscillators. Note that hn frequency varies smoothly across the range of synaptic parameters. In contrast, when hn is forced with fast and slow synaptic drives that are integer coupled (Figure 4B), hn oscillates at either a low or a high frequency with an abrupt boundary between these regions. These two cases produce neither the tongue region, nor the complex transitions in hn frequency evident in the rest of Figure 2.
Figure 4. Preventing the Influence of the Hub Neuron on the Rest of the Network.

(A) Conductance waveforms fed into hn at natural half-center oscillator frequencies (slow 0.36 Hz, fast = 0.79 Hz).
(B) Driving hn with conductance waveforms resulting from a precise 2:1 frequency and zero-phase relation (slow 0.36 Hz, fast = 0.72 Hz).
These differences illustrate the importance of the feedback through the electrical synapses from hn back to the fast and slow oscillators for the dynamics in the full network. In particular, the emergence of integer coupling between the slow and fast oscillators provides coordinated inhibition at a consistent phase of hn activity as seen in Figure 3. Furthermore, Figures 3 and 4 show that in order to understand hn’s behavior as a function of synaptic parameters, we need to access the behavior of the network as a whole.
The Parameterscape: A Novel Visualization Tool
To visualize the oscillation frequency of each cell in the entire network as a function of gel and gsynA, we developed a novel way of plotting network activity, the “parameterscape” (Figure 5). Each point in the parameterscape represents the mean frequency of each of the five neurons in the network via a color coding of five concentric shapes. The colors of the innermost rings encode the frequencies of the s1 and s2 neurons, the outermost rings encode the frequencies of the f1 and f2 neurons, and the square is colored according to hn frequency (see example at top left of Figure 5). This plotting method allows the frequencies of all five cells to be compared at any given point and across entire regions of parameter space. The choice of a square symbol for hn creates a visual contrast that allows immediate identification of regions where hn joins either the fast or the slow rhythms.
Figure 5. Parameterscape of Network Frequencies as a Function of gel and gsynA.

A plot showing the firing frequency of each of the five cells in the model network, color coded according to the key (top left) with the color scale to the right of the plot. Each cell corresponds to a concentric ring from outermost to innermost as follows: f1, f2, hn (square), s2, and s1. Within the parameterscape, regions of patterned network activity and hub neuron switching are apparent.
(A–H) Example voltage traces corresponding to each labeled region. Traces from top to bottom are f1, f2, hn, s2, and s1. (A) hn oscillates irregularly at low frequency (gsynA = 6 nS, gel = 0 nS). (B) As electrical conductance is increased (gsynA = 6 nS, gel = 0.5 nS), hn switches its activity to join the fast rhythm. (C) A further increase in electrical conductance causes hn to oscillate in time with the slow rhythm (gsynA = 6 nS, gel = 2.5 nS). (D) Increasing electrical conductance further still (gsynA = 6 nS, gel = 6 nS) leaves hn oscillating in time with the slow rhythm; however, f2 also oscillates with the slow rhythm. (E) hn oscillates in time with the fast rhythm (gsynA = 1 nS, gel = 2 nS). (F) hn again oscillates in time with the fast rhythm but s2 oscillates irregularly (gsynA = 1 nS, gel = 4 nS). (G) All cells in the network oscillate at the same intermediate frequency (gsynA = 2 nS, gel = 5.5 nS). (H) hn oscillates at a slightly higher frequency than in (G) along with all other neurons except for s1, which oscillates at half this frequency (gsynA = 1 nS, gel = 7 nS). All traces: scale bars represent 100 mV, 1 s; intersecting marks = 0 mV.
Several features are apparent in the parameterscape that cannot be seen in the plot of hn frequency alone. Regions C and D in Figure 5 represent distinct modes of network activity despite the fact that hn’s frequency is broadly similar in these two regions. In region C, the fast cells f1 and f2 have the same high frequency, but in the transition to region D the electrically coupled cell in the pair (f2) joins hn at the slow oscillator frequency. Similarly, in region H the electrically coupled slow oscillator (s2) joins hn and the fast subnetwork, leaving its mutually inhibiting partner, s1, to oscillate alone at a low frequency. Finally, region G, which appears as a zone of intermediate hn frequency in Figure 2, corresponds to a mode in which the entire network oscillates at the same frequency.
The parameterscape allows one to see large regions of similar network output that are robust against small changes in synaptic conductances such as in region D, for example. Such regions illustrate an extensive set of solutions available for achieving a particular network behavior, while more compact regions (region G, for example) require tighter tuning of synaptic conductances.
Network Phase Relationships
The previous analysis focused on the frequency relationships of the neurons in the network. However, in most networks, including those important for motor pattern production, the phase of neuronal firing is as at least as important as frequency (Marder and Calabrese, 1996; Tang et al., 2012), as it is the relative timing of motor neuron activity that determines gait and other functions of motor systems. Likewise, phase relationships are important for understanding the emergence and stability of oscillatory relationships in the network because this depends on the timing of electrical and synaptic inputs.
Phase relationships cannot be inferred from mean frequency relationships alone; irregular, asynchronous activity can, in principle, give rise to consistent average frequency. Figure 6 shows a phase parameterscape over the same range of parameters shown in Figure 5. Figure 6 also shows normalized phase plots of each neuron’s activity relative to that of s2 at different locations of the parameterscape, much as phase is often plotted in analysis of motor patterns (Marder and Calabrese, 1996; Tang et al., 2012). We calculated the variance of the phases across the parameterscape (not shown) and with the exception of region A, region F, parts of region H, and many of the transitions between regions, the variance was low, indicating that the phases shown are representative of the behaviors in those regions.
Figure 6. Phase Relations Reveal Patterned Network Output.

The phase of each neuron relative to the ON phase of s2 is plotted on the parameterscape, with relative phase color coded in concentric rings as in Figure 5. Neurons that are in phase with s2 are represented in white and those in antiphase are violet. Phase diagrams are shown for each of the points on the parameterscape labeled (A)–(H) (bottom). Each block represents the ON period (Vm > 0 mV) for each neuron. Four full ON periods for s2 are shown in each case.
A comparison of the frequency (Figure 5) and phase (Figure 6) parameterscapes makes it obvious that neurons that share a common frequency need not be synchronously active. This is seen in the raw traces in Figure 5G as well as in Figure 6G. Point G in the frequency parameterscape (Figure 5) is all green, indicating that all five neurons are firing at the same intermediate frequency. The phase parameterscape and phase plots (Figure 6) show that the five neurons are firing in three phases at position G, with s1 and f2 firing in one phase, s2 and hn firing in a second phase, and f1 firing alone at a third phase.
Similar conclusions are seen at all of the other regions of the parameterscapes. For example, in region D in the frequency parameterscape, only f1 is firing rapidly and the other four neurons are in a slow rhythm. However, the phase parameterscape indicates clearly again that while s2, hn, and f2 are in phase, they are firing in antiphase with s1.
Understanding Transitions in Behavior as a Function of Parameters
The parameterscapes in Figures 5 and 6 show a number of transitions in network behavior that occur as gsynA and gel are changed. In this section, we provide an intuitive account of how the different regimes of network dynamics arise across the parameterscape.
In most of the left-hand region of the parameter plots (Figures 2, 5, and 6), the strength of inhibitory input through gsynA is small (0 to ~2 nA) relative to the strength of the electrical coupling. As electrical coupling increases, the phases of f2, hn, and s2 become synchronized. But, because gsynA is small and the other half-center oscillator cells (f1 and s1) are out of phase with each other, they do not provide sufficient synchronous inhibitory input to prevent hn from reaching threshold (Figure 6, regions E through H), and therefore hn fires with the fast rhythm.
As the strength of the electrical coupling increases, there is also a transition in s2’s activity (Figures 5 and 6; regions E, F, and H). In region E, hn and s2 are synchronized in a 2:1 firing pattern. In F, the electrical coupling between hn and s2 is now large enough to interrupt s2’s regular oscillations, but not large enough to dominate s2’s intrinsic membrane conductances. Thus, s2 becomes irregular as these influences battle. When the electrical coupling is further increased through region H, s2, hn, and f2 are so strongly coupled that their activity represents an average of all three cells’ intrinsic properties, and s1 is left alone firing at a low frequency.
This electrotonic merging of the intrinsic membrane properties of hn, f2, and s2 explains why hn’s average frequency moves through intermediate values in regions F, G, and H (Figure 2) rather than switching between the endogenous frequencies of the slow and fast half-center oscillators. In region G, the intermediate frequency determined by the combined intrinsic properties of s2, hn, and f2 is close to both half-center frequencies. As a consequence, the entire network settles into an intermediate frequency and s1 and f1 fire sequentially with their mutually inhibiting partners. This tug-of-war between asynchronous inhibition and electrical coupling serves to keep a stable sequential phase relationship across the network, with each cell firing in turn at the same frequency (Figure 6G).
Region H occurs when gsynA is low and there is strong in-phase electrical coupling that causes f2, hn, and s2 to fire closely in phase at a higher frequency than in G. This rise in frequency breaks the cycle alternation between s2 and s1, with s1 being inhibited at the point of reaching threshold on alternate cycles (H). The break-up of the slow half-center pair contrasts with the loss of the fast half-center relationship, which occurs as gsynA is increased toward region D. Here, hn’s frequency is lower due to inhibition through gsynA on alternate cycles, but the high electrical coupling entrains f2 with hn and this results in the break-up of the half-center relation between f1 and f2.
The Strength of Half-Center Coupling Affects Output Patterns
Thus far we have focused on the relative strengths of the gel and gsynA synapses that both drive hn and have complex effects on network behavior. An important part of the mechanism underlying these effects is the robust antiphase synchrony between the cells in the half-center oscillators that form the distinct pattern-generating parts of the circuit. Therefore, we investigated the effects of altering the strength of the inhibitory synapses that form the half-center oscillators, gsynB. Figure 7 shows the effect of changing gsynB on network output. To facilitate comparison between each case, the regions corresponding to stereotypical frequency relations between the cells are color coded. This allows us to track regions of stereo-typed network activity as gsynB is altered. For example, region E (orange region in Figure 7, middle plot) shrinks when half-center coupling is decreased to half its original value (gsynB = 2.5 nS, Figure 7, top plot). In contrast, doubling gsynB expands this region along the gel axis (gsynB = 10 nS, Figure 7, bottom plot).
Figure 7. Network Activity for Different Half-Center Coupling Strengths.

Schematic maps of network frequency relationships for different values of half-center coupling strength, gsynB = 2.5 nS, 5 nS, and 10 nS (top to bottom). Each colored region represents a different class of network activity as shown by the legend at the bottom (blue cells = oscillating in time with slow rhythm, green cells = oscillating at intermediate frequency, orange cells = oscillating with fast rhythm). Black stars correspond to the activity shown in Figure 8.
Altering half-center coupling in this way not only changes the location and shape of stereotyped activity regimes with respect to the original parameterscape, but it can also destroy regimes and introduce new ones. The yellow region, corresponding to all cells firing at the same frequency except s1 (Figure 7, middle plot), disappears when gsynB is increased to 10 nS (Figure 7, bottom plot). Intuitively, this occurs because stronger half-center coupling makes s2 less likely to be pulled away from firing in anti-phase with its mutually inhibitory partner.
In contrast, reducing gsynB to 2.5 nS introduces a new region in which hn, s2, and f2 fire at the same intermediate frequency, while each of the remaining half-center cells fire at (or very near) their own endogenous fast and slow frequencies (red region, Figure 7, top plot). This type of network activity has replaced the mode in the original parameterscape where all cells in the network fire at the same frequency (region G). Two features of network connectivity explain the behavior in this new region. Strong electrical coupling between hn, s2, and f2 enables these cells to fire synchronously at the same frequency while lower half-center coupling means f2 and s2 lose synchrony with s1 and f1, which then revert to firing close to their endogenous frequencies. Together with the two other synaptic parameters, gel and gsynA, we see that the network possesses multiple paths through parameter space to move between regions of stereotyped activity.
DISCUSSION
Much of neuroscience is based on the assumption that nervous systems can be deconstructed into subsystems, modules, or microcircuits whose behavior can be understood on the basis of interactions among individual neurons. This is motivated by the hope that once each piece of the nervous system is understood in isolation, it will be possible to understand how these modules interact in the full brain. In spite of this hope, neuronal networks (and biological networks in general) exhibit two features that make the task of understanding them onerous. First, they are nonlinear, and therefore their function cannot be understood as a straightforward sum of their individual components. Second, the connectivity between components often includes heterogeneous parallel pathways that connect two neurons, or nodes, by two or more routes. These features help explain why biological systems such as nervous systems can be both robust and flexible: multiple combinations of components and parameters can produce stereotyped behavior and multiple routes between these behaviors are available. However, such complexities also mean that the causal link between network behavior and its underlying parameters, components, and interactions can only be appreciated by studying the network as a whole. This requires novel means of analysis, including new visualization tools.
In this paper we describe the behavior of a five-neuron circuit in which a hub neuron is connected to two different oscillatory subnetworks. While the specific circuit studied here was initially motivated by connectivity in the crab STG, it is not intended to be a specific model of the STG, but rather to illuminate some of the principles that can arise in a circuit of midrange complexity combining oscillatory elements and both electrical and chemical synapses. Although we model each neuron with equations that represent ionic currents, each neuron in this study could be a stand-in for groups of neurons or circuits with oscillatory dynamics.
Rather than attempt a purely mathematical analysis of network behavior, which is only possible in nonlinear systems in a few special cases, we opted for an intuitive, visual account of the dynamics and interactions of all of the neurons. Toward this end, we developed a novel means of visualizing a five-dimensional output space (firing frequencies and phases of all neurons) over a two-dimensional parameter space, the parameterscape. In principle, the parameterscape method could be used to display other neuronal or network attributes of interest besides frequency and phase and for ~2–8 dimensions.
Electrical Synapses, Synchrony, and Parallel Pathways
Many studies that are intended to illuminate how the dynamics of networks arise from neuronal interactions employ reduced neuronal models with simple dynamics that are coupled exclusively by chemical synapses. Biological neurons displaying complex dynamics, including intrinsic oscillations, and electrical synapses are far more prevalent than previously thought (Bennett, 2000a, 2000b; Bennett and Zukin, 2004; Connors et al., 1983, 2010; Connors and Long, 2004; Haas and Landisman, 2011, 2012; Haas et al., 2011; Landisman and Connors, 2005; Pereda et al., 2013; Traub, 1995). Although the importance of brain oscillations is widely appreciated (Wang, 1999, 2010), the complexity that electrical synapses can contribute to network dynamics is often underestimated (Mulloney et al., 1981). Because current can flow in both directions through electrical synapses and because that flow can continue when a neuron is hyperpolarized, silent neurons can influence the activity of their electrically coupled partners (Kepler et al., 1990). Moreover, although electrical coupling often increases synchrony (Bennett and Zukin, 2004), there are cases of electrical coupling between functional antagonists that normally fire out of phase (Marder, 1984; Mulloney et al., 1981). Weak coupling itself can produce antiphase behavior (Sherman and Rinzel, 1992) and can result in desynchronization (Vervaeke et al., 2010). Electrical coupling can also induce network oscillations in neurons that are not oscillatory in isolation (Manor et al., 1997; Sherman and Rinzel, 1992). In view of this, an important message of our study lies in the complex dynamics that can arise when neuronal oscillators are connected by electrical synapses (Kopell and Ermentrout, 2004; Traub et al., 2011, 1996).
The present study illustrates that electrical coupling in combination with chemical synapses can produce nonintuitive and subtle effects in networks. In particular, in this study the electrical synapses produced integer coupling, which then created stable regimes of network activity as well as the substrate for switching between regimes. This demonstrates the potential for electrical synapses to play a major role in coordinating networks with distinct rhythmic frequencies. In the full network, hn’s activity is influenced by the inhibitory synapses from the f1 and s1 neurons, but the electrical coupling through hn also influences the frequency of the half-center oscillators, which in turn changes the frequency of the synaptic drive to hn. This looping, reciprocal influence among the components of the circuit provides the rich dynamics that are evident in the full-circuit parameterscapes and completely absent in the artificial situation where hn is merely driven by the half-center oscillators (Figure 4).
Furthermore, hn’s influence on half-center frequency is significant in spite of the fact that changes in half-center coupling strength (in the ranges studied) had very little effect on the frequencies of the half-center pairs in isolation. This is due to the fact that electrical synapses are active throughout the full range of membrane potential and therefore have a potent effect on the effective intrinsic dynamics of the coupled cells. For strong electrical synapses, one can think of coupled cells as becoming compartments of an electrical syncytium in which intrinsic properties are merged.
An essential feature of the five-neuron network that we studied is the presence of parallel pathways that connect each neuron to hn by multiple routes. For example, f1 directly inhibits hn but also can influence hn’s behavior by virtue of its connections with f2. Thus, although one might think that a three-cell network would be sufficient, the additional dynamics produced by the parallel pathways would be lost in a three-cell reduction of the five-cell network. Specifically, due to the antiphase nature of the half-center oscillators, they could not be trivially replaced with a single oscillator. Moreover, the presence of the parallel pathways enables degenerate, multiple mechanisms for switching; three distinct mechanisms for switching that involve parallel pathways are shown in Figure 8.
Figure 8. There Are Multiple Solutions for Switching Hub Neuron Activity between Competing Oscillators.
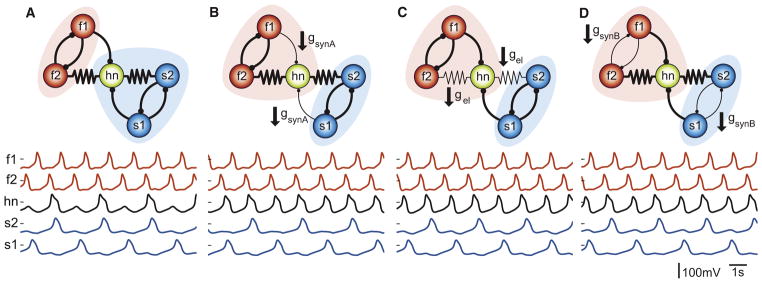
(A) The model network with a given set of synaptic conductances (gsynA = 3.5 nS, gsynB = 5 nS, gel = 1 nS) produces a behavior in which the hub neuron oscillates with the slow rhythm. Switching the hub neuron to oscillate with the fast rhythm can be achieved by any one of the following three synaptic changes.
(B) Decreasing gsynA to 1.5 nS switches the hub neuron into the fast rhythm (gsynA = 1.5 nS, gsynB = 5 nS, gel = 1 nS).
(C) Decreasing gel to 0.5 nS switches the hub neuron to the fast rhythm (gsynA = 3.5 nS, gsynB = 5 nS, gel = 0.5 nS).
(D) Decreasing gsynB to 2.5 nS also switches the hub neuron to the fast rhythm (gsynA = 3.5 nS, gsynB = 2.5 nS, gel = 1 nS).
Similar Changes in Circuit Output Can Arise from Different Circuit Mechanisms
The present study made it clear that the behavior of hn is strongly influenced by the strengths of the electrical and chemical synapses gel, gsynB, and gsynA. Moreover, as one sweeps any of these parameters, it is clear that the network behavior makes several transitions. Consequently, it is not surprising that similar changes in network dynamics can result from multiple, different mechanisms. Figure 8A shows a network in which hn was firing in the slow rhythm, in phase with s2, and in alternation with s1. In Figure 8B, gsynA was decreased, leaving all other parameters the same as in Figure 8A, resulting in hn switching into the fast rhythm and firing just after f2. Similar results were seen when either gel (Figure 8C) or gsynB (Figure 8D) was decreased. Thus, from these starting parameters, virtually identical network consequences result from three entirely different parameter modifications.
Previous work (Marder, 2011; Prinz et al., 2004) had demonstrated that similar network output can result from a range of parameters as is also seen in the large regions of similar behavior in the parameterscapes. This study adds the insight that similar changes in network output can result from qualitatively different circuit modifications, seen as transitions across robust regions in parameter space. This illustrates an important aspect of biological degeneracy that is distinct from the “multiple solutions” that make up a single region, namely, that the mechanisms of switching are also degenerate. Thus, extended regions of similar network output mean that these regimes are robust to small variations in circuit properties. Importantly, this robustness is accompanied by numerous routes between regions.
Degenerate Circuit Mechanisms Ensure Robustness and Complicate Analysis
Much of what we today know about how biological neuronal circuits work comes from the relatively small circuits found in invertebrates (Lamb and Calabrese, 2011, 2012; Marder and Bucher, 2001, 2007; Marder and Calabrese, 1996; Selverston, 2010). These circuits had small enough numbers of neurons to allow the identification of individual neurons, to allow electrophysiological studies of connectivity, and to make feasible electrophysiological perturbations and deletions of a single or few neurons to reveal their functional roles in circuit dynamics (Büschges et al., 2004; Mayeri, 1973; Miller and Selverston, 1979; Miller and Selverston, 1982a, 1982b; Mulloney, 2003; Pearson et al., 1985; Russell, 1985; Weimann and Marder, 1994). Until quite recently in vertebrate preparations, the large number of neurons of any given type made it difficult to perturb their activity as a whole. Advances in genetics and the development of optogenetic techniques now make it possible to manipulate the activity of neurons without intracellular recordings (Diester et al., 2011; Fenno et al., 2011; Griffith, 2012; Pulver et al., 2009; Yizhar et al., 2011; Zhang et al., 2010) and thus to simultaneously perturb all neurons of a given cell type.
Thus, we are starting to see a plethora of studies combining genetic and optogenetic manipulations designed to determine the circuit elements responsible for a given behavior. In most cases the actual connectivity among the candidate neurons is not known. Our study illustrates the potential confounds that can accompany the results of these kinds of experiments, as well as pharmacological and lesion experiments.
Figure 8 shows that three different circuit manipulations can result in virtually identical changes in circuit dynamics. Specifically, the hn neuron can be switched from firing with the slow s1/s2 neurons to firing with the fast f1/f2 neurons by three different mechanisms: (1) decreasing gsynA, (2) decreasing the electrical coupling, or (3) decreasing gsynB. It is quite easy to imagine that a given study might appropriately reveal any one of these mechanisms and that the investigators might then conclude that the mechanism in question is solely responsible for the change in circuit dynamics without realizing that there are other routes to the same change in circuit dynamics. Likewise, a different study might reveal a different one of these mechanisms, and a further study yet another. Without the appreciation that there may be a series of degenerate mechanisms that can result in similar changes in circuit function, it might be difficult to reconcile the results from disparate studies. Consequently, it is necessary to bear in mind that every manipulation that results in changed circuit output may be only one of several that can produce similar changes. Moreover, this work shows the critical need to have a reliable connectivity diagram, or connectome, for the circuit or system at hand as this makes it more possible to test alternative hypotheses about how circuit dynamics arise. Hopefully, our study will motivate and justify the exhaustive examination of neuronal circuits and their mechanisms as well as motivate the synergy of our understanding of small circuit components with studies of global circuit function.
In summary, in this relatively simple model we had the luxury of interrogating many of the possible features of the network dynamics. This luxury is not available when studying biological networks in general, so care must be taken to understand the degree to which the system in question exhibits nonlinearity or degeneracy when the behaviors of its components are summed together. These two generic features, nonlinearity and degeneracy, while proving to be obstacles to a mechanistic understanding of nervous system function, also explain its flexibility, the richness of its repertoire of behaviors, and, in the case of degeneracy, its robustness.
EXPERIMENTAL PROCEDURES
Equations
Cells were modeled as modified Morris-Lecar (Morris and Lecar, 1981) cells where each cell’s membrane voltage, Vm, was computed by solving the membrane equation:
Cm is the membrane capacitance and is equal to 1 nF for all neurons. Model currents included a leak current (Ileak), a calcium current (ICa), a potassium current (Ik), and a hyperpolarization-activated current (Ih). The hyperpolarization-activated current was based on equations and parameters that were modified from Turrigiano et al. (1995). The remaining ionic currents were based on equations modified from Skinner et al. (1993). Reversal potentials for the various currents are Vleak = −40 mV, VCa = 100 mV, Vk = −80 mV, Vh = −20 mV, and Vsyn = −75 mV. M∞, N∞, and H∞ are steady-state gating variables for the calcium, potassium, and hyperpolarization-activated currents, respectively. N and H are time-dependent gating variables for the potassium and hyperpolarization-activated currents.
where v1 = 0 mV and v2 = 20 mV.
where v3 = 0 mV and v4 = 15 mV.
The gating variable, N, is modified by λN, a hyperbolic, U-shaped curve whose nadir height and eccentricity are determined by ϕN, which equals 0.002 ms−1.
where v5 = 78.3 mV, v6 = 10.5 mV, v7 = −42.2 mV, v8 = 87.3 mV.
The variable τh is the voltage-dependent recoverytime constant. It controls the rate of change of H so that H changes less steeply for more depolarized voltages.
Electrical synapses were nonrectifying and instantaneous. The electrical conductance, gel, determined the strength of the electrical synapses. We used electrical coupling conductances ranging from 0.25 nS to 7.5 nS.
Chemical inhibitory synapses were modeled by equations modified from Prinz et al. (2004). They were modeled instantaneously. For the first parameter-scape presented, we ran a version using noninstantaneous synapses to compare to the instantaneous data but saw no qualitative difference that would justify modeling chemical synapses noninstantaneously. Sinfin; is the steady-state synaptic current gating variable and was modeled after the graded synaptic transmission seen in crustacean stomatogastric neurons. We used inhibitory synaptic strengths ranging from 0.25 nS to 10 nS.
where v9 = 5 mV and vth = −25 mV.
Kinetic parameters for the ionic condtances were set tophysiologically realistic values wherever possible. Maximal conductances for the three different neuron types were chosen to achieve the intrinsic oscillation frequencies required (fast [f1, f2], gCa = 1.9 × 10⁻², gk = 3.9 × 10⁻², gh = 2.5 × 10⁻² μS; intermediate [hn], gCa = 1.7 × 10 −2, gk = 1.9 × 10 −2, gh = 8.0 × 10⁻³ μS; slow [s1, s2], gCa = 8.5 × 10⁻³, gk = 1.5 × 10⁻², gh = 1.0 × 10⁻² μS; all gleak = 1 × 10⁻⁴ μS). Care was taken to ensure that individual, intrinsic oscillation frequencies are not integer multiples of each other and that half-center oscillator frequencies are not integer multiples of the competing half-center oscillator nor of the hub neuron.
Simulations and Algorithm
All data and figures presented in this paper are from simulations performed in MATLAB using the variable time-step solver ode45 function (4th/5th order Runge-Kutta integration). Simulations produced 655-s-long voltage waveforms for each of the five neurons. The first 55 s were eliminated from analysis. The relaxation time constant of an electrically coupled system of two Morris-Lecar neurons was estimated to be approximately 2 s when the electrical coupling conductance was set to the lowest nonzero value used in our simulations, thus providing an upper bound. By plotting the change in normalized phase relative to s2 for the five-cell network it was confirmed that our estimate was of the correct order, although we chose to be conservative by discarding the first 55 s of the simulation.
The forcing plot with integer coupling blocked was constructed by storing half-center pair waveforms (uncoupled from hn) and using these as forcing functions in the membrane equation for hn. Electrical coupling coefficients in the membrane equations for s2 and f2 are set to zero. Thus the system is described as:
where Idrive is the current resulting from the electrical and inhibitory coupling:
Numerically this was achieved by solving hn’s membrane equation with a 4th-order variable time-step integrator where the driving functions [Vs1 (t), Vs2 (t), Vf1 (t), and Vf2 (t)] were linearly interpolated from the stored data (sampled at 0.1 ms intervals).
The forced integer-coupling plot was constructed by simulating the network as described with the exception that the slow and fast oscillator frequencies were set to an exact 2:1 ratio (slow = 0.3575 Hz, fast = 0.7150 Hz) and relative phase of the electrically coupled cell waveforms was set to zero. The membrane equation for hn is left unchanged.
Analysis and Plotting
Customized MATLAB scripts were made to compute the oscillation frequencies from the truncated 600 s lengths of data. The burst/spike threshold was set at 0 mV and frequency was calculated to be the inverse of the mean period over the 600 s interval.
Phase was defined relative to s2 for all neurons since they usually had a frequency higher than or equal to that of s2. If a neuron had two spikes in one s2 period, the second spike was not taken into account in the phase measurement. Phase-block plots show time that cells spent above the 0 mV threshold.
Parameterscapes
The parameterscapes are a novel way of visualizing five dimensions of a dynamical system as a function of two parameters on a single plot. The parameterscapes are optimal for visualizing a small number of dimensions or consolidated groupings of a large number of dimensions. In our study, we use a color code to represent the frequency or phase of all neurons in the model circuit as a function of the connectivity parameters gel and gsynA. Neurons were represented by concentric rings whose color mapped to the quantified parameter. The parameterscapes were specifically designed with a built-in optical illusion to direct attention to the neuron of interest. By depicting hn with a square between larger and smaller circles, it was possible to quickly identify which group hn synchronized with in our frequency parameter-scape. At a glance, a uniform circle within a circle indicated that the hub neuron synchronized with the neurons represented by the outer circles and a uniform square within a circle indicated that the hub’s activity was synchronized with the neurons depicted by the inner circles. In displaying these parameter-scapes, we find it easier to visually extract information when points are overlapped by ~25% and white space between points is eliminated. All parameter-scapes were done in MATLAB.
Acknowledgments
This work was funded by National Institutes of Health grants NS17813 and MH46742.
Footnotes
Author contributions: G.J.G. constructed the network model and developed the parameterscape method. G.J.G. and T.O. performed simulations and analyzed data. G.J.G., T.O., and E.M. designed the study and wrote the manuscript.
References
- Ainsworth M, Lee S, Cunningham MO, Roopun AK, Traub RD, Kopell NJ, Whittington MA. Dual γ rhythm generators control interlaminar synchrony in auditory cortex. J Neurosci. 2011;31:17040–17051. doi: 10.1523/JNEUROSCI.2209-11.2011. [DOI] [PMC free article] [PubMed] [Google Scholar]
- Bargmann CI. Beyond the connectome: how neuromodulators shape neural circuits. Bioessays. 2012;34:458–465. doi: 10.1002/bies.201100185. [DOI] [PubMed] [Google Scholar]
- Bem T, Rinzel J. Short duty cycle destabilizes a half-center oscillator, but gap junctions can restabilize the anti-phase pattern. J Neurophysiol. 2004;91:693–703. doi: 10.1152/jn.00783.2003. [DOI] [PubMed] [Google Scholar]
- Bem T, Le Feuvre Y, Rinzel J, Meyrand P. Electrical coupling induces bistability of rhythms in networks of inhibitory spiking neurons. Eur J Neurosci. 2005;22:2661–2668. doi: 10.1111/j.1460-9568.2005.04405.x. [DOI] [PubMed] [Google Scholar]
- Bennett MV. Electrical synapses, a personal perspective (or history) Brain Res Brain Res Rev. 2000a;32:16–28. doi: 10.1016/s0165-0173(99)00065-x. [DOI] [PubMed] [Google Scholar]
- Bennett MV. Seeing is relieving: electrical synapses between visualized neurons. Nat Neurosci. 2000b;3:7–9. doi: 10.1038/71082. [DOI] [PubMed] [Google Scholar]
- Bennett MV, Zukin RS. Electrical coupling and neuronal synchronization in the Mammalian brain. Neuron. 2004;41:495–511. doi: 10.1016/s0896-6273(04)00043-1. [DOI] [PubMed] [Google Scholar]
- Berke JD. Fast oscillations in cortical-striatal networks switch frequency following rewarding events and stimulant drugs. Eur J Neurosci. 2009;30:848–859. doi: 10.1111/j.1460-9568.2009.06843.x. [DOI] [PMC free article] [PubMed] [Google Scholar]
- Briggman KL, Kristan WB. Multifunctional pattern-generating circuits. Annu Rev Neurosci. 2008;31:271–294. doi: 10.1146/annurev.neuro.31.060407.125552. [DOI] [PubMed] [Google Scholar]
- Bucher D, Taylor AL, Marder E. Central pattern generating neurons simultaneously express fast and slow rhythmic activities in the stomatogastric ganglion. J Neurophysiol. 2006;95:3617–3632. doi: 10.1152/jn.00004.2006. [DOI] [PubMed] [Google Scholar]
- Büschges A, Ludwar BCh, Bucher D, Schmidt J, DiCaprio RA. Synaptic drive contributing to rhythmic activation of motoneurons in the deafferented stick insect walking system. Eur J Neurosci. 2004;19:1856–1862. doi: 10.1111/j.1460-9568.2004.03312.x. [DOI] [PubMed] [Google Scholar]
- Clapp WC, Rubens MT, Sabharwal J, Gazzaley A. Deficit in switching between functional brain networks underlies the impact of multitasking on working memory in older adults. Proc Natl Acad Sci USA. 2011;108:7212–7217. doi: 10.1073/pnas.1015297108. [DOI] [PMC free article] [PubMed] [Google Scholar]
- Connors BW, Long MA. Electrical synapses in the mammalian brain. Annu Rev Neurosci. 2004;27:393–418. doi: 10.1146/annurev.neuro.26.041002.131128. [DOI] [PubMed] [Google Scholar]
- Connors BW, Benardo LS, Prince DA. Coupling between neurons of the developing rat neocortex. J Neurosci. 1983;3:773–782. doi: 10.1523/JNEUROSCI.03-04-00773.1983. [DOI] [PMC free article] [PubMed] [Google Scholar]
- Connors BW, Zolnik TA, Lee SC. Enhanced functions of electrical junctions. Neuron. 2010;67:354–356. doi: 10.1016/j.neuron.2010.07.024. [DOI] [PMC free article] [PubMed] [Google Scholar]
- Dickinson PS, Mecsas C, Marder E. Neuropeptide fusion of two motor-pattern generator circuits. Nature. 1990;344:155–158. doi: 10.1038/344155a0. [DOI] [PubMed] [Google Scholar]
- Diester I, Kaufman MT, Mogri M, Pashaie R, Goo W, Yizhar O, Ramakrishnan C, Deisseroth K, Shenoy KV. An optogenetic toolbox designed for primates. Nat Neurosci. 2011;14:387–397. doi: 10.1038/nn.2749. [DOI] [PMC free article] [PubMed] [Google Scholar]
- Fenno L, Yizhar O, Deisseroth K. The development and application of optogenetics. Annu Rev Neurosci. 2011;34:389–412. doi: 10.1146/annurev-neuro-061010-113817. [DOI] [PMC free article] [PubMed] [Google Scholar]
- Griffith LC. Identifying behavioral circuits in Drosophila melanogaster: moving targets in a flying insect. Curr Opin Neurobiol. 2012;22:609–614. doi: 10.1016/j.conb.2012.01.002. [DOI] [PMC free article] [PubMed] [Google Scholar]
- Grillner S. Biological pattern generation: the cellular and computational logic of networks in motion. Neuron. 2006;52:751–766. doi: 10.1016/j.neuron.2006.11.008. [DOI] [PubMed] [Google Scholar]
- Haas JS, Landisman CE. State-dependent modulation of gap junction signaling by the persistent sodium current. Front Cell Neurosci. 2011;5:31. doi: 10.3389/fncel.2011.00031. [DOI] [PMC free article] [PubMed] [Google Scholar]
- Haas JS, Landisman CE. Bursts modify electrical synaptic strength. Brain Res. 2012;1487:140–149. doi: 10.1016/j.brainres.2012.05.061. [DOI] [PMC free article] [PubMed] [Google Scholar]
- Haas JS, Zavala B, Landisman CE. Activity-dependent long-term depression of electrical synapses. Science. 2011;334:389–393. doi: 10.1126/science.1207502. [DOI] [PMC free article] [PubMed] [Google Scholar]
- Heerebout BT, Phaf RH. Good vibrations switch attention: an affective function for network oscillations in evolutionary simulations. Cogn Affect Behav Neurosci. 2010;10:217–229. doi: 10.3758/CABN.10.2.217. [DOI] [PubMed] [Google Scholar]
- Hooper SL, Moulins M. Switching of a neuron from one network to another by sensory-induced changes in membrane properties. Science. 1989;244:1587–1589. doi: 10.1126/science.2740903. [DOI] [PubMed] [Google Scholar]
- Hooper SL, Moulins M. Cellular and synaptic mechanisms responsible for a long-lasting restructuring of the lobster pyloric network. J Neurophysiol. 1990;64:1574–1589. doi: 10.1152/jn.1990.64.5.1574. [DOI] [PubMed] [Google Scholar]
- Hooper SL, Moulins M, Nonnotte L. Sensory input induces long-lasting changes in the output of the lobster pyloric network. J Neurophysiol. 1990;64:1555–1573. doi: 10.1152/jn.1990.64.5.1555. [DOI] [PubMed] [Google Scholar]
- Izhikevich EM. The Geometry of Excitability and Bursting. Cambridge, MA: MIT Press; 2007. Dynamical Systems in Neuroscience. [Google Scholar]
- Katz PS, Harris-Warrick RM. Recruitment of crab gastric mill neurons into the pyloric motor pattern by mechanosensory afferent stimulation. J Neurophysiol. 1991;65:1442–1451. doi: 10.1152/jn.1991.65.6.1442. [DOI] [PubMed] [Google Scholar]
- Kepler TB, Marder E, Abbott LF. The effect of electrical coupling on the frequency of model neuronal oscillators. Science. 1990;248:83–85. doi: 10.1126/science.2321028. [DOI] [PubMed] [Google Scholar]
- Kopell N, Ermentrout B. Chemical and electrical synapses perform complementary roles in the synchronization of interneuronal networks. Proc Natl Acad Sci USA. 2004;101:15482–15487. doi: 10.1073/pnas.0406343101. [DOI] [PMC free article] [PubMed] [Google Scholar]
- Kopell N, Abbott LF, Soto-Trevino C. On the behavior of a neural oscillator electrically coupled to a bistable element. Physica D. 1998;121:367–395. [Google Scholar]
- Lamb DG, Calabrese RL. Neural circuits controlling behavior and autonomic functions in medicinal leeches. Neural Syst Circuits. 2011;1:13. doi: 10.1186/2042-1001-1-13. [DOI] [PMC free article] [PubMed] [Google Scholar]
- Lamb DG, Calabrese RL. Small is beautiful: models of small neuronal networks. Curr Opin Neurobiol. 2012;22:670–675. doi: 10.1016/j.conb.2012.01.010. [DOI] [PMC free article] [PubMed] [Google Scholar]
- Landisman CE, Connors BW. Long-term modulation of electrical synapses in the mammalian thalamus. Science. 2005;310:1809–1813. doi: 10.1126/science.1114655. [DOI] [PubMed] [Google Scholar]
- Macosko EZ, Pokala N, Feinberg EH, Chalasani SH, Butcher RA, Clardy J, Bargmann CI. A hub-and-spoke circuit drives pheromone attraction and social behaviour in C. elegans. Nature. 2009;458:1171–1175. doi: 10.1038/nature07886. [DOI] [PMC free article] [PubMed] [Google Scholar]
- Manor Y, Rinzel J, Segev I, Yarom Y. Low-amplitude oscillations in the inferior olive: a model based on electrical coupling of neurons with heterogeneous channel densities. J Neurophysiol. 1997;77:2736–2752. doi: 10.1152/jn.1997.77.5.2736. [DOI] [PubMed] [Google Scholar]
- Marder E. Roles for electrical coupling in neural circuits as revealed by selective neuronal deletions. J Exp Biol. 1984;112:147–167. doi: 10.1242/jeb.112.1.147. [DOI] [PubMed] [Google Scholar]
- Marder E. Electrical synapses: beyond speed and synchrony to computation. Curr Biol. 1998;8:R795–R797. doi: 10.1016/s0960-9822(07)00502-7. [DOI] [PubMed] [Google Scholar]
- Marder E. Variability, compensation, and modulation in neurons and circuits. Proc Natl Acad Sci USA. 2011;108(Suppl 3 ):15542–15548. doi: 10.1073/pnas.1010674108. [DOI] [PMC free article] [PubMed] [Google Scholar]
- Marder E, Bucher D. Central pattern generators and the control of rhythmic movements. Curr Biol. 2001;11:R986–R996. doi: 10.1016/s0960-9822(01)00581-4. [DOI] [PubMed] [Google Scholar]
- Marder E, Bucher D. Understanding circuit dynamics using the stomatogastric nervous system of lobsters and crabs. Annu Rev Physiol. 2007;69:291–316. doi: 10.1146/annurev.physiol.69.031905.161516. [DOI] [PubMed] [Google Scholar]
- Marder E, Calabrese RL. Principles of rhythmic motor pattern generation. Physiol Rev. 1996;76:687–717. doi: 10.1152/physrev.1996.76.3.687. [DOI] [PubMed] [Google Scholar]
- Mayeri E. Functional organization of the cardiac ganglion of the lobster, Homarus americanus. J Gen Physiol. 1973;62:448–472. doi: 10.1085/jgp.62.4.448. [DOI] [PMC free article] [PubMed] [Google Scholar]
- Meyrand P, Simmers J, Moulins M. Construction of a pattern-generating circuit with neurons of different networks. Nature. 1991;351:60–63. doi: 10.1038/351060a0. [DOI] [PubMed] [Google Scholar]
- Meyrand P, Simmers J, Moulins M. Dynamic construction of a neural network from multiple pattern generators in the lobster stomatogastric nervous system. J Neurosci. 1994;14:630–644. doi: 10.1523/JNEUROSCI.14-02-00630.1994. [DOI] [PMC free article] [PubMed] [Google Scholar]
- Miller JP, Selverston A. Rapid killing of single neurons by irradiation of intracellularly injected dye. Science. 1979;206:702–704. doi: 10.1126/science.386514. [DOI] [PubMed] [Google Scholar]
- Miller JP, Selverston AI. Mechanisms underlying pattern generation in lobster stomatogastric ganglion as determined by selective inactivation of identified neurons. II Oscillatory properties of pyloric neurons. J Neurophysiol. 1982a;48:1378–1391. doi: 10.1152/jn.1982.48.6.1378. [DOI] [PubMed] [Google Scholar]
- Miller JP, Selverston AI. Mechanisms underlying pattern generation in lobster stomatogastric ganglion as determined by selective inactivation of identified neurons. IV Network properties of pyloric system. J Neurophysiol. 1982b;48:1416–1432. doi: 10.1152/jn.1982.48.6.1416. [DOI] [PubMed] [Google Scholar]
- Morris C, Lecar H. Voltage oscillations in the barnacle giant muscle fiber. Biophys J. 1981;35:193–213. doi: 10.1016/S0006-3495(81)84782-0. [DOI] [PMC free article] [PubMed] [Google Scholar]
- Mulloney B. During fictive locomotion, graded synaptic currents drive bursts of impulses in swimmeret motor neurons. J Neurosci. 2003;23:5953–5962. doi: 10.1523/JNEUROSCI.23-13-05953.2003. [DOI] [PMC free article] [PubMed] [Google Scholar]
- Mulloney B, Perkel DH, Budelli RW. Motor-pattern production: interaction of chemical and electrical synapses. Brain Res. 1981;229:25–33. doi: 10.1016/0006-8993(81)90742-3. [DOI] [PubMed] [Google Scholar]
- Pearson KG, Reye DN, Parsons DW, Bicker G. Flight-initiating interneurons in the locust. J Neurophysiol. 1985;53:910–925. doi: 10.1152/jn.1985.53.4.910. [DOI] [PubMed] [Google Scholar]
- Pereda AE, Curti S, Hoge G, Cachope R, Flores CE, Rash JE. Gap junction-mediated electrical transmission: regulatory mechanisms and plasticity. Biochim Biophys Acta. 2013;1828:134–146. doi: 10.1016/j.bbamem.2012.05.026. [DOI] [PMC free article] [PubMed] [Google Scholar]
- Prinz AA, Bucher D, Marder E. Similar network activity from disparate circuit parameters. Nat Neurosci. 2004;7:1345–1352. doi: 10.1038/nn1352. [DOI] [PubMed] [Google Scholar]
- Pulver SR, Pashkovski SL, Hornstein NJ, Garrity PA, Griffith LC. Temporal dynamics of neuronal activation by Channelrhodopsin-2 and TRPA1 determine behavioral output in Drosophila larvae. J Neurophysiol. 2009;101:3075–3088. doi: 10.1152/jn.00071.2009. [DOI] [PMC free article] [PubMed] [Google Scholar]
- Ramirez JM, Tryba AK, Peña F. Pacemaker neurons and neuronal networks: an integrative view. Curr Opin Neurobiol. 2004;14:665–674. doi: 10.1016/j.conb.2004.10.011. [DOI] [PubMed] [Google Scholar]
- Roopun AK, Kramer MA, Carracedo LM, Kaiser M, Davies CH, Traub RD, Kopell NJ, Whittington MA. Temporal interactions between cortical rhythms. Front Neurosci. 2008;2:145–154. doi: 10.3389/neuro.01.034.2008. [DOI] [PMC free article] [PubMed] [Google Scholar]
- Russell DF. Pattern and reset analysis of the gastric mill rhythm in a spiny lobster, Panulirus interruptus. J Exp Biol. 1985;114:71–98. doi: 10.1242/jeb.114.1.71. [DOI] [PubMed] [Google Scholar]
- Selverston AI. Invertebrate central pattern generator circuits. Philos Trans R Soc Lond B Biol Sci. 2010;365:2329–2345. doi: 10.1098/rstb.2009.0270. [DOI] [PMC free article] [PubMed] [Google Scholar]
- Sherman A, Rinzel J. Rhythmogenic effects of weak electrotonic coupling in neuronal models. Proc Natl Acad Sci USA. 1992;89:2471–2474. doi: 10.1073/pnas.89.6.2471. [DOI] [PMC free article] [PubMed] [Google Scholar]
- Skinner FK, Turrigiano GG, Marder E. Frequency and burst duration in oscillating neurons and two-cell networks. Biol Cybern. 1993;69:375–383. [PubMed] [Google Scholar]
- Soto-Treviño C, Rabbah P, Marder E, Nadim F. Computational model of electrically coupled, intrinsically distinct pacemaker neurons. J Neurophysiol. 2005;94:590–604. doi: 10.1152/jn.00013.2005. [DOI] [PMC free article] [PubMed] [Google Scholar]
- Tang LS, Taylor AL, Rinberg A, Marder E. Robustness of a rhythmic circuit to short- and long-term temperature changes. J Neurosci. 2012;32:10075–10085. doi: 10.1523/JNEUROSCI.1443-12.2012. [DOI] [PMC free article] [PubMed] [Google Scholar]
- Traub RD. Model of synchronized population bursts in electrically coupled interneurons containing active dendritic conductances. J Comput Neurosci. 1995;2:283–289. doi: 10.1007/BF00961440. [DOI] [PubMed] [Google Scholar]
- Traub RD, Whittington MA, Stanford IM, Jefferys JG. A mechanism for generation of long-range synchronous fast oscillations in the cortex. Nature. 1996;383:621–624. doi: 10.1038/383621a0. [DOI] [PubMed] [Google Scholar]
- Traub RD, Cunningham MO, Whittington MA. Chemical synaptic and gap junctional interactions between principal neurons: partners in epileptogenesis. Neural Netw. 2011;24:515–525. doi: 10.1016/j.neunet.2010.11.007. [DOI] [PMC free article] [PubMed] [Google Scholar]
- Turrigiano G, LeMasson G, Marder E. Selective regulation of current densities underlies spontaneous changes in the activity of cultured neurons. J Neurosci. 1995;15:3640–3652. doi: 10.1523/JNEUROSCI.15-05-03640.1995. [DOI] [PMC free article] [PubMed] [Google Scholar]
- Vervaeke K, Lorincz A, Gleeson P, Farinella M, Nusser Z, Silver RA. Rapid desynchronization of an electrically coupled interneuron network with sparse excitatory synaptic input. Neuron. 2010;67:435–451. doi: 10.1016/j.neuron.2010.06.028. [DOI] [PMC free article] [PubMed] [Google Scholar]
- Wang XJ. Fast burst firing and short-term synaptic plasticity: a model of neocortical chattering neurons. Neuroscience. 1999;89:347–362. doi: 10.1016/s0306-4522(98)00315-7. [DOI] [PubMed] [Google Scholar]
- Wang XJ. Neurophysiological and computational principles of cortical rhythms in cognition. Physiol Rev. 2010;90:1195–1268. doi: 10.1152/physrev.00035.2008. [DOI] [PMC free article] [PubMed] [Google Scholar]
- Weimann JM, Marder E. Switching neurons are integral members of multiple oscillatory networks. Curr Biol. 1994;4:896–902. doi: 10.1016/s0960-9822(00)00199-8. [DOI] [PubMed] [Google Scholar]
- Weimann JM, Meyrand P, Marder E. Neurons that form multiple pattern generators: identification and multiple activity patterns of gastric/pyloric neurons in the crab stomatogastric system. J Neurophysiol. 1991;65:111–122. doi: 10.1152/jn.1991.65.1.111. [DOI] [PubMed] [Google Scholar]
- Yizhar O, Fenno LE, Davidson TJ, Mogri M, Deisseroth K. Optogenetics in neural systems. Neuron. 2011;71:9–34. doi: 10.1016/j.neuron.2011.06.004. [DOI] [PubMed] [Google Scholar]
- Zhang F, Gradinaru V, Adamantidis AR, Durand R, Airan RD, de Lecea L, Deisseroth K. Optogenetic interrogation of neural circuits: technology for probing mammalian brain structures. Nat Protoc. 2010;5:439–456. doi: 10.1038/nprot.2009.226. [DOI] [PMC free article] [PubMed] [Google Scholar]