

Abstract
Three-dimensional structures of RNA-protein complexes are crucial for understanding their diverse functions. However, the number of the RNA-protein complex structures solved by experiments is still limited at present. To solve this problem, some computational protocols have been proposed to predict three-dimensional RNA-protein complex structures. But the prediction accuracies of these protocols are lower. The reason may be that these protocols don't fully incorporate the features of RNA-protein interfaces. Here we propose a novel computational protocol for three-dimensional RNA-protein complex structure prediction, 3dRPC, which applies new schemes to the discreteness of molecule and charge in docking algorithm and the construction of the reference state in scoring function in order to take account of the features of RNA-protein interfaces. This protocol achieves a high accuracy comparable to the well-developed algorithms for three-dimensional structure prediction of protein-protein complexes when tested on a RNA-protein docking benchmark.
The recent discovery of various noncoding RNAs requires an understanding of their biological functions by exploring their three-dimensional (3D) monomer and complex structures1,2. Since the numbers of the solved 3D monomers and complex structures of noncoding RNAs are quite limited at present, many computational prediction methods have been proposed3,4. For 3D structures of RNA-protein complexes, the accuracies of the existing prediction methods5,6 are much lower compared with the well-developed ones for protein-protein complex structure prediction7,8,9,10,11,12. One of the main reasons is that these methods have been developed based on those for protein-protein complexes and have not fully incorporated specific features of RNA-protein interfaces, e.g., they have directly used the docking procedures for protein-protein complexes.
The features of RNA-protein interfaces are significantly different from those of protein-protein interfaces in several aspects:
The atom packing of RNA-protein interfaces is looser than that of protein-protein interfaces. Fig. 1a shows that RNA-binding proteins and protein-binding proteins have similar accessible surface areas (ASA) if they have similar number of atoms. However, protein-binding proteins have larger buried surface areas (BSA) than RNA-binding proteins on average when they have similar number of interface atoms (Fig. 1b). Other studies have also indicated that RNA-protein interfaces have poorer atom packing than protein-protein interfaces by using different measures, like gap volume index1,13 and buried fraction and packing index14.
Positively charged amino acids prefer to appear at RNA-protein interfaces15, on which the electrostatic interactions are usually much stronger than that on protein-protein interfaces, due to the large negative charges of the phosphate groups in RNA backbones at physiological pH. The residue preferences at RNA-protein interface have been analyzed in several papers1,2,14,15,16,17,18,19. These studies have shown that the most preferred residues at the interface are the positively charged residues arginine (R) and lysine (K) and the least residues are the negatively charged residues aspartic acid (D) and glutamic acid (E).
Stacking interactions of the bases of nucleotides with aromatic rings of charged amino acids occur at RNA-protein interfaces. It has been shown that the three residues H, Y and W can participate in π-π stacking interactions with the bases of nucleotides through their aromatic rings at RNA-protein interfaces20.
The secondary structure states of amino acid residues and nucleotides are important in RNA-protein interactions21,22,5. For examples, Iwakiri et al.21 found that the dented protein surfaces prefer unpaired bases to paired ones at protein-RNA interfaces.
Figure 1. Differences between RNA-protein interface and protein-protein interface.

(a) Accessible surface area (ASA) versus number of atoms; (b) Buried surface area (BSA) versus number of interface atoms. The statistical data come from 118 RNA-binding proteins from our training set and 124 protein-binding proteins from benchmark 3.0.
These features of RNA-protein interfaces are indispensable to accurate prediction of 3D RNA-protein complex structures.
Computational prediction of complex structures can be divided into two steps: the first step is decoy (or candidate) generation using docking procedures and the second is decoy evaluation using scoring functions. So far, some scoring functions for 3D structure predictions of RNA-protein complexes have been proposed but the docking procedures are borrowed directly from those for protein-protein complexes. Besides, these scoring functions have not fully incorporated the features of RNA-protein interfaces. For examples, Tuszynska et al.6 have proposed a knowledge-based potential DARS-RNP by considering only distance- and angle-dependence between amino acid residues and nucleotides but without secondary structure information of RNA. Li et al.5 have proposed a propensity-based statistical potential by considering secondary structure states of amino acid residues and nucleotides explicitly but using a contact potential instead of more accurate distance- and angle-dependent one. Furthermore, both of them generate the decoys by using the docking procedures (GRAMM8 or FTDock9) developed previously for protein-protein complexes.
In this paper we present a novel protocol for predicting 3D RNA-protein complex structures, named as 3dRPC, which includes a docking procedure--RPDOCK, and a scoring function--DECK-RP. RPDOCK is specific to RNA-protein complexes and it uses new schemes for discretizing molecules and charges in order to take into account geometric and electrostatic complementarities of RNA-protein interfaces as well as stacking interactions of the bases of nucleotides with the aromatic rings of charged amino acids; DECK-RP is a novel distance- and environment-dependent, coarse-grained and knowledge-based potential for RNA-protein complexes that uses an improved reference state to incorporate propensities, secondary structure states and interface preferences of amino-acid residues and nucleotides. The success rate of 3dRPC is comparable to those of the best algorithms for protein-protein complex structure prediction10,12 when tested on a RNA-protein docking benchmark.
Results
RPDOCK
RPDOCK is a novel docking procedure specific to RNA-protein complexes. In previous studies, Li et al.5 and Perez-Cano et al.15 used FTDock and Tuszynska et al.6 applied GRAMM to generate decoys of protein-RNA complexes. These docking procedures were originally designed for protein-protein complexes and are not suitable for RNA-protein complexes for the reasons mentioned above. RPDOCK incorporates the features specific to RNA-protein interfaces (including looser atom packing at interface, preference of positively charged amino acid residues at RNA-protein interfaces and stacking interactions between the bases of nucleotides and aromatic rings of charged amino acids). We have benchmarked the performance of RPDOCK, GRAMM and FTDock on two unbound testing sets: one was provided by Perez-Cano et al.23 (Testing Set I, Supplementary Table S1) and the other by Huang and Zou24 (Testing Set II, Supplementary Table S2). For FTDock, docking is performed with default parameters, 1Å grid step and electrostatics. The angle interval of rotation searching is 12 degrees and top 3 poses are kept per rotation. Since original FTDock procedure does not include atomic charges for RNA, we assign the partial atomic charges from AMBER ff03 force field25 to the corresponding atoms of nucleotides. For GRAMM, the value of grid step is set to be the minimal value allowed by the program, repulsion parameter to 15 and angle interval to 10 degrees. Protein chains are regarded as receptors and RNA chains as ligands for all these methods.
The performances of RPDOCK, GRAMM and FTDock over the two testing sets are shown in Fig. 2a and 2b. Clearly RPDOCK has much higher (about 20%) success rate than the other two docking procedures on both testing sets, where the success rate refers to the percentage of complexes in testing set with successful predictions of at least one near-native structure by a given prediction number. For examples, at prediction number NP = 100, the success rates of FTDock, GRAMM and RPDOCK are 19.7%, 30.3% and 50% on Testing Set I (Fig. 2a) and are 25%, 36% and 56% on Testing Set II (Fig. 2b), respectively. A good docking procedure can produce more near-native structures for a given prediction number, which is usually taken as 1000 or less. The benchmarking results indicate that RPDOCK can produce at least one near-native structure for 10%–20% more complexes than GRAMM. Besides, the hit counts of RPDOCK and GRAMM are similar, and are much higher than FTDock for all prediction numbers (Fig. 3a and 3b).
Figure 2. Success rate comparisons over Testing Set I (a, c, e) and Testing Set II (b, d, f).

(a) and (b) are docking success rates of FTDock, GRAMM and RPDOCK. (c) and (d) are scoring success rates over RPDOCK decoys. Li, DARS-RNP and DECK-RP are compared. For each case, top 1000 structures are generated by RPDOCK and are evaluated by corresponding scoring functions. The ranking result directly by RPDOCK is also shown as a reference. (e) and (f) are protocol success rates of FTDock&Li, GRAMM&DARS-RNP and RPDOCK&DECK_RP. For each case, top 1000 structures are generated by the corresponding docking procedures and are evaluated by the scoring functions.
Figure 3. Hit count comparisons over Testing Set I (a, c, e) and Testing Set II (b, d, f).

(a) and (b) are docking hit counts of FTDock, GRAMM and RPDOCK. (c) and (d) are scoring hit counts over RPDOCK decoys. Li, DARS-RNP and DECK-RP are compared. For each case, top 1000 structures are generated by RPDOCK and are evaluated by corresponding scoring functions. Ranking result by RPDOCK is also shown as a reference. (e) and (f) are protocol hit counts of FTDock & Li, GRAMM & DARS-RNP and RPDOCK & DECK_RP. For each case, top 1000 structures are generated by the corresponding docking procedures and are evaluated by the scoring functions.
DECK-RP
As the docking procedure above generates a large number of decoys as the candidates of 3D RNA-protein complex structures, it requires an effective scoring function to evaluate these candidates and pick out the correct one. Based on our previous work on protein-protein scoring function DECK (Distance- and Environment-dependent, Coarse-grained and Knowledge-based)26, we have developed a DECK potential for RNA-protein complexes, named as DECK-RP, which has combined the advantages of the best two existing potentials, Li's potential5 and DARS-RNP6 (see the section Methods for the details).
In order to evaluate the performance of DECK-RP, we compare it with Li's potential and DARS-RNP on RPDOCK decoys. The decoys are generated as follows: we generate top 1000 decoys for each case in the testing set by RPDOCK and the cases with at least one near-native pose are retained for further scoring evaluation. The evaluation results on the two testing sets are shown in Fig. 2c and 2d. For Testing Set I (Fig. 2c), the success rates at Np = 1, 10 and 100 are about 23%, 48% and 75% for DECK-RP, 14%, 36% and 82% for DARS-RNP, and 16%, 30% and 61% for Li's potential, respectively. DECK-RP is about 10% better at lower prediction number (Np < 30) and DARS-RNP outstands at larger prediction number (Np > 30). On Testing Set II (Fig. 2d), the success rates at Np = 1, 10 and 100 are 32%, 52% and 86% for DECK-RP, 38%, 56% and 76% for DARS-RNP, and 10%, 32% and 60% for Li's potential, respectively. In this case DARS-RNP is slightly better when Np < 10 but DECK-RP excels when Np > 10. It is clear that the success rates of DECK-RP and DARS-RNP are higher than that of Li's potential for almost all prediction numbers. On average, DECK-RP can achieve higher prediction accuracy, especially in small prediction numbers, which is the aim of an effective scoring function and the expectation of practical applications. In addition, on both testing sets the hit counts of the DARS-RNP and DECK-RP are similar while those of Li's potential are lower (Fig. 3c and 3d).
The protocol 3dRPC: RPDOCK&DECK-RP
In the above we have tested and compared the performances of the three docking procedures (FTDock, GRAMM, RPDOCK) and three scoring functions (DARS-RNP, Li potential, DECK-RP) separately. In the following we investigate the combined behaviors of docking procedures and scoring functions. Originally, Li et al.5 used their potential to discriminate FTDock decoys while Tuszynska et al.6 applied their DARS-RNP potential to evaluate GRAMM decoys. Therefore, we compare our docking protocol, RPDOCK&DECK-RP, with the protocols FTDock&Li and GRAMM&DARS-RNP on the two unbound testing sets. For all three protocols, top 1000 poses are generated by their docking methods and then evaluated by their scoring functions. For Testing Set I (Fig. 2e), RPDOCK&DECK-RP has successfully predicted 15%, 30% and 50% of the cases within top 1, 10 and 100 predictions, FTDock&Li 5%,17%and 32%, and GRAMM&DARS-RNP 14%, 21% and 42%, respectively. For Testing Set II (Fig. 2f), RPDOCK&DECK-RP has successfully predicted 22%, 36% and 60% of the cases within top 1, 10 and 100 predictions, FTDock&Li 4%, 11% and 26%, and GRAMM&DARS-RNP 21%, 26% and 36%, respectively. These results indicate that the success rate of RPDOCK&DECK-RP is significantly higher than those of the other two protocols and is already comparable to those of the best protocols for protein-protein complex structure prediction10,12, e.g., the success rate of ZDOCK is about 20% for top 10 predictions and that of 3dRPC is more than 30%12 (see Fig. 2 in ref. 12). Fig. 4 shows two (one easy and one medium) cases in Testing Set II predicted successfully by our protocol. Besides, the hit counts of RPDOCK&DECK-RP and GRAMM&DARS-RNP are similar, and are much higher than FTDock&Li for all prediction numbers (Fig. 3e and 3f). Further improvement of the proposed 3dRPC is also needed as the hard cases in Testing Set II is yet to be predicted (Supplementary Table S3) because of the large conformational changes in bound and unbound states.
Figure 4. Two (one easy and one medium) cases in Testing Set II successfully predicted by our protocol (RPDOCK & DECKRP).

The dark color represents native structures and the light color represents predicted ones. Proteins of predicted structures are superimposed onto native structures. (a) Complex of tRNA delta(2)-isopentenylpyrophosphate transferase (PDB code 2ZM5, easy case). Our protocol predicted the first near-native structure (RMSD = 8.2Å) at NP = 1. (b) Complex of L-seryl-tRNA(Sec) kinase and selenocysteine tRNA (3ADD, medium case). Our protocol predicted the first near-native structure (RMSD = 6.8 Å) at NP = 3.
Discussion
The results above indicate that the specific features of RNA-protein interface are very important in accurate prediction of 3D RNA-protein complex structures. In RPDOCK, we have considered the fact that the atom packing of RNA-protein interface is looser than that of protein-protein interface. For example, FTDock for protein-protein docking uses a FFT-based geometric docking algorithm that is the basis of all popular FFT-based docking methods7 and, among the default FTDock parameters, surface thickness is set as 1.5 Å and the value of surface grid point as 1. The parameter “surface thickness” accounts for the degree of penetration and the “value of surface grid point” for the degree of clash. RPDOCK also uses the FFT-based geometric docking algorithm but, in order to characterize looser packing of the RNA-protein interfaces, surface thickness is set as 1.3 Å and the value of surface grid point as 3, respectively,according to the test on the bound training set. Fig. S1 shows the comparison of the fractions of the fully buried atoms in the interface atoms for the top-one complex structures predicted by FTDock and RPDOCK with those for the measured ones in the bound training set. It indicates that the packing of the complex structures predicted by FTDock is denser than that of the measured ones while that by RPDOCK is looser. In other words, the packing of the complex structures predicted by RPDOCK is indeed looser than that by FTDock.
Our statistical potential for RNA-protein complexes, DECK-RP, uses a novel reference state, which includes a decoy-based component and a mol-fraction corrected component. The decoy-based component takes account of all decoys in the training set as the reference state as usually while its novel point is integrating the advantages of the best two existing potentials (Li's potential5 and DARS-RNP6), i.e., classifying amino acids and nucleotides into different types according to their propensities and secondary structure states, The mol-fraction corrected component takes account of the interface concentration or preferences of amino-acid residues and nucleotides, which has not been considered by existing potentials. The benchmark shows that DECK-RP indeed has higher prediction accuracy than existing potentials on average, especially in small prediction numbers (Fig. 2c and Fig. 2d).
In summary, 3dRPC—the proposed protocol for the prediction of 3D structure of RNA-protein complexes incorporated unique features of RNA-protein interfaces and achieved an accuracy significantly higher than the existing protocols. The ideas of our methods may be extended to the prediction of 3D DNA-protein complex structures.
Methods
RPDOCK
RPDOCK includes both geometric complementarity (GC) and electrostatics (ELEC):
where SRPDOCKis the score of RPDOCK, SGC and SELEC are the scores of geometric and electrostatic complementarities, respectively. The weighted factor ω is set to 1000, which is to make the two scores contribute equally since the order of magnitude of SGC is about 102 and SELEC 10−1.
We apply the procedures proposed by Gabb et al.9 to calculate SGC and SELEC but with a new scheme for discretizing molecules and charges in order to take into account of the specific features of RNA-protein interfaces. In detail, SGCis calculated as9
where  and
and  are the values of each grid node assigned when the receptor and ligand molecules are discretized into three-dimensional (3D) grids with a size of
  and they are set as follows:
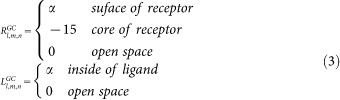 |
Any grid node located within 1.8Å of a heavy atom is considered to be inside of the molecule9. In order to discriminate grid nodes at the surface of receptor from those at the core, a 1.3Å surface layer is used. Furthermore, in order to consider stacking interactions between aromatic residues and bases, we assign different values to α in eq.(3) according to:
The electrostatic score is calculated as the electrostatic interactions between receptor and ligand:
 |
where  is the electrostatic potential on grid node exerted by all charges on receptor and ql,m,n is the charge on ligand. Similar to Gabb et al.9,
  is calculated by Coulombic model with distance-dependent dielectric:
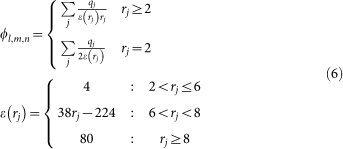 |
where qj is the charge on atom j and rj is the distance between grid node and atom j. Different from Gabb et al.9, the charge of each atom on ligand is discretized on eight nearest grid nodes by:
where qj is the charge of atom j, dx, dy, dzare the distance between atom j and grid node along each dimension, respectively, and g is the grid length. Furthermore, the charges used in this study are partial atomic charges extracted from AMBER ff03 force field25.
In our sampling procedure, the receptor is fixed on the origin and the ligand is rotated by 12 degree after a translational scan. Non-redundant rotation angles are considered. For each rotation, we keep top 3 poses according to the RPDOCK score SRPDOCK. In order to accelerate the calculation of SGCand SELEC, Fast Fourier Transform (FFT) is used7.
Scoring function
Based on our previous work on protein-protein docking scoring function DECK (Distance- and Environment-dependent, Coarse-grained and Knowledge-based)26, we have developed a DECK potential for RNA-protein complexes, DECK-RP. The key part of DECK-RP is a novel reference state, which includes a decoy-based component and a mol-fraction corrected component. The decoy-based component takes account of all decoys in the training set as the reference state as usually and the types of amino acids and nucleotides according to their propensities and secondary structure states. The mol-fraction corrected component takes the interface concentration or preferences of amino-acid residues and nucleotides into consideration. The 20 kinds of amino acids are clustered into 7 types based on the dipoles and volumes of the side chains27 (Supplementary Table S5) and their secondary structure states are categorized into 3 types based on the their propensity at interface5. The secondary structure state of an amino acid is calculated by DSSP28. The 3 types are denoted as X (with DSSP notations “I”, “G” and “S”), Y (“E”, “B”, “T” and “ ”), Z (“H”). For nucleotides, four types of nucleotides and two types of secondary structure states (paired and unpaired (including non-Crick-Watson pairs)) are considered5. The secondary structure state of a nucleotide is calculated by X3DNA29. Therefore, the total number of amino acid-nucleotide pair is 168 (7 types of amino acids in three secondary structure states and 4 types of nucleotides in two secondary structure states). Furthermore, amino acids and nucleotides are represented by coarse-grained models: amino acid is represented as one pseudo-atom located at the centroid of the side chain and nucleotide at the centroid of the base.
Based on the definitions above, the energy e(i, j, r) of an amino acid-nucleotide pair (i, j) at a distance r is estimated as:
where Pobs(i, j, r) and Pexp(i, j, r) are observed and expected probabilities of amino acid-nucleotide pair (i, j) at a distance r, respectively; R is the Boltzmann factor, T is temperature and RT is set to 1.The interaction distance r is divided into 20 bins with a bin-size of 1Å.
The observed probability of amino acid-nucleotide pair (i,j) at a distance r is calculated as:
where Nm(i,j,r) is the number of amino acid-nucleotide pair (i,j) at a distance r in near-native structures of the training set.
The expected (or reference-state) probability of amino acid-nucleotide pair (i,j) at a distance r is calculated as:
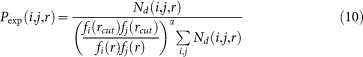 |
where Nd(i,j,r) is the number of amino acid-nucleotide pair (i,j) at a distance r in all decoys, fi/j(r) is the mol-fraction of amino acid type i or nucleotide type j and calculated as:
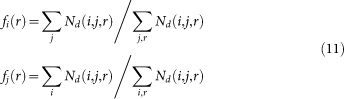 |
The cutoff rcut is set to 15Å, α is a parameter to be optimized, which is done on our training set as follows: Assuming that at distance r > rcut, the interaction between amino acid-nucleotide pair (i,j) approaches to zero, we construct the objective function f(α) as:
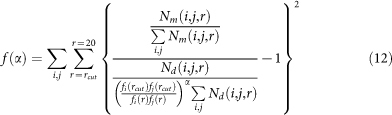 |
For a given rcut, we can find α to minimize f(α). For rcut = 15Å, we get α = −0.4 after optimization.
Datasets
Three datasets are used in this work. One is a bound training set, which is used to optimize docking parameters and generate scoring function. The other two are unbound testing set, which is used to test our method. The bound training set is built by us from all the RNA-protein complex structures in PDB database30. When we derive the training set, redundancy between the testing set and training set has been considered. First, we extract all protein-RNA complexes that meet the following criterions: not from ribosome, resolution better than 3 Å or NMR structures, protein chain size larger than 50 amino acids and RNA chain size larger than 6 nt. Then, we remove the cases that share sequence identity of 30% or higher with those from Testing Set I. Finally, we cluster the cases by sequence identity to get the non-redundant training set. Two complexes with protein sequence identity larger than 70% are grouped into the same cluster. Our training set is composed of 118 bound protein-RNA complexes (Supplementary Table S4). One of the testing sets (Testing Set I) is taken from the protein-RNA docking benchmark II developed by Perez-Cano et al.23 (except homology modeling cases and five cases with biological assembly). It is composed of 66 X-ray or NMR experimental structures, including five unbound-unbound cases, four unbound-pseudo-unbound cases and 57 unbound-bound cases (Supplementary Table S1). The other testing set (Testing Set II) is a non-redundant dataset for benchmarking protein-RNA computational docking published by Huang and Zou recently24 (Supplementary Table S2). The redundancy is removed by 30% sequence identity and the unbound structures are obtained by using BLAST, with a criterion of sequence identity large than 90% and sequence alignment coverage large than 90%. The case with at least one unbound structure is retained. The final dataset consists of 72 protein-RNA complexes, including 52 unbound-unbound cases and 20 unbound-bound cases. Furthermore, according to the conformational change between bound and unbound structures, the dataset is classified into three categories: 49 easy, 16 medium and 7 difficult.
Performance evaluation
The performance of different methods is evaluated by success rate and hit count, which are used commonly in protein-protein docking. Given the number of predictions NP, success rate is the percentage of complexes in the benchmark, for which at least one hit can be found within NP. Hit count is the average number of hits per complex within NP. And the hit is defined as near-native prediction with RMSD (Root Mean Square Deviation) of RNA below 10 Å after superposition of the proteins. The superposition involves the Cα atoms of proteins and the RMSD calculation accounts the backbone atoms of RNA except the phosphate group.
BSA and interface atoms
We have calculated the relations between buried surface area (BSA) and number of interface atoms for 118 RNA-binding proteins in our training set. For comparison, the same has also been done for 124 protein-binding proteins from benchmark 3.031. Buried surface area (BSA) is defined as the difference between the accessible surface area (ASA) in apo structure and in complex structure. In our calculation, we take the bound structure (without binding partner) as apo structure. The accessible surface area (ASA) is calculated using NACCESS. An atom with BSA > 0 (and ASA in apo structure being not equal to 0) is considered as an interface atom. And an interface atom is defined as a buried interface atom if ASA of the atom in complex structure is equal to 0.
Software availability
The programs of the protocol 3dRPC can be downloaded from our web site http://biophy.hust.edu.cn/download.html.
Author Contributions
Y.X. and S.L. designed the project. Y.X., S.L. and Y.H. wrote the main manuscript text. Y.H. did most computation and data analysis and prepared all figures. D.G. and L.L. did part of computation and data analysis.
Supplementary Material
Supplementary Materials
Acknowledgments
This work is supported by the National High Technology Research and Development Program of China [2012AA020402], the NSFC under Grant No. 31100522 and 11174093 and Specialized Research Fund for the Doctoral Program of Higher Education [20110142120038].
References
- Jones S., Daley D. T., Luscombe N. M., Berman H. M. & Thornton J. M. Protein-RNA interactions: a structural analysis. Nucleic Acids Res 29, 943–54 (2001). [DOI] [PMC free article] [PubMed] [Google Scholar]
- Ellis J. J., Broom M. & Jones S. Protein-RNA interactions: structural analysis and functional classes. Proteins 66, 903–11 (2007). [DOI] [PubMed] [Google Scholar]
- Chen Y., Kortemme T., Robertson T., Baker D. & Varani G. A new hydrogen-bonding potential for the design of protein-RNA interactions predicts specific contacts and discriminates decoys. Nucleic Acids Res 32, 5147–62 (2004). [DOI] [PMC free article] [PubMed] [Google Scholar]
- Zhao Y. et al. Automated and fast building of three-dimensional RNA structures. Sci Rep 2, 734 (2012). [DOI] [PMC free article] [PubMed] [Google Scholar]
- Li C. H., Cao L. B., Su J. G., Yang Y. X. & Wang C. X. A new residue-nucleotide propensity potential with structural information considered for discriminating protein-RNA docking decoys. Proteins 80, 14–24 (2012). [DOI] [PubMed] [Google Scholar]
- Tuszynska I. & Bujnicki J. M. DARS-RNP and QUASI-RNP: New statistical potentials for protein-RNA docking. BMC Bioinformatics 12, 348 (2011). [DOI] [PMC free article] [PubMed] [Google Scholar]
- Katchalski-Katzir E. et al. Molecular surface recognition: determination of geometric fit between proteins and their ligands by correlation techniques. Proc Natl Acad Sci U S A 89, 2195–9 (1992). [DOI] [PMC free article] [PubMed] [Google Scholar]
- Vakser I. A. & Aflalo C. Hydrophobic docking: a proposed enhancement to molecular recognition techniques. Proteins 20, 320–9 (1994). [DOI] [PubMed] [Google Scholar]
- Gabb H. A., Jackson R. M. & Sternberg M. J. Modelling protein docking using shape complementarity, electrostatics and biochemical information. J Mol Biol 272, 106–20 (1997). [DOI] [PubMed] [Google Scholar]
- Chen R. & Weng Z. Docking unbound proteins using shape complementarity, desolvation, and electrostatics. Proteins 47, 281–94 (2002). [DOI] [PubMed] [Google Scholar]
- Dominguez C., Boelens R. & Bonvin A. M. HADDOCK: a protein-protein docking approach based on biochemical or biophysical information. J Am Chem Soc 125, 1731–7 (2003). [DOI] [PubMed] [Google Scholar]
- Li L., Guo D., Huang Y., Liu S. & Xiao Y. ASPDock: protein-protein docking algorithm using atomic solvation parameters model. BMC Bioinformatics 12, 36 (2011). [DOI] [PMC free article] [PubMed] [Google Scholar]
- Jones S., van Heyningen P., Berman H. M. & Thornton J. M. Protein-DNA interactions: A structural analysis. J Mol Biol 287, 877–96 (1999). [DOI] [PubMed] [Google Scholar]
- Bahadur R. P., Zacharias M. & Janin J. Dissecting protein-RNA recognition sites. Nucleic Acids Res 36, 2705–16 (2008). [DOI] [PMC free article] [PubMed] [Google Scholar]
- Perez-Cano L., Solernou A., Pons C. & Fernandez-Recio J. Structural prediction of protein-RNA interaction by computational docking with propensity-based statistical potentials. Pac Symp Biocomput, 293–301 (2010). [DOI] [PubMed] [Google Scholar]
- Terribilini M. et al. Prediction of RNA binding sites in proteins from amino acid sequence. RNA 12, 1450–62 (2006). [DOI] [PMC free article] [PubMed] [Google Scholar]
- Kim O. T., Yura K. & Go N. Amino acid residue doublet propensity in the protein-RNA interface and its application to RNA interface prediction. Nucleic Acids Res 34, 6450–60 (2006). [DOI] [PMC free article] [PubMed] [Google Scholar]
- Kumar M., Gromiha M. M. & Raghava G. P. Prediction of RNA binding sites in a protein using SVM and PSSM profile. Proteins 71, 189–94 (2008). [DOI] [PubMed] [Google Scholar]
- Perez-Cano L. & Fernandez-Recio J. Optimal protein-RNA area, OPRA: a propensity-based method to identify RNA-binding sites on proteins. Proteins 78, 25–35 (2010). [DOI] [PubMed] [Google Scholar]
- Allers J. & Shamoo Y. Structure-based analysis of protein-RNA interactions using the program ENTANGLE. J Mol Biol 311, 75–86 (2001). [DOI] [PubMed] [Google Scholar]
- Iwakiri J., Tateishi H., Chakraborty A., Patil P. & Kenmochi N. Dissecting the protein-RNA interface: the role of protein surface shapes and RNA secondary structures in protein-RNA recognition. Nucleic Acids Res 40, 3299–306 (2012). [DOI] [PMC free article] [PubMed] [Google Scholar]
- Gupta A. & Gribskov M. The role of RNA sequence and structure in RNA--protein interactions. J Mol Biol 409, 574–87 (2011). [DOI] [PubMed] [Google Scholar]
- Perez-Cano L., Jimenez-Garcia B. & Fernandez-Recio J. A protein-RNA docking benchmark (II): extended set from experimental and homology modeling data. Proteins 80, 1872–82 (2012). [DOI] [PubMed] [Google Scholar]
- Huang S. Y. & Zou X. A nonredundant structure dataset for benchmarking protein-RNA computational docking. J Comput Chem 34, 311–318 (2013). [DOI] [PMC free article] [PubMed] [Google Scholar]
- Case D. A. et al. The Amber biomolecular simulation programs. J Comput Chem 26, 1668–88 (2005). [DOI] [PMC free article] [PubMed] [Google Scholar]
- Liu S. & Vakser I. A. DECK: Distance and environment-dependent, coarse-grained, knowledge-based potentials for protein-protein docking. BMC Bioinformatics 12, 280 (2011). [DOI] [PMC free article] [PubMed] [Google Scholar]
- Shen J. et al. Predicting protein-protein interactions based only on sequences information. Proc Natl Acad Sci U S A 104, 4337–41 (2007). [DOI] [PMC free article] [PubMed] [Google Scholar]
- Kabsch W. & Sander C. Dictionary of protein secondary structure: pattern recognition of hydrogen-bonded and geometrical features. Biopolymers 22, 2577–637 (1983). [DOI] [PubMed] [Google Scholar]
- Lu X. J. & Olson W. K. 3DNA: a software package for the analysis, rebuilding and visualization of three-dimensional nucleic acid structures. Nucleic Acids Res 31, 5108–21 (2003). [DOI] [PMC free article] [PubMed] [Google Scholar]
- Berman H., Henrick K. & Nakamura H. Announcing the worldwide Protein Data Bank. Nat Struct Biol 10, 980 (2003). [DOI] [PubMed] [Google Scholar]
- Hwang H., Pierce B., Mintseris J., Janin J. & Weng Z. Protein-protein docking benchmark version 3.0. Proteins 73, 705–9 (2008). [DOI] [PMC free article] [PubMed] [Google Scholar]
Associated Data
This section collects any data citations, data availability statements, or supplementary materials included in this article.
Supplementary Materials
Supplementary Materials