Abstract
N-methyl substituted diacylglycerol-indololactones (DAG-indololactones) are newly-synthesized effectors of protein kinase C (PKC) isoforms and exhibit substantial selectivity between RasGRP3 and PKC alpha. We present a comprehensive analysis of membrane interactions and biological activities of several DAG-indololactones. Translocation and binding activity assays underline significant variations between the PKC translocation characteristics affected by the ligands as compared to their binding activities. In parallel, the fluorescent properties of the ligands were employed for analysis of their membrane association profiles. Specifically, we find that a slight change in the linkage to the indole ring resulted in significant differences in membrane binding and association of the DAG-indololactones with lipid bilayers. Our analysis shows that seemingly small structural modifications of the hydrophobic regions of these biomimetic PKC effectors contribute to pronounced modulation of membrane interactions of the ligands
Keywords: protein kinase C, phorbol ester, diacylglycerol-lactone, vesicles, FRET, tryptophane fluorescence
Introduction
Diacylglycerol (DAG) signaling represents one of the basic signaling pathways within the cell. DAG is generated downstream both of receptor tyrosine kinases and of G protein coupled receptors as a consequence of phospholipase C activation, which leads to breakdown of the signaling lipid phosphatidylinositol 4,5-bisphosphate. DAG levels are translated into cellular signaling via interaction with C1 domains,[1] which represent the DAG recognition motif in seven families of signaling proteins, including those of protein kinase C (PKC),[2] RasGRP,[3] chimaerin[4], and protein kinase D.[5] Consistent with the central role of DAG in cellular signaling, these C1 domain containing families of proteins play critical roles in cellular function and dysfunction. PKC is a validated therapeutic target for cancer.[6] RasGRP3 plays a central role in B cell receptor signaling[3] and in solid tumors such as prostate cancer.[7]
Among the agents in clinical trials targeting PKC, bryostatin 1 and ingenol 3-angelate (PEP005) both function as DAG analogs which bind to the C1 domain.[8] Our current understanding is that the C1 domain functions as a hydrophobic switch.[9] It possesses a hydrophilic binding cleft surrounded by a hydrophobic surface. Ligand binding completes the hydrophobic surface and additional hydrophobicity is contributed by hydrophobic substituents on the ligand such as the fatty acid side chains of the DAG.[10] The increased hydrophobicity of the ligand-C1 domain complex promotes membrane insertion of the C1 domain, both leading to a conformation change of the PKC accompanied by PKC activation and driving translocation of the PKC from the cytosol to the membrane. A complication is that the phospholipid surface itself contributes to the binding complex.[11] The phospholipid headgroups have interactions with the DAG or DAG analog and the side chains of the DAG or DAG analog will insert into and interact with the hydrophobic core of the lipid bilayer.
Natural products such as bryostatin 1 or phorbol ester function as ultrapotent analogs of DAG, where their structural rigidity maintains their pharmacophoric groups in an optimal orientation for C1 domain interaction. Because of their structural complexity, however, these compounds have been problematic for detailed structure function studies. As an alternative, we have developed DAG-lactones.[11] These structures combine a rigid template, yielding enhanced affinity, with relative chemical simplicity, permitting synthetic exploration of chemical space. We have been able to achieve nM binding affinities for PKC approaching those of the phorbol ester. We have described compounds with substantial selectivity between the PKC and RasGRP families of DAG signaling proteins.[12–13] Using combinatorial libraries of DAG-lactones, we have shown that modifications limited to the hydrophobic side chains can lead to marked differential activity for different biological endpoints.[14] These latter findings have suggested the concept of “chemical zip codes”, whereby the different patterns of substitution will optimize the ligands for microdomains within the membrane, driving the selectivity.
In the present study we explore two important structural variations starting from a special DAG-indololactone (1) that showed the highest selectivity for RasGRP3 relative to PKC alpha. First, the role of the orientation of the indole group relative to the body of the DAG-lactone template, under conditions of constant hydrophobicity, was investigated with the synthesis of DAG-indololactone 3. Second, we aimed to assess the importance of the N-CH3 moiety within the indole ring in 1 through synthesizing compound 2 in which a free N-H group would be capable of engaging in hydrogen bonding. In addition, a unique feature of these DAG-indololactones is their dramatic fluorescence emission, permitting real-time analysis of membrane uptake and cellular localization. The activities of the DAG-indololactones studied here were analyzed both for binding to PKC and RasGRP as well as for translocation with other PKC isozymes. In addition, their interactions with membranes were explored using a range of biophysical techniques in model vesicle systems.
Results and Discussion
Molecular selectivity
The compounds were evaluated for binding affinities to PKC alpha and to RasGRP3. Assays were carried out in the presence of 100 μg/mL of phosphatidylserine. Compound 2 differs from 1 only in that it lacks a methyl substitution on the nitrogen of the indole ring. Despite the potential for additional hydrogen-bonding involving the indole’s N-H group in 2, the absence of the methyl group improved only slightly the affinity toward both enzymes at the expense of a deficit in selectivity between PKC alpha and RasGRP3 (Table 1). Because of the greater ease of synthesis, the methyl group was included in the other derivative in the study (3), where the effect of changing the linkage between the indole ring and the DAG-lactone was explored. Therefore, further studies with the N-CH3 group would be appropriate as the series is extended. For both PKC alpha and RasGRP3, the point of attachment of the indole ring, either through the 2- or 3-positions, had only a modest effect on binding activity (Table 1). Correspondingly, there was only a modest effect on selectivity, with greater selectivity displayed upon linkage through the 3-position.
Table 1.
Selectivity of DAG-indololactones for PKC alpha versus RasGRP3
RasGRP1, the close homolog of RasGRP3, is known to have several domains in addition to the C1 domain which influence its interaction with membranes.[15,16] PKC alpha likewise has an additonal membrane binding domain.[6] The interplay between these membrane binding domains, phospholipid composition, and ligand selectivity remains to be explored.
Biological activity of DAG-indololactones on targets downstream of PKC
To compare the relative biological potencies of the DAG-indololactones, we treated the LNCaP human prostate cell line with the compounds and measured two well characterized responses downstream of PKC. Consistent with the in vitro binding data, we observed that compound 2 was most potent and compound 1 was least potent, both for inducing phosphorylation of PKD1 and for inducing phosphorylation of Erk1/2 (Figure 1).
Figure 1. Phosphorylation of Erk1/2 and PKD1 in LNCaP cells.
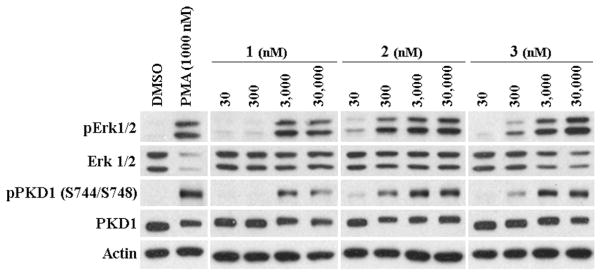
Western blot analysis was performed on total cell lysates prepared from LNCaP cells treated for 30 min with the indicated concentrations of the compounds or DMSO as control. A representative image of three independently performed experiment is shown.
Cellular uptake of DAG-indololactones and their induction of PKC translocation
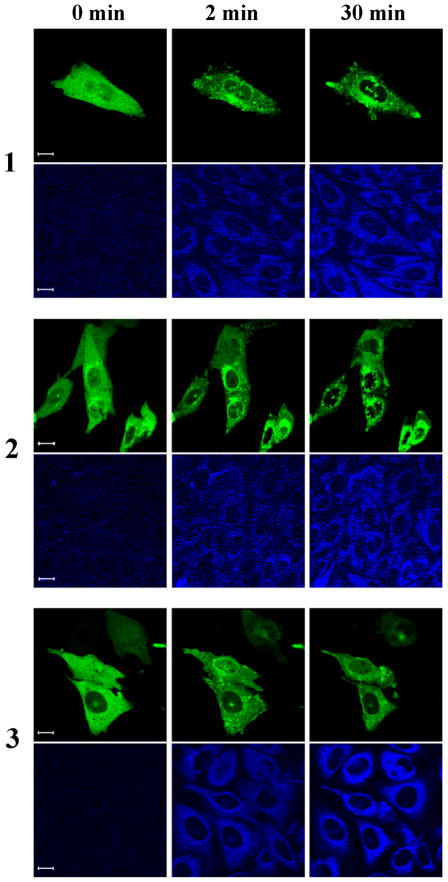
The uptake of the DAG-indololactones by Chinese hamster ovary cells and their subcellular localization were visualized by confocal microscopy, with images captured every 10–30 sec. All of the compounds were rapidly taken up, showing intracellular staining with no pronounced plasma membrane staining (Figure 2A).
Figure 2.
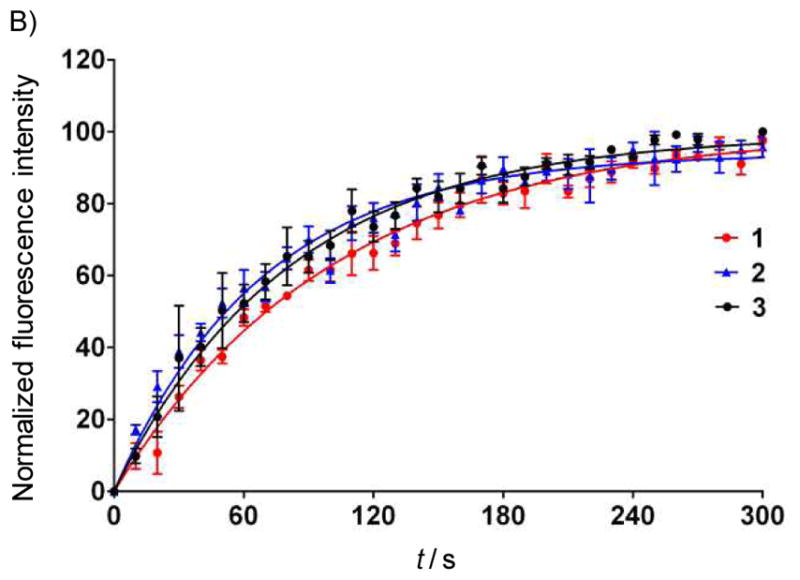
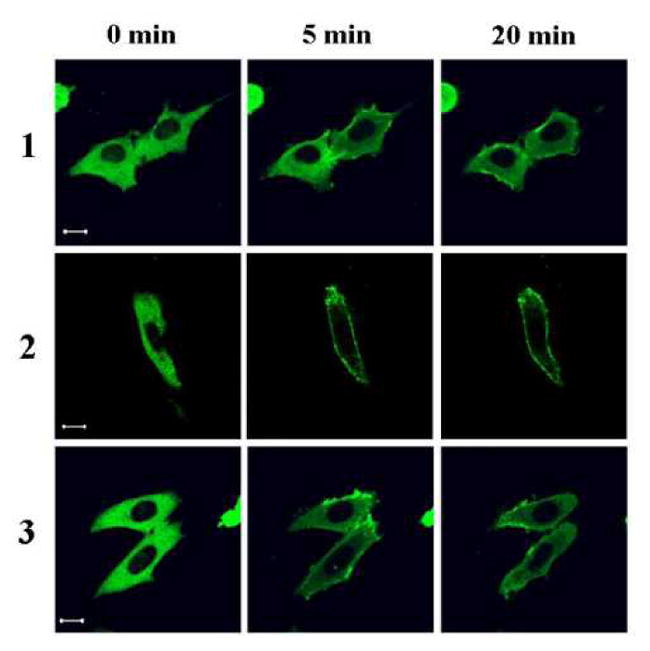
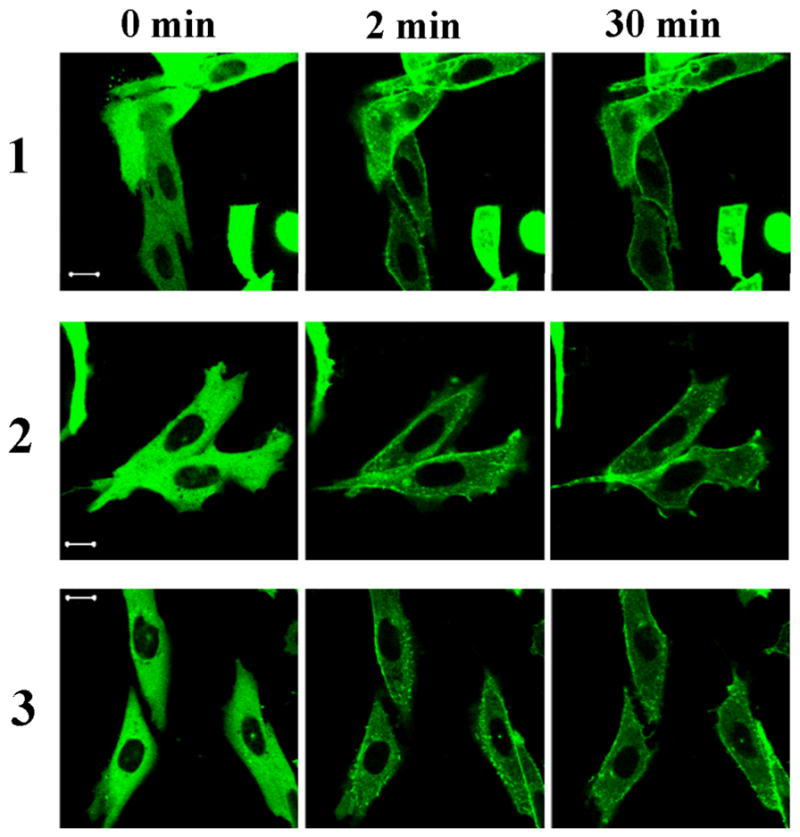
Figure 2A: Translocation of GFP-PKC delta in CHO cells. CHO cells transfected with GFP-PKC delta were treated with 10 μM of the compounds. Following treatment, images were captured every 30 seconds by confocal microscopy at two different channels: GFP (upper panel) and UV (lower panel)(this latter channel visualizes the DAG-indololactone). The contrast and intensity of UV images were optimized for better visualization using Adobe Photoshop CS3. Images are representative of three independent experiments for each compound. Scale bars, 10 μm.
Figure 2B: Rate of DAG-indololactone uptake into CHO cells. CHO cells were treated with 10 μM of the compounds and images were captured by confocal microscopy every 10 seconds after treatment. Fluorescence intensities normalized to maximal response from multiple independent experiments (n>4) were fitted to a one phase exponential association curve to calculate T1/2.
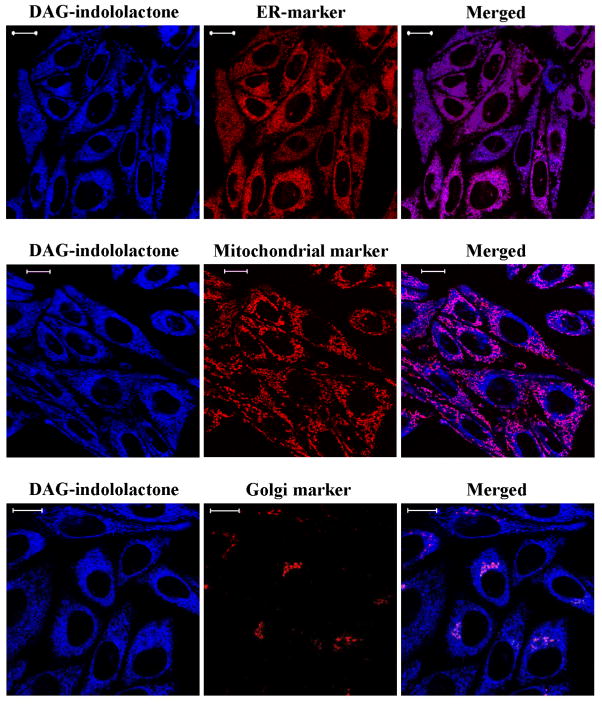
Figure 2C: Colocalization of DAG-indololactone 3 with different organelle markers. CHO cells loaded with endoplasmatic reticulum- (ER Tracker Red), mitochondrial- (MitoTracker Red CMXRos) or Golgi markers (BODIPY FL C5-ceramide) were treated with 10 μM compound 3 for 10 min. Z-stack images were captured by confocal microscopy. Images represent optimal sections from three independent experiments. Scale bars, 10 μm.
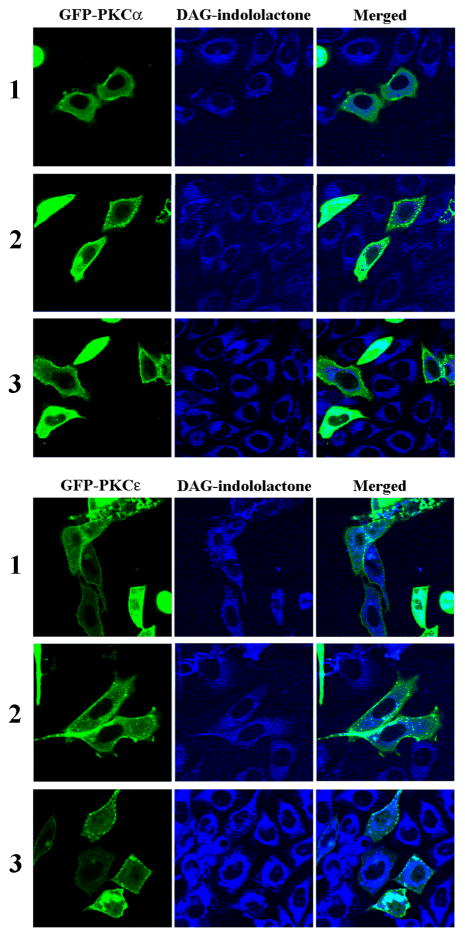
Figure 2D: Translocation of GFP-PKC alpha in CHO cells. CHO cells transfected with GFP-PKC alpha were treated with 10 μM of the compounds and images were captured by confocal microscopy every 30 seconds after treatment. Representative images from three independent experiments are shown. Scale bars, 10 μm.
Figure 2E: Translocation of GFP-PKC epsilon in CHO cells. CHO cells transfected with GFP-PKC epsilon were treated with 10 μM of the compounds and images were captured by confocal microscopy every 30 seconds after treatment. Images are representative of three independent experiments for each compound. Scale bars, 10 μm.
Figure 2F: Translocation of GFP-PKC alpha and PKC-epsilon in CHO cells. At the end of the PKC alpha (upper panel) and PKC epsilon (lower panel) translocation experiments (35 min) images were taken at two different channels: GFP and UV (this latter channel visualizes the DAG-indololactone). Separate and merged images are shown. The contrast and intensity on UV images were optimized for better visualization using Adobe Photoshop CS3. Images are representative of three independent experiments.
This pattern is similar to that observed previously for relatively hydrophilic phorbol esters and presumably reflects rapid distribution into the intracellular membrane pool.[18] Quantitation of the rates of uptake of the three DAG-indololactones revealed that they were relatively similar, with uptake being largely complete within 3–5 min (Figure 2B).Half-times of uptake were 70.2 ± 7.9, 49.1 ± 7.4, and 57.0 ± 9.2 seconds, respectively. The drug uptake was not influenced by the presence of overexpressed PKCs (compare blue fluorescence in Figure 2A for green (GFP-PKC delta overexpression) and non-green cells (without GFP-PKC delta overexpression; quantitation not shown). Compounds 1 and 2 showed less fluorescence intensity than did 3; for ease of comparison, image intensities were normalized. To confirm that the patchy internal localization reflected membrane association, we compared the distribution with that of markers for endoplasmic reticulum (ER), Golgi membranes, and mitochondria. Marked colocalization was observed (illustrated for 3, Figure 2C; data not shown, 1 and 2). The distribution of the DAG-indololactones thus resembled that of other lipophilic ligands, which likewise show a patchy internal distribution colocalizing with membrane markers.[19]
Translocation of over-expressed GFP-tagged PKC isoforms upon treatment with the compounds was also tested, with images captured every 30 sec. All compounds translocated GFP-PKC delta quickly to nuclear and other internal membranes. This pattern is similar to that of the more hydrophilic phorbol esters but contrasts with that to more hydrophobic phorbol esters such as phorbol 12-myristate 13-acetate, which initially cause translocation of PKC delta to the plasma membrane.[20] All compounds translocated PKC alpha to the plasma membrane, either fully or partially, indicating that the localization of the compounds was not the dominant factor determining to which membranes the PKC-alpha was translocated (Figure 2D and 2F). All compounds translocated PKC epsilon to the plasma membrane, yielding translocation similar to that for PKC alpha (Figure 2E).
Membrane interactions
The intrinsic fluorescence of the indole modules (Figure 1,SI) of the DAG-indololactones 1-3 constitutes an effective tool for analysis of membrane interactions of the ligands, since both the spectral shift and intensity of the indole fluorescence emission are highly sensitive to the molecular environment of the moiety.[21] Figure 2,SI depicts the effect of solvent polarity upon the fluorescence emission peaks of 1-3. In the context of membrane interactions discussed here, the indole fluorescence data in Figure 2 point to significant differences in bilayer insertion of the DAG-indololactones.
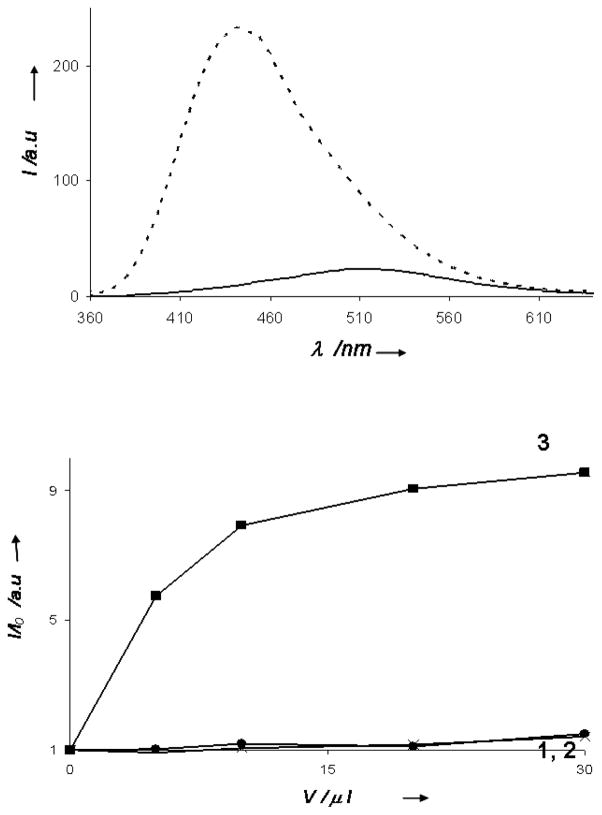
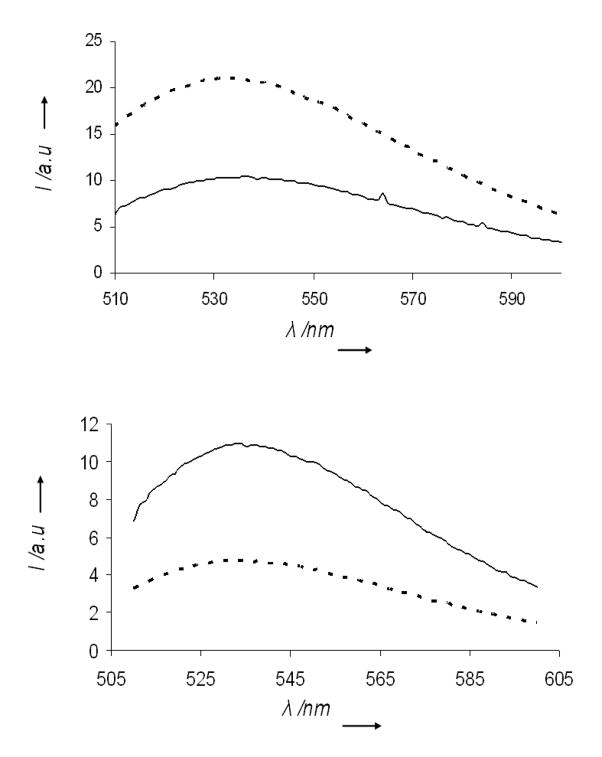
Figure 3A depicts the fluorescence emission spectra (excitation 330 nm) of DAG-indololactone 3 in aqueous solution (solid line) and in solution containing giant DMPC/DMPG vesicles (dashed line). Giant vesicles (GVs) constitute a useful model system for the cell membrane since they mimic both the size and curvature of the membrane surface, as well as the bilayer organization of the plasma membrane.[22–23] The fluorescence spectra in Figure 3A demonstrate the dramatic effect of bilayer insertion of 3. Specifically, Figure 3A shows that the fluorescence spectrum of 3 was considerably altered following incubation of the ligand with the giant vesicles: the peak position was shifted upfield by almost 80 nm and the fluorescence intensity dramatically increased. These spectral modulations are indicative of a significant insertion of 3 into the hydrophobic bilayer environment.[24]
Figure 3. Modulation of fluorescence intensity of DAG-indololactones following interaction with giant lipid vesicles.
A. Fluorescence emission spectra (excitation 330 nm) of 3 in buffer (solid spectra) and in giant vesicle solutions (broken spectra); B. Dose response curves depicting the ratios of fluorescence emission recorded in solutions of giant vesicles and in buffer, respectively.
The graph in Figure 3B depicting the dose response curves corresponding to the ratio between the bilayer/water fluorescence peak intensities highlights the significant difference in membrane interactions between 3, on the one hand, and 1 and 2 on the other hand. In contrast to 3, which exhibited pronounced vesicle-induced fluorescence modulation (Figure 3B), the fluorescence peaks of 1 and 2 were hardly affected by incubation with GVs, indicating that these two ligands underwent minimal insertion into the lipid bilayers.
To further probe membrane interactions of the DAG-indololactones we carried out fluorescence energy transfer experiments utilizing giant DMPG/DMPC vesicles which further contained the fluorescent dye NBD-PE. Figure 4 depicts the results of fluorescence resonance energy transfer (FRET) experiments in which the fluorescence emission spectra of NBD-PE were recorded following excitation at two wavelengths, respectively: 469 nm (the intrinsic excitation wavelength of NBD-PE) and 330 nm (excitation of the DAG-indololactones). Figure 4 shows that fluorescence energy transfer occurred only between 3 and the NBD-PE dye embedded in the vesicles (Figure 4A); virtually no energy transfer was observed when the NBD-PE/DMPG/DMPC vesicles were pre-incubated with 1 or 2 (Figure 4B). The fluorescence data in Figure 5 thus provide further evidence for the significant difference between the pronounced interaction and insertion of 3 into lipid bilayers, compared to 1 or 2. A particularly important result is the significant increase of the NBD-PE fluorescence emission when we employed excitation at 330 nm (excitation of 3) (Figure 4A); since minimal fluorescence of NBD-PE occurs when the dye is excited at such a low wavelength the result in Figure 4A most likely points to fluorescence energy transferred from 3 to NBD-PE. Indeed, experiments carried out using two concentrations of 3 demonstrated clear dependence between the NBD-PE emission peak and the presence of 3 within the vesicles (Figure 3,SI).
Figure 4. Fluorescence energy transfer induced by DAG-indololactones in vesicles containing NBD-PE.
Fluorescence emission spectra at two different excitation wavelengths: Solid spectra: excitation at 469 nm (excitation of NBD-PE); dashed spectra: excitation at 330 nm (excitation of the indole moieties within the DAG-indololactones). A. DAG-indololactone 3: Significant fluorescence energy transfer occurred when the vesicles were excited at 330 nm, leading to enhanced fluorescence emission; B. DAG-indololactone 2: no energy transfer apparent – excitation at 330 nm gave rise to low emission spectrum of the NBD dye. (a similar result recorded in the case of 1, data not shown).
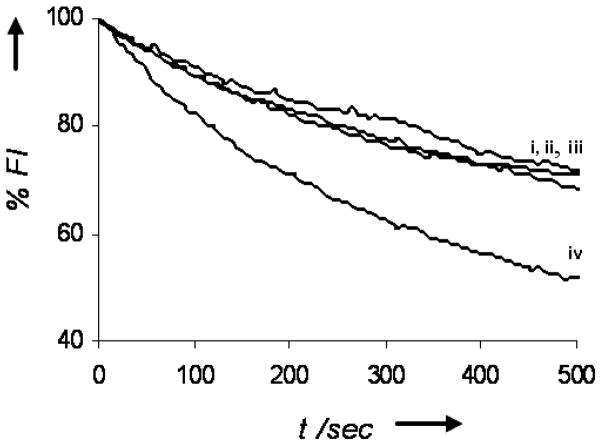
Figure 5. Interactions of DAG-indololactones at the bilayer interface.
Dithionite-induced fluorescence quenching of NBD-PE embedded in giant DMPG/DMPC vesicles, following pre-incubation with the DAG-indololactones. i. control vesicles (no DAG-indololactone added); ii. Vesicles were pre-incubated with 2; iii. Vesicles were pre-incubated with 1; iv. Vesicles were pre-incubated with 3.
Additional biophysical experiments were carried out to further probe membrane interactions of the DAG-indololactones (Figures 5 and 6). Figure 5 depicts fluorescence quenching experiments utilizing the giant NBD-PE/DMPG/DMPC vesicles. In these experiments the soluble quencher sodium dithionite is added to the vesicle solution at time zero, resulting in a gradual, exponential decrease of the fluorescence emission of the vesicle-surface displayed NBD.[22] As shown in Figure 5, co-incubation of the NBD-PE/DMPG/DMPC vesicles with the DAG-indololactones resulted in modulation of the NBD quenching curves. Such modulation of fluorescence curves is indicative of bilayer binding and surface disruption by membrane-interacting molecules.[25]
Figure 6. Increased bilayer fluidity induced by the DAG-indololactones.
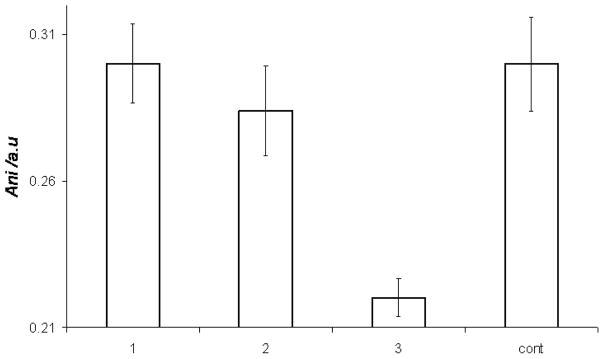
Modulation of fluorescence anisotropy of DPH-TMA embedded in giant vesicles following incubation with DAG-indololactones.
Figure 5 clearly shows that the DAG-indololactones gave rise to dramatically diverging modulations of the fluorescence quenching curves, indicating distinct interactions at the bilayer interface. Specifically, while pre-incubation of 1 and 2 with the NBD-PE/DMPG/DMPC giant vesicles had a negligible impact upon the quenching curves (Figure 5, curves ii,iii) indicating minimal interactions with the vesicles, 3 induced faster and more pronounced fluorescence quenching, suggesting significant disruption of the bilayer interface. The data presented in Figure 5 corroborate the results in Figures 3–4 pointing to significant interactions of 3 with lipid bilayers, much less in the case of 1 or 2.
While the quenching data in Figure 5 illuminate the impact of DAG-indololactone binding upon a fluorescent dye at the bilayer surface, we further analyzed the consequences of membrane interactions upon lipid organization and dynamics (Figure 6). Figure 6 depicts the results of fluorescence anisotropy measurements utilizing giant DMPC/DMPG vesicles which also contained the fluorescent dye diphenylhexatriene-trimethylammonium (DPH-TMA). DPH-TMA is embedded in the hydrophobic environment of the lipid bilayer, and changes to its fluorescence anisotropy generally provide a means for evaluating modulation of bilayer fluidity induced by membrane-active compounds.[26–27]
The variations in fluorescence anisotropy affected by the different DAG-indololactones depicted in Figure 6 point to distinct effects of these ligands upon the lipid bilayer. Figure 6 demonstrates that 1 and 2 did not significantly alter the bilayer fluidity, e.g. no experimentally significant modifications of the fluorescence anisotropy as compared to the control vesicles were recorded. DAG-indololactone 3, in comparison, induced a significant decrease in fluorescence anisotropy of the vesicle-embedded dye, pointing to enhanced bilayer fluidity.
Biological properties of the DAG-indololactones and their significance
Comprehensive analyses of DAG-lactones as ligands for PKC and the related families of signaling proteins that are regulated through the C1 domain DAG recognition motif point to interesting phenomena and exciting pharmacological potential.[11] Specifically, because the membrane environment constitutes the third element of the ternary binding complex, the potential selectivity for regulation can exploit all those factors of membrane microdomain composition and its variation as a function of localization within the cell. Differences in other factors contributing to membrane localization of PKC, such as calcium regulation of the interactions of the C2 domains of the classical PKCs with the membrane, may additionally contribute to differences in behavior between cell types.[6] The potential variation in specificity through membrane interactions was powerfully advanced through the analysis of several combinatorial libraries of DAG-lactones.[14] The DAG-lactones all retained the same DAG-lactone motif responsible for PKC C1 domain interaction and differed only in their patterns of hydrophobic substitution. Remarkably, different patterns of biological response were observed in each of multiple, diverse biological assays in which they were evaluated, suggesting that the patterns of hydrophobic substitution had profound effects on selectivity.
The compounds studied in this report represent a further exploration of the role of aromatic substituents on DAG-lactone selectivity. Aromatic substitution had yielded compounds with selectivity between two of the most prominent families of DAG targets – PKC and RasGRP.[12–14] In particular, compound 1 was among the most selective that we had identified.[12] Here, we first report on the role of the N-methyl group in that compound. We find that the analog with the methyl group absent, compound 2, was in fact not more selective. We also examined the influence of changing the orientation of the indole ring, as controlled by the position of its linkage to the DAG-lactone, on its activity and selectivity. Identical lipophilicity was retained, as indicated by the calculated by log P values.
Table 1 indicates that the indole orientation had little effect on the in vitro binding affinity for RasGRP3 or PKC alpha. On the other hand, indole orientation had dramatic effects upon membrane interactions of the compounds, as discussed in more detail below. Whereas an initial expectation might be that the identical Log P values of the derivatives would predict similar membrane interactions, the different stereochemical properties in fact drove marked differences. In the biophysical measurements in model vesicle systems, 3 was highly membrane-active, whereas compounds 1 and 2 showed little bilayer interactions. These findings emphasize that Log P is not a reliable predictor of the extent and nature of the membrane interaction for this structural class of compounds.
A unique feature of the DAG-indololactones studied here is their intrinsic fluorescence, which permitted monitoring the rate of their uptake into cells as well as their time-dependent localization. Furthermore, the fluorescence analysis corresponding to the DAG-indololactone localization could be combined with determination of the translocation patterns of PKC in response to the ligands. We have previously been able to use a similar approach with fluorescent phorbol esters.[17] Figure 1 showed that the rates of uptake of the DAG-indololactones were similar, despite their different patterns of membrane interactions. Likewise, all three compounds (1–3) induced clear PKC translocation. At this level of analysis, PKC translocation thus did not correlate with the biophysical analysis of membrane interactions in model vesicle systems. In addition, as observed earlier with the fluorescent phorbol esters,[18] localization of the various PKC isoforms did not mirror ligand localization. All of the DAG-indololactones accumulated predominantly at internal membranes, reflecting that the internal membranes constitute the overwhelming proportion of the total cellular membrane. In contrast, PKC alpha inserted into the plasma membrane, PKC epsilon associated both with the plasma membrane and internal membranes, and PKC delta localized to internal membranes in response to these ligands. We conclude that, while sufficient DAG-indololactone is required to drive PKC isoform translocation, the final pattern of PKC localization is dominated, in the case of PKC alpha and epsilon, by additional factors favoring their plasma membrane localization.
Biophysical analysis highlights the significant differences in membrane interactions and bilayer incorporation of the DAG-indololactones. In this context, the intrinsic fluorescence of the DAG-indololactones, employed for cell uptake analysis (Figure 2), constitutes also a powerful in vitro tool for probing the effects of the bilayer environment upon the DAG-indololactones and the reciprocal effect of the ligands upon the lipid bilayer. The experiments point to two groupings for the DAG-indololactones in terms of their membrane interactions: 3 exhibited marked membrane interactions and most likely localized deep within the lipid bilayer, whereas 1 and 2 appeared to experience minimal interactions with the bilayer. Compound 3 gave rise to the most pronounced effects in all fluorescence experiments carried out. The DAG-indololactone 3 also displayed the highest increase in the fluorescence emission spectrum (Figure 3), indicating a pronounced effect of the bilayer environment upon the indole unit. Furthermore, the dramatic FRET effect (Figure 4A), the enhanced fluorescence quenching (Figure 5), and the reduction of fluorescence anisotropy (Figure 6) are all indicative of significant binding, incorporation, and disruption of the lipid bilayer by this ligand. While all the biophysics experiments we carried out did not detect any experimentally-significant bilayer interactions of 2 and 1, the hydrophobic characteristics of these ligands (as well as log P values, see Supporting Information) indicate that they most likely do bind to lipid bilayers.
Conclusions
This work examined the relationship between biological activities and membrane interactions of DAG-indololactone positional isomers. The pronounced differences in membrane interactions of the compounds studied stand in contrast to the similar binding potencies and selectivities of the ligands examined. Our observations carry important consequences since the “zip code” hypothesis proposes that changes in the hydrophobic regions that must have only little effect on bulk physicochemical properties could still have dramatic changes in biology. We likewise see here that approximate measures of membrane activity such as Log P values do not reliably predict the nature of the membrane interactions. This study emphasizes, once again, the complex pharmacology of DAG-lactones and the dramatic influence of their hydrophobic side chains on their behavior.
Experimental Section
Materials
1,2-dimyristoyl-sn-glycerophosphocholine (DMPC), 1-(3-sn-Phosphatidyl)-rac-glycerol sodium salt (PG) and fluorescent dyes1,2-dipalmitoyl-sn-glycero-3-phosphoethanolamine-N-(7-nitro-2-1,3-benzoxadiazol-4-yl])(ammonium salt) (NBD-PE) were purchased from Avanti (Alabaster, AL). Sodium dithionite (Na2O4S2) and Tris(hydroxymethyl)aminomethane (TRIZMA base buffer, C4H11NO3), KCl, and sucrose were purchased from Sigma-Aldrich.1-(4-trimethylammoniumphenyl)-6-phenyl-1,3,5-hexatriene (TMA-DPH) was obtained from Molecular Probes, Inc. (Eugene, Oregon). [20-3H]phorbol 12,13-dibutyrate was obtained from Perkin Elmer, Waltham, NY. The pErk1/2, Erk1/2, pPKD1 (Ser744/Ser748), and PKD1 antibodies were from Cell Signaling Technology Inc (Danvers, MA) and the actin antibody, used for loading control, was from Sigma (St. Louis, MO).
Synthesis
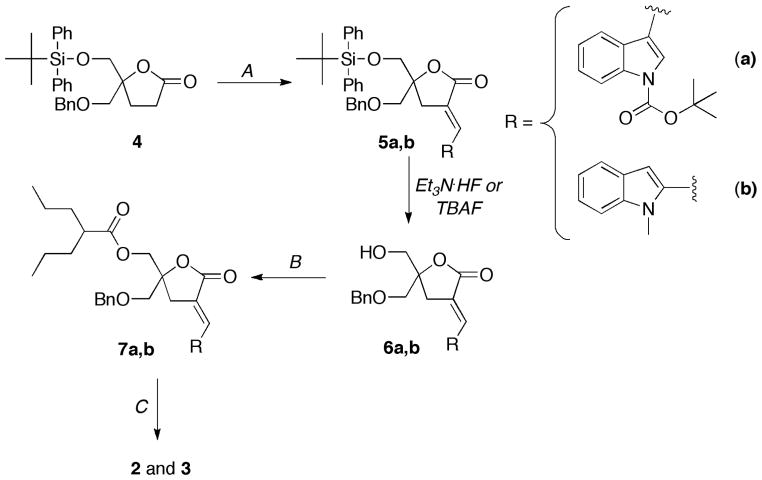
The syntheses of 2 and 3 were performed according to general published methods (Scheme 2).[12]
Scheme 2.
General Procedure A
Under argon, a solution of 4 (1 equiv) in THF (5 mL/mmol) at −78 °C was treated dropwise with [(CH3)3Si]2N-Li (LiHMDS, 1 M in THF, 1.5 equiv) and stirred at the same temperature for 1 h. A solution of the indole aldehyde (1.5 equiv dissolved in THF) was then added dropwise, and the reaction was stirred at −78 °C overnight. The reaction mixture was then quenched with a saturated aqueous solution of NH4Cl and allowed to warm to room temperature. The layers were separated, and the aqueous layer was extracted with Et2O (3×). The combined organics were washed with H2O (2×) and brine (1×), dried (MgSO4), and concentrated in vacuo. A solution of this intermediate and Et3N (4 equiv) in CH2Cl2 (10 mL/mmol) was cooled to 0 °C, treated dropwise with CH3SO2Cl (MsCl, 2 equiv) and then stirred at room temperature for 1–2 h. The reaction mixture was then cooled again to 0 °C and treated dropwise with 1,8-diazabicyclo[5.4.0]non-5-ene (DBU, 5 equiv). When the addition of DBU was complete, the reaction mixture was allowed to reach room temperature overnight. The volatiles were removed in vacuo, and the residue was treated with EtOAc followed by 1 N HCl. The layers were separated, and the aqueous layer was extracted with EtOAc (1 ×). The combined organics were washed with H2O (2 ×) and brine (1×), dried (MgSO4), and concentrated in vacuo. Purification by silica gel flash column chromatography (gradient EtOAc/hexanes) gave 5a, b.
General Procedure B
A solution of 6a, b (1 equiv) in dichloromethane (12 mL/mmol) was treated with Et3N (4 equiv), acid chloride (1.2 equiv) and a catalytic amount of DMAP (0.1 equiv). The reaction was stirred at room temperature and monitored by TLC, and upon completion it was concentrated in vacuo. Purification by silica gel flash column chromatography gave 7a, b.
General Procedure C
A solution of 7a, b (1 equiv) in dichloromethane (20 mL/mmol) was cooled to −78 °C and treated with BCl3 (4 equiv, 1M in CH2Cl2). The reaction was stirred at room temperature and monitored by TLC. Upon completion, the reaction was quenched by the slow addition of a saturated aqueous NaHCO3 solution, diluted with CH2Cl2 (20 mL/mmol), and warmed to room temperature. The layers were separated, and the aqueous layer was further extracted with CH2Cl2 (2 ×). The combined organics were dried (MgSO4) and concentrated in vacuo. Purification by silica gel flash column chromatography gave 2, 3.
(E)-tert-butyl-3-((5-((benzyloxy)methyl)-5-(((tert-butyldiphenylsilyl)oxy)-methyl)-2-oxodihydrofuran-3(2H)-ylidene)methyl)-1H-indole-1-carboxylate (5a)
According to general procedure A, 4 (1 g, 2.11 mmol) was combined with LHMDS (4.22 mL, 4.22 mmol) and commercially available tert-butyl 3-formyl-1H-indole-1-carboxylate (621 mg, 2.53 mmol). Subsequent treatment of the intermediate with MsCl (0.33 mL, 4.22 mmol), Et3N (1.17 mL, 8.44 mmol) and DBU (1.26 mL, 8.44 mmol) followed by purification by silica gel flash column chromatography (0 - 80% gradient EtOAc/hexanes) gave 5 a (1.1 g, 74% for two steps) as a yellow oil; 1H NMR (400 MHz, CDCl3) δ 8.11 (d, J = 8.2 Hz, 1 H, Ar), 7.79 – 7.72 (m, 3 H, Ar), 7.64 – 7.56 (m, 4 H, Ar), 7.44 – 7.21 (m, 13 H, Ar), 4.55 (s, 2 H, CH2), 3.79 (AB q, J = 10.8 Hz, 2 H, CH2), 3.65 (AB q, J = 10.3 Hz, 2 H, CH2), 3.01 (d, J = 2.9 Hz, 2 H, H4ab), 1.70 (s, 9 H, C(CH3)3), 0.97 (s, 9 H, C(CH3)3); 13C NMR (100 MHz, CDCl3) δ 171.27, 149.49, 137.60, 135.64, 135.58, 132.82, 132.57, 129.82, 129.81, 128.39, 127.76, 127.73, 127.63, 126.06, 125.40, 125.13, 124.89, 123.47, 119.00, 116.62, 115.30, 84.90, 84.70, 73.73, 71.79, 66.41, 33.32, 28.17, 26.65, 19.19; IR (neat) 3445 (OH), 2928 (CH), 2865 (CH), 1758 (C=O), 1664 (C=C) cm-1; FAB-MS (m/z, relative intensity) 702 (MH+, 16), 57 (100); Anal. (C43H47NO6Si•H2O) calcd C 71.74, H 6.86, N 1.95; found C 71.72, H 6.61, N 1.99.
(E)-5-((benzyloxy)methyl)-5-(((tert-butyldiphenylsilyl)oxy)methyl)-3-((1-methyl-1H-indol-2-yl)methylene)dihydrofuran-2(3H)-one (5b)
According to general procedure A, 4 (1.1 g, 2.3 mmol) was combined with LHMDS (4.64 mL, 4.64 mmol) and commercially available 1-methylindole-2-carboxaldehyde (443 mg, 2.78 mmol). Subsequent treatment of the intermediate with MsCl (0.36 mL, 4.6 mmol), Et3N (1.3 mL, 9.2 mmol) and DBU (1.37 mL, 9.2 mmol) followed by purification by silica gel flash column chromatography (0 – 70% gradient EtOAc/hexanes) gave 5b (1.0 g, 71% for two steps) as a yellow oil; 1H NMR (400 MHz, CDCl3) δ 7.69 – 7.58 (m, 6 H, Ar), 7.45 – 7.23 (m, 13 H, Ar and C=CH), 7.15 (ddd, J = 8.0, 6.7, 1.2 Hz, 1 H, Ar), 6.77 (s, 1 H, Ar), 4.56 (s, 2 H, CH2), 3.82 (AB q, J = 10.8 Hz, 2 H, CH2), 3.82 (s, 3 H, CH3), 3.65 (AB q, J = 10.2 Hz, 2 H, CH2), 3.11 – 3.05 (m, 2 H, H4ab), 0.98 (s, 9 H, C(CH3)3); 13C NMR (100 MHz, CDCl3) δ 171.40, 138.29, 137.55, 135.63, 135.58, 134.52, 132.76, 132.56, 129.81, 128.39, 127.74, 127.70, 127.65, 125.60, 123.93, 122.74, 121.41, 120.41, 109.65, 106.18, 84.92, 73.71, 71.80, 66.47, 33.44, 29.73, 26.64, 19.18; IR (neat) 2930 (CH), 2858 (CH), 1749 (C=O), 1646 (C=C) cm−1; FAB-MS (m/z, relative intensity) 616 (MH+, 7), 91 (100); Anal. (C39H41NO4Si•0.7H2O) calcd C 74.54, H 6.80, N 2.23.; found C 74.41, H 6.78, N 2.18.
(E)-tert-butyl 3-((5-((benzyloxy)methyl)-5-(hydroxymethyl)-2-oxodihydrofuran-3(2H)-ylidene)methyl)-1H-indole-1-carboxylate (6a)
A solution of 5a (350 mg, 0.50 mmol) in MeCN was treated with HF•Et3N (1.04 mL. 4.9 mmol) and refluxed overnight. The reaction mixture was then cooled to rt and concentrated in vacuo. Purification by silica gel flash column chromatography (0 – 90% gradient EtOAc/hexanes) gave 6a (200 mg, 86%) as a white solid. MP = 149–151 °C; 1H NMR (400 MHz, CDCl3) δ 8.03 (d, J = 8.2 Hz, 1 H, Ar), 7.76 – 7.64 (m, 3 H, Ar and C=CH), 7.43 – 7.17 (m, 7 H, Ar), 4.53 (s, 2 H, CH2), 3.77 (AB q, J = 12.2 Hz, 2 H, CH2), 3.60 (AB q, J = 10.1 Hz, 2 H, CH2), 3.00 (s, 2 H, H4ab), 2.39 (s, 1 H, OH), 1.67 (s, 9 H, C(CH3)); 13C NMR (100 MHz, CDCl3) δ 171.37, 149.38, 137.41, 134.73, 129.48, 128.39, 127.78, 127.59, 126.36, 126.33, 126.11, 126.09, 125.36, 123.89, 123.41,118.82, 116.33, 115.24, 85.00, 84.60, 73.67, 71.90, 65.42, 32.90, 28.11; IR (neat) 3384 (OH), 2914 (CH), 2869 (CH), 1732 (C=O), 1645 (C=C) cm−1; FAB-MS (m/z, relative intensity) 464 (MH+, 68), 57 (100); Anal. (C27H29NO6) calcd C 69.96, H 6.31, N 3.02.; found C 70.16, H 6.44, N 2.91.
(E)-5-((benzyloxy)methyl)-5-(hydroxymethyl)-3-((1-methyl-1H-indol-2-yl)methylene)dihydrofuran-2(3H)-one (6b)
A solution of 5b (390 mg, 0.63 mmol) in THF was cooled to 0 °C and treated with TBAF (0.76 mL, 0.76 mmol). The reaction mixture was then warmed to rt and monitored by TLC. Upon completion the reaction mixture was concentrated in vacuo. Purification by silica gel flash column chromatography (0 – 5% gradient MeOH/CH2Cl2) gave 6b (200 mg, 84%) as an ivory solid, which was used directly without further purification. 1H NMR (400 MHz, CDCl3) δ 7.66 (t, J = 2.9 Hz, 1 H, C=CH), 7.63 (br d, J = 8.0 Hz, 1 H, Ar), 7.34 – 7.25 (m, 7 H, Ar), 7.12 (ddd, J = 8.0, 6.2, 1.7 Hz, 1 H, Ar), 6.81 (s, 1 H, Ar), 4.55 (d, J = 7.2 Hz, 2 H, CH2), 3.80 (AB qd, 2 H, CH2), 3.80 (s, 3 H, CH3), 3.64 (AB q, J = 10.0 Hz, 2 H, CH2), 3.17 – 3.01 (m, 2 H, H4ab), 2.20 (br t, J = 5.7 Hz, 1 H, OH); 13C NMR (100 MHz, CDCl3) δ 171.33, 138.39, 137.40, 134.24, 130.22, 128.46, 127.89, 127.69, 127.64, 124.19, 123.85, 121.51, 120.52, 109.69, 106.62, 84.57, 73.75, 71.93, 65.60, 33.15, 25.96; IR (neat) 3409 (OH), 2927 (CH), 2863 (CH), 1704 (C=O), 1639 (C=C) cm−1; FAB-MS (m/z, relative intensity) 378 (MH+, 48), 377 (M•+, 29), 91 (100); HRMS (FAB) calcd for C23H23NO4: 400.1525 (M+Na+), found: 400.1522.
(E)-tert-butyl-3-((5-((benzyloxy)methyl)-2-oxo-5-(((2-propylpentanoyl)oxy)-methyl)dihydrofuran-3(2H)-ylidene)methyl)-1H-indole-1-carboxylate (7a)
According to general procedure B, 6a (74 mg, 0.16 mmol) was combined with 2-propylpentanoyl chloride (0.033 mL, 0.19 mmol), Et3N (0.089 mL, 0.04 mmol) and catalytic DMAP. Purification by silica gel flash column chromatography (0 – 50% gradient EtOAc/hexanes) gave 7a (75 mg, 80%) as a yellow oil; 1H NMR (400 MHz, CDCl3) δ 8.09 (d, J = 8.1 Hz, 1 H, Ar), 7.79 (t, J = 2.8 Hz, 1 H, C=CH), 7.78 – 7.73 (m, 2 H, Ar), 7.43 – 7.22 (m, 6 H, Ar), 4.57 (s, 2 H, CH2), 4.30 (s, 2 H, CH2), 3.63 (AB q, J = 10.1 Hz, 2 H, CH2), 3.09 (dd, J = 17.8, 2.9 Hz, 1 H, H4a), 2.92 (dd, J = 17.8, 2.8 Hz, 1 H, H4b), 2.33 tt, J = 8.9, 5.3 Hz, 1 H, CH2), 1.70 (s, 9 H, C(CH3)3), 1.55 – 1.42 (m, 2 H, CH2), 1.41 – 1.27 (m, 2 H, CH2), 1.27 – 1.09 (m, 4 H, CH2), 0.76 (dt, J = 14.5, 7.3 Hz, 6 H, 2 × CH3); 13C NMR (100 MHz, CDCl3) δ 175.86, 170.68, 149.41, 137.23, 134.79, 129.52, 128.45, 127.89, 127.67, 126.22, 125.95, 125.49, 123.52, 123.48, 118.88, 116.36, 115.31, 85.10, 82.29, 73.78, 71.87, 65.74, 45.14, 34.39, 34.35, 33.60, 28.11, 20.56, 20.53, 13.86, 13.81; IR (neat) 2958 (CH), 2933 (CH), 2871 (CH), 1736 (C=O), 1654 (C=C) cm−1; FAB-MS (m/z, relative intensity) 590 (MH+, 26), 57 (100); Anal. (C35H43NO7) calcd C 71.28, H 7.35, N 2.38.; found C 71.34, H 7.54, N 2.24.
(E)-(2-((benzyloxy)methyl)-4-((1-methyl-1H-indol-2-yl)methylene)-5-oxotetrahydrofuran-2-yl)methyl 2-propylpentanoate (7b)
According to general procedure C, 6b (90 mg, 0.24 mmol) was combined with 2-propylpentanoyl chloride (0.050 mL, 0.29 mmol), Et3N (0.134 mL, 0.96 mmol) and catalytic DMAP. Purification by silica gel flash column chromatography (0 – 90% gradient EtOAc/hexanes) gave 7b (90 mg, 78%) as an orange oil; 1H NMR (400 MHz, CDCl3) δ 7.68 (t, J = 2.8 Hz, 1 H, C=CH), 7.64 (d, J = 8.0 Hz, 1 H, Ar), 7.36 – 7.24 (m, 7 H, Ar), 7.17 – 7.10 (m, 1 H, Ar), 6.77 (s, 1 H, Ar), 4.58 (s, 2 H, CH2), 4.33 (s, 2 H, CH2), 3.82 (s, 3 H, CH3), 3.64 (AB q, J =10.0 Hz, 2 H, CH2), 3.15 (dd, J = 18.3, 2.9 Hz, 1 H, H4a), 3.00 (dd, J = 18.3, 2.8 Hz, 1 H, H4b), 2.35 (tt, J = 8.9, 5.3 Hz, 1 H, CH), 1.58 – 1.45 (m, 2 H, CH2), 1.42 –1.29 (m, 2 H, CH2), 1.29 – 1.11 (m, 4 H, 2 × CH2), 0.80 (t, J = 7.3 Hz, 3 H, CH3), 0.76 (t, J = 7.3 Hz, 3 H, CH3); 13C NMR (100 MHz, CDCl3) 175.80, 170.78, 138.37, 137.21, 134.11, 128.44, 127.89, 127.67, 127.61, 124.21, 123.88, 123.56, 121.47, 120.53, 109.66, 106.50, 82.47, 73.76, 71.90, 65.61, 45.14, 34.40, 34.37, 33.64, 29.71, 20.56, 20.52, 13.85, 13.80; IR (neat) 2957 (CH), 2933 (CH), 2871 (CH), 1736 (C=O), 1645 (C=C) cm−1; FAB-MS (m/z, relative intensity) 504 (MH+, 45), 91 (100); Anal. (C31H37NO5) calcd C 73.93, H 7.41, N 2.78.; found C 73.66, H 7.43, N 2.60.
(E)-(4-((1H-indol-3-yl)methylene)-2-(hydroxymethyl)-5-oxotetrahydrofuran-2-yl)methyl 2-propylpentanoate (2)
According to general procedure C, 7a (50 mg, 0.085 mmol) was treated with BCl3 (0.34 mL, 0.34 mmol) for 2 h. Purification by silica gel flash column chromatography (0 – 70% gradient EtOAc/hexanes) gave 2 (30 mg, 88%) as a yellow solid. MP = 154–156 °C; 1H NMR (400 MHz, CDCl3) δ 9.14 (br s, 1 H, NH), 7.93 (t, J = 2.6 Hz, 1 H, C=CH), 7.76 (d, J = 7.8 Hz, 1 H, Ar), 7.42 – 7.39 (m, 2 H, Ar), 7.30 – 7.18 (m, 1 H, Ar), 4.29 (AB q, J = 11.9 Hz, 2 H, CH2), 3.73 (AB q, J = 12.1 Hz, 2 H, CH2), 3.02 (dd, J = 17.4, 2.7 Hz, 1 H, H4a), 2.81 (dd, J = 17.3, 2.6 Hz, 1 H, H4b), 2.42 (v br s, 1 H, OH), 2.34 (tt, J = 8.8, 5.4 Hz, 1 H, CH), 1.54 – 1.44 (m, 2 H, CH2), 1.38 – 1.27 (m, 2 H, CH2), 1.27 – 1.10 (m, 4 H, 2 × CH2), 0.77 (t, J = 7.3 Hz, 3 H, CH3), 0.72 (t, J = 7.3 Hz, CH3); 13C NMR (100 MHz, CDCl3) δ 176.63, 171.93, 135.73, 128.89, 127.09, 126.38, 123.56, 121.40, 118.64, 117.81, 113.01, 111.64, 83.12, 65.38, 64.89, 45.19, 34.36, 33.04, 20.56, 13.87, 13.81; IR (neat) 3332 (OH), 2958 (CH), 2929 (CH), 2863 (CH), 1732 (C=O), 1702 (C=O), 1630 (C=C) cm−1; FAB-MS (m/z, relative intensity) 400 (MH+, 100); Anal. (C23H29NO5) calcd C 69.15, H 7.32, N 3.51.; found C 68.98, H 7.48, N 3.35.
(E)-(2-(hydroxymethyl)-4-((1-methyl-1H-indol-2-yl)methylene)-5-oxotetrahydrofuran-2-yl)methyl 2-propylpentanoate (3)
According to general procedure C, 7b (75 mg, 0.15 mmol) was treated with BCl3 (0.59 mL, 0.59 mmol) for 2 h. Purification by silica gel flash column chromatography (0 – 100% gradient EtOAc/hexanes) gave 3 (50 mg, 82%) as a yellow solid containing a trace of Z-isomer. 1H NMR (400 MHz, CDCl3) δ 7.67 (t, J = 2.8 Hz, 1 H, C=CH), 7.62 (dd, J = 8.0, 0.7 Hz, 1 H, Ar), 7.33 – 7.14 (m, 2 H, Ar), 7.14 – 7.10 (m, 1 H, Ar), 6.79 (s, 1 H, Ar), 4.30 (AB q, J = 11.9 Hz, 2 H, CH2), 3.85 – 3.67 (m, 5 H containing s at 3.79, CH2 and CH3), 3.16 (dd, J = 18.2, 2.9 Hz, 1 H, H4a), 2.97 (dd, J = 18.2, 2.8 Hz, 1 H, H4b), 2.62 (t, J = 6.5 Hz, 1 H, OH), 2.36 (tt, J = 8.8, 5.3 Hz, 1 H, CH), 1.53 – 1.48 (m, 2 H, CH2), 1.43 −1.29 (m, 2 H, CH2), 1.29 – 1.11 (m, 4 H, 2 × CH2), 0.81 (t, J = 7.3 Hz, 3 H, CH3), 0.76 (t, J = 7.3 Hz, 3 H, CH3); 13C NMR (100 MHz, CDCl3) δ 176.23, 171.04, 138.44, 133.99, 127.61, 124.35, 124.10, 123.50, 121.54, 120.60, 109.71, 106.76, 83.62, 65.17, 64.90, 45.16, 34.40, 34.39, 32.95, 29.70, 20.59, 20.57, 13.87, 13.82; IR (neat) 3460 (OH), 2959 (CH), 2937 (CH), 2873 (CH), 1735 (C=O), 1644 (C=C) cm−1; FAB-MS (m/z, relative intensity) 414 (MH+, 100); Anal. (C31H37NO6•0.4H2O) calcd C 68.52, H 7.62, N 3.33.; found C 68.53, H 7.43, N 3.25.;HRMS [performed on LTG Orbitrap XL ETD high resolution mass spectrometer (Thermo Scientific, Bremen, Germany) with nano-ESI source, operated in the positive ion mode] calculated for C24H31NNaO5: 436.2099 (MNa+), found: 436.2087.
Activation of signaling pathways downstream of PKCs
The potency of different DAG-indololactones was determined by their ability to induce Erk1/2 and PKD1 phosphorylation, two signaling events reflecting PKC activation, detected by western blotting. Western blotting was performed as described earlier[28] with minor modifications. The pERK1/2, ERK1/2, pPKD1 (S744/S748), PKD1 antibodies were from Cell Signaling Technology Inc (Danvers, MA). The actin antibody, used for loading control, was from Sigma (St. Louis, MO).
Translocation of GFP-Tagged PKC Isoforms in CHO Cells
Translocation experiments were performed as described earlier with minor modifications[28]. CHO cells were purchased from the American Type Culture Collection (ATCC, Manassas, VA) and cultured in F12-K medium supplemented with 10% fetal bovine serum (ATCC, Manassas, VA). CHO cells plated onto T delta dishes (Bioptechs Inc., Butler, PA) were transfected with GFP-tagged PKCα, PKCδ or PKCε using Lipofectamine and Plus reagent (Invitrogen, Carlsbad, CA).
Confocal microscopy was performed using a Zeiss LSM 510 NLO system (Carl Zeiss Inc, Thornwood, NY, USA) with an Axiovert 200M inverted microscope and a 30 mW Argon laser tuned to 488 nm as well as the 2-photon laser tuned to 750 nm. Cells were imaged with a 63x 1.4 NA Zeiss Plan-Apochromat oil immersion objective. Using the Zeiss AIM (v 4.0) software, cells were scanned every 30 s using a multi-track configuration where the blue fluorescing compound and GFP signals were sequentially collected with a BP 435-485 nm filter and a BP 500-550 nm filter after sequential excitation with the 750 nm and 488 nm laser lines, respectively. The intensity and contrast of the UV images were optimized for better visualization by the software Adobe PhotoShop CS3 (Adobe Systems Inc., San Jose, CA).
Rate of DAG-indololactone uptake into CHO cells
Cells were scanned every 10 sec using the conditions described above for translocation studies. Fluorescent intensities in multiple regions of interest (ROI) measured by the Zeiss AIM (v 4.0) software were plotted in time, normalized to maximal response and T1/2 was calculated from a one phase exponential fitting of the points (GraphPad Prism 5.02, GraphPad Software, Inc, San Diego, CA).
Colocalization of DAG-indololactones with different organelle markers
CHO cells plated as described above were loaded with endoplasmatic reticulum marker ER Tracker Red, mitochondrial marker MitoTracker Red CMXRos or Golgi marker BODIPY FL C5-ceramide following the insructions of the manufacturer (Invitrogen, Carlsbad, CA). Confocal microscopy was performed on the loaded cells treated with 10 μM DAG-indololactone 3 for 10 min using a Zeiss LSM 710 NLO system (Carl Zeiss Inc, Thornwood, NY, USA) with Zeiss ZEN 2009 software with a Zeiss Observer Z1 inverted microscope and 30 mW 405 diode laser, a 25 mW Argon 488 nm visible laser and a 15 mW 561 nm DPSS laser. A 63x Plan-Apochromat 1.4 NA oil immersion objective was used and digital images were 512 × 512 pixels. Emission signals after sequential excitation by the 405 nm, 488 nm or 561 nm laser lines were collected with a BP 419-485 nm filter, BP 495-534 nm filter, and BP 568 – 624 nm filter respectively, using individual photomultipliers. Although signals from the Golgi marker BODIPY FL C5-ceramide were detected both at 511 nm (green) and at 620 nm (red), the red images were presented for colocalization in Figure 3C.
Ligand selectivity
Binding of ligands to PKC alpha and to RasGRP3 was determined as described in Pu et al (2005).13 Briefly, binding affinities were measured by competition for binding of [20-3H]phorbol 12,13-dibutyrate to PKC alpha or RasGRP3 in the presence of 100 μg/mL phosphatidylserine. Ki values represent the mean of at least 3 independent experiments, where each experiment represents a complete dose response curve with a minimum of 7 concentrations of the competing ligand, and triplicate measurements were performed at each concentration in each experiment. RasGRP3 was expressed as a GFP fusion protein and purified as described.[29]
Giant vesicles (GVs) preparation
GVs were prepared through the rapid evaporation method.[30] GVs comprising combinations of lipids were prepared in the molar ratio of 9:1 for PC/PG. The lipid constituents were dissolved in 1:1 chloroform/ethanol (v/v) and subsequently added to a 250 mL round-bottom flask containing 1 mL of chloroform. The aqueous phase (5 mL of 0.1M sucrose, 0.1 M KCl, 2 mM Tris solution, pH 7.4) was then carefully added along the flask walls. The organic solvent was removed in a rotary evaporator under reduced pressure (final pressure 40 mbar) at 25°C and 40 rpm. After evaporation for 4–5 min, an opalescent fluid was obtained with a volume of approximately 5 mL.
Fluorescence Measurements
Changes in the compounds’ intrinsic emission were measured for 1.21 μM (40) and 6.05 μM (84, 159) solutions titrated with PC/PG GVs. Fluorescence emission spectra were acquired at 27 °C on a FL920 spectrofluorimeter (Edinburgh Co., Edinburgh, UK), using excitation at 280 nm. Total sample volumes were 1 mL, and the solutions were placed in a quartz cell having a 1 cm optical path length. Light scattering from the vesicles was confirmed to account for less than 5% of the emission intensity.
Fluorescence anisotropy
The fluorescence probe TMA-DPH was incorporated into the GVs by adding the dye dissolved in THF (1 mM) to vesicles up to a final concentration of 1.25 μM. After 30 min of incubation at room temperature TMA-DPH fluorescence anisotropy was measured at 430 nm (excitation 355 nm) on a FL920 spectrofluorimeter (Edinburgh Co., Edinburgh, UK). Anisotropy values were automatically calculated by the spectrofluorimeter software using conventional methodology. The concentration of compounds was 2.42 μM.
Fluorescence quenching
NBD-PE was added to the GVs at a molar ratio of 1:100 (probe: total phospholipids) and the lipids were then dried together in vacuo prior to sonication. Samples were prepared by mixing a selected quantity of DAG-indololactones with 30 μL of the vesicles containing the fluorescent probe and 30 μL of 50 mM Tris buffer (pH 8.2), followed by addition of distilled water to a total volume of 1.5 mL. The quenching reaction was initiated by adding sodium dithionite, from a stock solution of 0.6 M in 50 mM Tris buffer (pH 11), to give a final concentration of 1 mM. The decrease in fluorescence emission was recorded for 5 min at room temperature using 469 nm excitation and 560 nm emission on an Edinburgh Co. FL920 spectrofluorimeter (Edinburgh, Scotland, UK). The fluorescence decay curves were calculated as a percentage of the initial fluorescence measured before the addition of dithionite. The concentration of compounds was 2.42 μM.
Supplementary Material
Scheme 1.
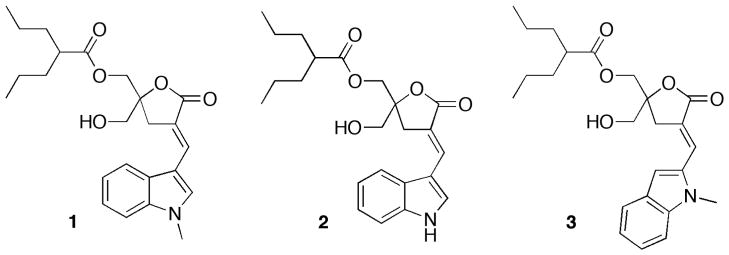
Structures of DAG-indololactones
Acknowledgments
This research was supported in part by the Intramural Research Program of the National Institutes of Health, Center for Cancer Research, National Cancer Institute (Z1A BC 005270).
Footnotes
Supporting information for this article is available on the WWW 1 under http://www.chembiochem.org or from the author.
Contributor Information
Dr. Dina M. Sigano, Email: siganod@mail.nih.gov.
Dr. Peter M. Blumberg, Email: blumberp@dc37a.nci.nih.gov.
Prof. Raz Jelinek, Email: razj@bgu.ac.il.
References
- 1.Hurley JH, Newton AC, Parker PJ, Blumberg PM, Nishizuka Y. Protein Sci. 1997;6:477–480. doi: 10.1002/pro.5560060228. [DOI] [PMC free article] [PubMed] [Google Scholar]
- 2.Steinberg SF. Physiol Rev. 2008;88:1341–1378. doi: 10.1152/physrev.00034.2007. [DOI] [PMC free article] [PubMed] [Google Scholar]
- 3.Coughlin JJ, Stang SL, Dower NA, Stone JC. J Immunol. 2005;175:7179–7184. doi: 10.4049/jimmunol.175.11.7179. [DOI] [PubMed] [Google Scholar]
- 4.Yang C, Kazanietz MG. Biochem J. 2007;403:1–12. doi: 10.1042/BJ20061750. [DOI] [PubMed] [Google Scholar]
- 5.Wang QJ. Trends Pharmacol Sci. 2006;27:317–323. doi: 10.1016/j.tips.2006.04.003. [DOI] [PubMed] [Google Scholar]
- 6.Griner EM, Kazanietz MG. Nat Rev Cancer. 2007;7:281–292. doi: 10.1038/nrc2110. [DOI] [PubMed] [Google Scholar]
- 7.Yang D, Kedei N, Li L, Tao J, Velasquez JF, Michalowski AM, Toth BL, Marincsak R, Varga A, Biro T, Yuspa SH, Blumberg PM. Cancer Res. 2010;70:7905–7919. doi: 10.1158/0008-5472.CAN-09-4729. [DOI] [PMC free article] [PubMed] [Google Scholar]
- 8.Blumberg PM, Kedei N, Lewin NE, Yang D, Czifra G, Pu Y, Peach ML, Marquez VE. Curr Drug Targets. 2008;9:641–652. doi: 10.2174/138945008785132376. [DOI] [PMC free article] [PubMed] [Google Scholar]
- 9.Newton AC. J Lipid Res. 2009;50:S266–S271. doi: 10.1194/jlr.R800064-JLR200. [DOI] [PMC free article] [PubMed] [Google Scholar]
- 10.Zhang G, Kazanietz MG, Blumberg PM, Hurley JH. Cell. 1995;81:917–924. doi: 10.1016/0092-8674(95)90011-x. [DOI] [PubMed] [Google Scholar]
- 11.Marquez VE, Blumberg PM. Acc Chem Res. 2003;36:434–443. doi: 10.1021/ar020124b. [DOI] [PubMed] [Google Scholar]
- 12.El Kazzouli S, Lewin NE, Blumberg PM, Marquez VE. J Med Chem. 2008;51:5371–5386. doi: 10.1021/jm800380b. [DOI] [PMC free article] [PubMed] [Google Scholar]
- 13.Pu Y, Perry NA, Yang D, Lewin NE, Kedei N, Braun DC, Choi SH, Blumberg PM, Garfield SH, Stone JC, Duan D, Marquez VE. J Biol Chem. 2005;280:27329–27338. doi: 10.1074/jbc.M414132200. [DOI] [PubMed] [Google Scholar]
- 14.Duan D, Sigano DM, Kelley JA, Lai CC, Lewin NE, Kedei N, Peach ML, Lee J, Abeyweera TP, Rotenberg SA, Kim H, Kim YH, El Kazzouli S, Chung JU, Young HA, Young MR, Baker A, Colburn NH, Haimovitz-Friedman A, Truman JP, Parrish DA, Deschamps JR, Perry NA, Surawski RJ, Blumberg PM, Marquez VE. J Med Chem. 2008;51:5198–5220. doi: 10.1021/jm8001907. [DOI] [PMC free article] [PubMed] [Google Scholar]
- 15.Zahedi B, Goo HJ, Beaulieu N, Tazmini G, Kay RJ, Cornell RB. J Biol Chem. 2011;286:12712–12723. doi: 10.1074/jbc.M110.189605. [DOI] [PMC free article] [PubMed] [Google Scholar]
- 16.Beaulieu N, Zahedi B, Goulding RE, Tazmini G, Anthony KV, Omeis SL, de Jong DR, Kay RJ. Mol Biol Cancer. 2007;18:3156–3168. doi: 10.1091/mbc.E06-10-0932. [DOI] [PMC free article] [PubMed] [Google Scholar]
- 17.Wildman SA, Crippen GM. J Chem Inf Comput Sci. 1999;39:868–873. [Google Scholar]
- 18.Braun DC, Cao Y, Wang S, Garfield SH, Hur GM, Blumberg PM. Mol Cancer Ther. 2005;4:141–150. [PubMed] [Google Scholar]
- 19.Lazar J, Braun DC, Toth A, Wang Y, Pearce LV, Pavlyukovets VA, Blumberg PM, Garfield SH, Wincovitch S, Choi HK, Lee J. Mol Pharmacol. 2006;69:1166–1173. doi: 10.1124/mol.105.019158. [DOI] [PubMed] [Google Scholar]
- 20.Wang QJ, Bhattacharyya QJD, Garfield S, Nacro K, Marquez VE, Blumberg PM. J Biol Chem. 1999;274:37233–37239. doi: 10.1074/jbc.274.52.37233. [DOI] [PubMed] [Google Scholar]
- 21.Burnett D, Audus LJ. Phytochemistry (Elsevier) 1964;3:395–415. [Google Scholar]
- 22.Dietrich C, Bagatolli LA, Volovyk ZN, Thompson NL, Levi M, Jacobson K, Gratton E. Biophys J. 2001;80:1417–1428. doi: 10.1016/S0006-3495(01)76114-0. [DOI] [PMC free article] [PubMed] [Google Scholar]
- 23.Limozin L, Barmann M, Sackmann E. Eur Phys J E: Soft MatterBiol Phys. 2003;10:319–330. doi: 10.1140/epje/i2002-10118-9. [DOI] [PubMed] [Google Scholar]
- 24.Lakowicz JR. Principles of Fluorescence Spectroscopy. 2. Kluwer Academic/Plenum; New York: 1999. p. 954. [Google Scholar]
- 25.McIntyre JC, Sleight RG. Biochemistry. 1991;30:11819–11827. doi: 10.1021/bi00115a012. [DOI] [PubMed] [Google Scholar]
- 26.Illinger D, Duportail G, Mely Y, Poirel-Morales N, Gerard D, Kuhry JG. Biochim Biophys Acta. 1995;1239:58–66. doi: 10.1016/0005-2736(95)00135-p. [DOI] [PubMed] [Google Scholar]
- 27.Lentz BR. Chem Phys Lipids. 1993;64:99–116. doi: 10.1016/0009-3084(93)90060-g. [DOI] [PubMed] [Google Scholar]
- 28.Comin MJ, Czifra G, Kedei N, Telek A, Lewin NE, Kolusheva S, Velasquez JF, Kobylarz R, Jelinek R, Blumberg PM, Marquez VE. J Med Chem. 2009;52:3274–3283. doi: 10.1021/jm900186m. [DOI] [PMC free article] [PubMed] [Google Scholar]
- 29.Lorenzo PS, Kung JW, Bottorff DA, Garfield SH, Stone JC, Blumberg PM. Cancer Res. 2001;61:943–949. [PubMed] [Google Scholar]
- 30.Moscho A, Orwar O, Chiu DT, Modi BP, Zare RN. Proc Natl Acad Sci USA. 1996;93:11443–11447. doi: 10.1073/pnas.93.21.11443. [DOI] [PMC free article] [PubMed] [Google Scholar]
Associated Data
This section collects any data citations, data availability statements, or supplementary materials included in this article.


