

Abstract
BEP clade of the grass family (Poaceae) is composed of three subfamilies, i.e. Bambusoideae, Ehrhartoideae, and Pooideae. Controversies on the phylogenetic relationships among three subfamilies still persist in spite of great efforts. However, previous evidence was mainly provided from plastid genes with only a few nuclear genes utilized. Given different evolutionary histories recorded by plastid and nuclear genes, it is indispensable to uncover their relationships based on nuclear genes. Here, eleven species with whole-sequenced genome and six species with transcriptomic data were included in this study. A total of 121 one-to-one orthologous groups (OGs) were identified and phylogenetic trees were reconstructed by different tree-building methods. Genes which might have undergone positive selection and played important roles in adaptive evolution were also investigated from 314 and 173 one-to-one OGs in two bamboo species and 14 grass species, respectively. Our results support the ((B, P) E) topology with high supporting values. Besides, our findings also indicate that 24 and nine orthologs with statistically significant evidence of positive selection are mainly involved in abiotic and biotic stress response, reproduction and development, plant metabolism and enzyme etc. from two bamboo species and 14 grass species, respectively. In summary, this study demonstrates the power of phylogenomic approach to shed lights on the evolutionary relationships within the BEP clade, and offers valuable insights into adaptive evolution of the grass family.
Introduction
Traditional phylogenetic studies were mainly based on ribosomal (rDNA), chloroplast DNA (cpDNA), mitochondrial genes and several nuclear gene fragments [1], [2]. However, they are susceptible to random or stochastic error (limited genes and taxa sampling) [3], [4] and horizontal gene transfer [5], when inferring phylogenetic and evolutionary relationships. The increasing capacity of DNA sequencing technologies has made vast amount of nuclear sequence information possible, mainly including expressed sequence tags (ESTs), transcriptome (RNA-Seq reads) and whole genome sequences from a growing number of species [6]. To take full advantage of such a wealth of data, phylogenomic method was proposed to exploit a huge number of genes to infer accurate phylogenetic relationships and gain insights into the mechanisms of molecular evolution [7], [8], [9]. In the last few years, phylogenomic analyses that reduce the influence of gene-specific noise and thereby yield possible more robust phylogenetic reconstructions for difficult taxonomic problems, have been widely adopted in animal and fungi [10], [11], [12], [13], [14], [15], [16], [17], [18], [19], [20], [21], [22]. However, large-scale nuclear genome-level analyses of plants have recently just begun for phylogenetic studies [23], [24] due to the availability of few large genomic, ESTs and transcriptomic datasets for complex plant genomes (e.g., polyploidy). Fortunately, high-throughput next-generation sequencing (NGS) technologies such as the Illumina HiSeq and Roche 454 have opened up genomic and transcriptomic resources to non-model organisms, providing us with the precious opportunity to address complex problems of plant evolution through phylogenomics [25], [26], [27], [28].
The grass family (Poaceae) is one of the largest and the most widely distributed groups of flowering plants with more than 700 genera and 10,000 species. In spite of the important economic and ecological values, the phylogenetic and evolutionary relationships of the grass family are still only partially understood. In the past decades, the phylogenetic relationships of Poaceae have been distinguished into three basal lineages (Anomochlooideae, Pharoideae and Puelioideae), two major clades comprising the BEP clade (Bambusoideae, Ehrhartoideae, and Pooideae) and the PACCMAD clade (Panicoideae, Arundinoideae, Chloridoideae, Centothecoideae, Micrairoideae, Aristidoideae, and Danthonioideae) [29], [30]. Within the BEP clade, several studies using non-nuclear genes such as cpDNA makers supported the ((B, E) P) relationships [31], [32]. Nevertheless, the great majority of these studies have revealed the ((B, P) E) topology [30], [33], [34], [35], [36], [37], [38]. Plastid genes are usually inherited from only one parent (in most cases, maternally) [39], and rDNA sequences are not always completely homogenized [40]. Therefore, these problems might increase the uncertainty of tracing the phylogenetic relationships and evolutionary histories in many plant lineages [41], [42]. In addition to the phylogenies inferred from cpDNA and rDNA markers, few studies using large-scale genomic datasets to reconstruct the BEP trees have been published, but their relationships were still not fully resolved [43], [44].
Adaptive evolution of genomes is ultimately responsible for various morphological and physiological adaptations of plant, and can proceed through a beneficial mutation of gene sequences. Therefore, detecting genes under positive selection (Darwinian natural selection) has been a long-term goal in plant evolutionary biology. The grass family inhabits a wide range of environmental niches, and possesses developmental and physiological characteristics such as disease response, drought and cold tolerance, C3 and C4 photosynthetic pathway [45]. Within it, the subfamily Bambusoideae is a special and unique member with woody stems adaptive to forest habitat and unique flowering circles. The subfamily is divided into three major tribes: Arundinarieae (represented by Phyllostachys edulis), Bambuseae (represented by Dendrocalamus latiflorus) and Olyreae [46], corresponding to the temperate woody bamboos, the tropical woody bamboos and the herbaceous bamboos, respectively. The change of positive selection in the gene sequences might have happened within the grass family to adapt to their changing environment during the past 30 to 70 million years [45]. Genes identified under positive selection within the Poaceae are mainly related to disease response [47], [48] and photosynthetic pathway [49], [50]. Positively selected genes in other biological function were rarely reported. Few studies have performed the positive selection analysis based on orthologs of large-scale genomic datasets in plant [23], [51], while this kind of knowledge is still very limited in Poaceae, particularly in Bambusoideae.
In this study, we first integrated and developed the bioinformatics pipeline to deal with large-scale phylogenomic datasets (Figure S1). Then we employed nuclear genomic data of 16 monocot species plus Arabidopsis, incorporating Illumina RNA-Seq reads from D. latiflorus, performed multiple-step bioinformatics analyses to investigate the phylogenetic relationships within the BEP clade by the concatenation [52] and coalescent analyses [20], [53], [54], [55], [56], and identified genes under positive selection in the grass family. Based on 121 orthologous nuclear genes, we successfully confirmed the phylogenetic relationships of the BEP clade based on recent analyses of chloroplast phylogenomics [33], [34], [38]. In addition, we also found genes evolving under positive selection from 314 and 173 one-to-one OGs in two bamboo species and 14 grass species that might be involved in response to environment stress, development and reproduction, signal transduction, biosynthesis and metabolism, for example, PM5, homologous-pairing protein Meu13, OsClp8, gamma-glutamyl hydrolase precursor protein, RNA-recognition-motif (RRM) protein, and DNA-directed RNA polymerase II in the grass family. In summary, this study achieved three goals: 1) to predict sets of one-to-one OGs by uniting OrthoMCL-v2.0.2 [57] and HaMStR-v8.0 [58], 2) to reconstruct the phylogeny of the BEP clade using nuclear-gene-based phylogenomic approach, and 3) to identify and annotate positively selected genes and their function in the grass family.
Materials and Methods
Data Sources
All raw reads of flowers from D. latiflorus was generated by Illumina deep sequencing platform. RNA-Seq library construction and sequencing were described in our previous study [59]. All clean Illumina RNA-Seq reads were deposited in NCBI (http://www.ncbi.nlm.nih.gov/) and can be accessed in the Short Read Archive (SRA) (accession number: SRR772311). Other sequences used in this study were obtained from Ensembl (http://www.ensembl.org), NCBI (http://www.ncbi.nlm.nih.gov/), PlantGDB (http://www.plantgdb.org/), the Date Palm Genome (http://qatar-weill.cornell.edu/research/datepalmGenome/) [60], and the Banana Genome (http://banana-genome.cirad.fr) [61] databases. Detailed information of sampling was listed in Table S1.
Sequence Processing
All clean Illumina RNA-Seq reads of flowers from D. latiflorus were newly de novo assembled using Trinity-r2011-07-13 software [62], [63] to gain long, contiguous contigs. To obtain all non-redundant consensus transcript sequences, these contigs in combination with the recently published EST data of leaves from D. latiflorus [64] were clustered using the TGI Clustering tool [65] to generate final transcripts for this study. The statistical characteristics of these contigs and final transcripts were shown in Table 1 and Figure S2. OrfPredictor (http://proteomics.ysu.edu/tools/OrfPredictor.html) was used to predict protein and CDS region in EST and cDNA sequences [66]. To accurately determine OGs and facilitate phylogenomic analyses, short sequences (<100 amino acids) were discarded.
Table 1. Statistical summary of contigs and final transcripts assembled by Trinity and TGICL.
| Contigs | Final Transcripts | |
| Number | 111,937 | 39,075 |
| Min length | 100 | 100 |
| Max length | 10,203 | 13,370 |
| Mean | 564 | 747 |
| Median | 339 | 523 |
| N50a | 956 | 1,192 |
| N90a | 235 | 363 |
N50 and N90 are defined as the length of the smallest contig N in the sorted list of all contigs where the cumulative length from the largest contig to contig N is at least 50% and 90% of the total length, respectively.
Orthologous Groups Identification
OrthoMCL-v2.0.2 [57] based on protein similarity graphs method was applied to detect a set of core-orthologs from all ‘primer taxa’ that consist of 8 whole-proteomes species of Poaceae, including Oryza glaberrima, O. sativa ssp. indica, O. sativa ssp. japonica, O. brachyantha, Brachypodium distachyon, Sorghum bicolor, Setaria italica, and Zea mays for the initial orthologs determination in HaMStR-v8.0 [58]. All 2822 one-to-one proteins core-orthologs selected were present in all eight primer taxa (Table S2). These 2822 one-to-one proteins core-orthologs then served as an input to generate core-ortholog database for the program HaMStR-v8.0 to search for the corresponding orthologs in D. latiflorus, P. edulis, Triticum aestivum, Hordeum vulgare, Panicum virgatum, Saccharum officinarum, Phoenix dactylifera, Musa acuminata, and Arabidopsis thaliana. In the process of constructing core-ortholog database, each group of orthologous protein sequences was aligned with MAFFT [67] using the options -maxiterate 1000 and -localpair. The resulting multiple sequence alignments, comprising all whole-proteomes species from all eight primer taxa, were then converted into a profile hidden Markov model (pHMM) with hmmbuild from the HMMER3 package [68]. To accurately determine OGs of protein for each species, HaMStR-v8.0 was performed with strict parameters (-representative, -strict, -eval_limit = 0.00001, and -rbh). Subsequently, 121, 173 and 314 one-to-one OGs were identified from all 17 angiosperm species, 14 grass species, and two bamboo species, respectively. Each corresponding orthologous group of CDS was also extracted with custom Perl scripts via ‘Gene ID’ from CDS datasets predicted by OrfPredictor.
Alignments of Protein and CDS OGs
Multiple sequence alignments were performed for each protein orthologous group using MAFFT with the parameters: -maxiterate 1000 and -localpair. PRANK [69] was used for generating multiple sequence alignments of each CDS orthologous group based on an empirical codon model. To make phylogenomic analyses more reliable prior to tree reconstruction, the poor alignment regions were trimmed by trimAl v1.4 using the parameter: -automated1 (http://trimal.cgenomics.org/) [70], and the alignments were checked manually in MEGA5 [71]. All trimmed alignments were concatenated into super-alignments with SCaFoS [72] for the phylogenomic analyses of concatenation.
Reconstruction of Phylogenomic Tree
To rebuild the species trees, we employed the concatenation (maximum parsimony, maximum likelihood, Bayesian inference, and neighbor joining) and coalescent method (Maximum Pseudo-likelihood Estimation of the Species Tree, MP-EST) [52]. For the concatenated analyses, phylogenomic trees were inferred from 17 taxa, 121 one-to-one OGs, 37,150 amino acid positions and 209,007 nucleotide positions using maximum parsimony (MP), maximum likelihood (ML), Bayesian inference (BI), and neighbor joining (NJ) methods, respectively. Nonparametric bootstrap analyses were carried out to assess the robustness of ML, MP, and NJ tree topologies (1,000 replicates in all cases). Posterior probabilities were calculated for each node of the BI trees. In addition, we also performed the coalescent-based analyses using MP-EST that implements a pseudo maximum likelihood method under the coalescent model to estimate species tree from numerous gene trees. [53]. In this process of building phylogenomic trees, A. thaliana was specified as the outgroup. ProtTest3.0 [73] and ModelTest3.7 [74] were used to select the best-fitting evolutionary model according to the Akaike information criterion [75], respectively. FigTree v.1.3.1 (http://tree.bio.ed.ac.uk/software/figtree/) was used to show the trees.
MP trees were constructed by PAUP*4.0b10 [76]. All characters were weighted equally, and gaps were treated as missing data. Heuristic searches were conducted using random-taxon-addition with branch swapping tree bisection-reconnection (TBR), saving the best tree per replicate in effect. Non-parametric bootstrap analysis was performed by 1,000 replicates with TBR branch swapping. MaxTrees was set to 100,000 and then automatically increased by 100 until the searches were completed.
ML trees were inferred with RAxML-7.2.8-ALPHA [77] using the PROTGAMMAIJTTF and GTRGAMMAI model inferred by ProtTest3.0 and ModelTest3.7 with 4 discrete rate categories, respectively. We employed rapid bootstrapping using 40 Threads (-f a, 1,000 bootstrap replicates, -T 40) for ML tree search.
BI trees were implemented in MrBayes 3.12 [78] with the best ProtTest model (Jones, Taylor and Thornton [JTT] +G+I) and the best ModelTest model (GTR+G+I), respectively. The number of discrete categories (Ngammacat setting) was used to approximate the gamma distribution at the default of 4. All analyses were initiated using random starting trees, four chains, each of a single chain of 1,000,000 generations, and sampled every 1,000 generations. The first 25% of trees from all runs were discarded as burn-in and excluded from the analysis, and the remaining trees were used to construct the majority rule consensus tree to represent posterior probabilities for each node.
NJ trees were computed by applying JTT+G and K80+G models available with 1,000 bootstrap replicates and 4 Gamma distributed in MEGA 5 [71]. Pairwise deletion was adopted for the treatment of gaps and missing data.
For the coalescent-based phylogenomic analyses, each gene tree for 121 OGs were estimated using RAxML-7.2.8-ALPHA and rooted by the outgroup (A. thaliana) based on protein and CDS sequences, respectively. Species trees were then inferred from the rooted gene trees by MP-EST-v1.2 with 1000 bootstrap replicates (http://bioinformatics.publichealth.uga.edu/SpeciesTreeAnalysis/mpest/) [20], [53].
Congruence Tests on Tree Topologies
To evaluate alternative tree topologies supported by the different datasets and methods for the phylogenomic analyses of concatenation, the approximately unbiased (AU), Shimodaira-Hasegawa (SH), and the weighted Shimodaira and Hasegawa (WSH) tests were performed for all tree topologies by CONSEL-v020 [79] with the default scaling and replicate values. The per-site log-Likelihoods values were estimated by RAxML-7.2.8-ALPHA.
Ka, Ks and Selection Analyses
For each orthologous group (OG) of CDS, the corresponding coding DNA sequences were aligned using PRANK with an empirical codon model and checked manually with MEGA5 before performing downstream analyses. The CodeML program implemented in PAML4.5 [80] was used to estimate the ratio (Ka/Ks values, ω) of the number of non-synonymous substitutions per non-synonymous site (Ka) to the number of synonymous substitutions per synonymous site (Ks), and selection analyses for each OG. To reduce false positives, uncertain aligned regions were removed by setting CodeML’s cleandata variable to 1.
To estimate Ka and Ks between pairwise sequences and identify genes likely to be subject to positive selection for 314 OGs from the tropical bamboo D. latiflorus and the temperate bamboo P. edulis, pairwise maximum likelihood analyses were performed with runmode to −2 and NSsites to 0 in PAML4.5. Generally, ω>1 and ω<1 are interpreted as indicator of positive and purifying selection, respectively. When the estimate of ω is computed across the entire gene, however, a criterion of ω>1 as evidence for positive selection is extremely stringent [81], [82]. According to previous studies, ω>1 suggests that strong positive selection has acted to change protein-coding DNA sequences, while ω between 0.5 and 1 has also proved useful for detecting genes under weak positive selection (which is only possible when comparing pairwise sequences) [83], [84], [85], [86]. The rates of non-synonymous to synonymous substitutions (ω) were plotted as a scatter plot in the range of 0–3.0.
To further investigate individual amino acid sites under positive selection, we also performed Codeml analyses with site models using runmode 0 and four models (M1a: NSsites = 1; M2a: NSsites = 2; M7: NSsites = 7; and M8: NSsites = 8) on 173 OGs from 14 species of Poaceae. The nearly neutral models, M1a and M7, assume a ω to fall into one of two classes: ω<1 (purifying selection) or ω1 = 1 (neutral selection) (model M1a) or from a beta distribution (model M7); whereas the positive selection models, M2a and M8, add an extra class of sites that allows for ω2>1 (model M2a) or ωs >1 (model M8) as evidence for positive selection to the corresponding neutral model [87]. The significance of likelihood ratio tests (LRTs, P-value <0.05) [88], [89] were examined to identify positively selected sites between models 1 and 2 and between models 7 and 8, and P-value was computed by comparing LRT (−2[logLikelihood1−logLikelihood2] to the Chi-square distribution with the degree of freedom estimated as the difference of parameters between models. When P-value was significant, the Bayes Empirical Bayes (BEB) estimates from each model [90] were then used to identify amino acid sites under positive selection. The tree of each OG used by CodeML program was constructed by RAxML-7.2.8-ALPHA.
Function Annotation
In order to characterize functional classification of each OG, we referred to the rice annotations of protein and Gene Ontology (GO) downloaded from the MSU Rice Genome Annotation Database (http://rice.plantbiology.msu.edu/, O. sativa spp. japonica). The best protein hit was identified for each OG by performing a local BLASTX search (BLAST 2.2.25) with a minimum value of E−10 against rice protein database for protein function annotation. The O. sativa spp. japonica ortholog of each OG was used to associate Gene Ontology (GO) and KEGG pathway annotation to the whole orthologous groups. KEGG pathway was assigned by the online Web application of KAAS (KEGG Automatic Annotation Server, http://www.genome.jp/tools/kaas/) [91] that provides functional pathway annotation of genes by BLAST comparisons against KEGG GENES database of O. sativa spp. japonica. The bi-directional best hit (BBH) method was employed to obtain KEGG Orthology (KO) assignments and automatically generated KEGG pathways. The plots of GO functional classifications were shown by WEGO (Web Gene Ontology Annotation Plot, http://wego.genomics.org.cn/cgi-bin/wego/index.pl) [92].
Results
Inferring and Testing Incongruence of Phylogenomic Trees
For the phylogenomic analyses of concatenation, the identical trees were inferred with strong support (almost all internal nodes receiving 100% bootstrap values and 1.00 posterior probabilities), and the BEP clade was recovered as a monophyletic group (Figure1) with three methods MP, ML and BI. Within this clade, the closer relationship between Bambusoideae and Pooideae was confirmed, and they together formed a sister group of Ehrhartoideae (Figure 1). In spite of the uncertain relationships of Zingiberales, Poales and Arecales in APG III [93], Arecales was resolved to be more closely related to Zingiberales than to Poales with high confidence in our analysis including the data of the banana genome [61].
Figure 1. Phylogenetic relationships of the BEP Clade.

Phylogenomic trees were inferred by the concatenation analyses, PAUP, RAxML and MrBayes. Species trees were also estimated by the coalescent method, MP-EST. The bootstrap values above the horizontal are based on protein, while the values below are based on nucleotide data. “*” indicates support values of posterior probabilities (PP) = 1.0 and bootstrap (BP) = 100. “#” indicates all support values of PP = 1.0 and BP = 100. Support values are shown for nodes as maximum parsimony bootstrap/maximum likelihood bootstrap/Bayesian inference posterior probability/maximum pseudo-likelihood model bootstrap. Branch lengths were estimated through protein super-matrix using Bayesian analysis, and scale bar denotes substitutions per site.
In previous studies, the phylogenetic relationships within the BEP clade based on ML and BI analyses of 43 putative orthologous cDNA sequences were inconsistent with those obtained with the NJ method [44]. Therefore, we also inferred the phylogenetic relationships of the BEP clade using NJ method. Although the sister relationship of Bambusoideae and Ehrhartoideae was suggested, the bootstrap value of the BEP clade was only 61% from the super-alignments of 37,150 amino acid positions (Figure S3). In contrast, the BEP clade regarded as a monophyletic group, and the sister relationship of Bambusoideae and Pooideae were fully resolved with strong support (all internal nodes receiving 100% bootstrap values) from the super-alignments of 209,007 nucleotide acid positions (Figure S4). So, all statistical tests (AU, WSH, and SH) were performed for the phylogenomic trees of concatenation. The alternative topology which placed Bambusoideae as the sister group of Ehrhartoideae was significantly rejected (P values <0.05, Table 2).
Table 2. Statistical confidence (P values) for alternative phylogenomic hypothesis of the BEP Clade from the concatenation analyses.
| P Values | |||||
| Data Type | Method | Hypothesis | AU | SH | WSH |
| amino acid | MP | ((BP)E) | 0.687 | 0.869 | 0.869 |
| ML | ((BP)E) | 0.101 | 0.762 | 0.760 | |
| BI | ((BP)E) | 0.474 | 0.722 | 0.716 | |
| NJ | ((BE)P) | 0.010 | 0.011 | 0.011 | |
| nucleotide | MP | ((BP)E) | 0.581 | 0.843 | 0.837 |
| ML | ((BP)E) | 0.604 | 0.507 | 0.615 | |
| BI | ((BP)E) | 0.517 | 0.547 | 0.640 | |
| NJ | ((BP)E) | 0.442 | 0.598 | 0.574 | |
For the coalescent analyses of 121 OGs in the 17 species, species trees obtained by MPE-EST-v1.2 also received high support (83%–100% bootstrap values, Figure 1), which were fully congruent with those from the concatenation analyses implemented by three phylogenetic methods, PAUP, RAxML and MrBayes.
According to the concatenated and coalescent phylogenetic analyses above, our results strongly support that the monophyly of BEP clade and the sister relationship between Bambusoideae and Pooideae, which are consistent with recent phylogenetic analyses based on cpDNA sequences [33], [34], [35], [38].
Ka, Ks and Detecting Selection
Based on 314 OGs of CDS from two bamboo species, we performed ML estimation of Ka and Ks in pairwise sequences comparisons. Of these, three OGs with strong positive selection (OG8_14182, OG8_14199 and OG8_12558) have ω>1; 21 OGs with weak positive selection have ω between 0.5 and 1; 202 OGs have ω between 0.5 and 0.1; and the remainder of the OGs has ω<0.1. The distributions of Ka and Ks were shown in Figure 2, and 24 OGs with strong and weak positive selection were also present in Tables 3 and S3.
Figure 2. Distributions of Ka and Ks in 314 D. latiflorus – P. edulis OGs.

The threshold of Ka/Ks = 0.5 was used to detect candidate genes that may have been subjected to positive selection.
Table 3. 24 OGs with evidence for strong and weak positive selection in two bamboos.
| OGs ID | D. latiflorus | P. edulis | ω | Protein Function |
| OG8_14182 | Unigene22484 | ped_9008 | 2.5442 | expressed protein |
| OG8_14199 | Unigene818 | ped_1049 | 1.2837 | expressed protein |
| OG8_12558 | Unigene8135 | ped_6068 | 1.1362 | nodal modulator 1 precursor (PM5) |
| OG8_12263 | Unigene12950 | ped_5482 | 0.9245 | SNARE associated Golgi protein |
| OG8_12252 | Unigene6857 | ped_10366 | 0.8831 | transporter family protein |
| OG8_13258 | Unigene2231 | ped_10635 | 0.7864 | ENTH domain containing protein |
| OG8_13720 | Unigene7866 | ped_11081 | 0.7650 | TCP family transcription factor |
| OG8_13530 | Unigene16621 | ped_201 | 0.7525 | SNF7 domain containing protein |
| OG8_14766 | Unigene5371 | ped_3344 | 0.7216 | expressed protein |
| OG8_12173 | Unigene16907 | ped_5672 | 0.6769 | Aminotransferase domain containing protein |
| OG8_12874 | Unigene17978 | ped_10636 | 0.6263 | cold acclimation protein WCOR413 |
| OG8_15107 | Unigene14640 | ped_9017 | 0.6055 | protein kinase |
| OG8_14741 | Unigene14419 | ped_5994 | 0.6014 | expressed protein |
| OG8_13892 | Unigene32406 | ped_1256 | 0.5802 | expressed protein |
| OG8_14278 | Unigene5954 | ped_11333 | 0.5774 | expressed protein |
| OG8_15094 | Unigene11753 | ped_9836 | 0.5754 | 40S ribosomal protein S15a |
| OG8_13355 | Unigene16515 | ped_3263 | 0.5726 | glycosyltransferase family 43 protein |
| OG8_14698 | Unigene34057 | ped_6097 | 0.5388 | RNA recognition motif containing protein |
| OG8_13653 | Unigene14322 | ped_9421 | 0.5334 | expressed protein |
| OG8_13330 | Unigene15784 | ped_6343 | 0.5333 | RNA recognition motif containing protein |
| OG8_13031 | Unigene18530 | ped_5910 | 0.5327 | ras-related protein |
| OG8_15048 | Unigene14261 | ped_1500 | 0.5207 | eukaryotic translation initiation factor |
| OG8_12853 | Unigene3778 | ped_7614 | 0.5055 | zinc finger, C3HC4 type domain containing protein |
| OG8_13856 | Unigene16340 | ped_939 | 0.5054 | expressed protein |
We also applied site models of PAML4.5 that permit the determination of positive selection acting at individual amino acid residues along the protein-coding sequences based on 173 putative OGs across 14 species in the grass family. Nine OGs with sites under positive selection were identified by ω, LRT (P Value) and BEB Value (Tables 4 and S4). Among these, three OGs (OG8_13653, OG8_12939 and OG8_13485) showed evidence under positive selection by the LRTs comparing models M1a vs M2a and M7 vs M8, and an additional six OGs (OG8_14174, OG8_14288, OG8_14337, OG8_14931, OG8_14221 and OG8_14202) were detected as positive selection by the LRTs of models M7 vs M8. For the latter cases, it is possible that model M2a was too conservative to identify positive selection [94]. The results of the two LRTs performed were shown in Table 4, and all detailed parameter estimates were presented in Table S4.
Table 4. Site Models used for detecting positively selected sites.
| OGs_ID | M1a vs M2a | M7 vs M8 | Protein Function | ||||
| LRT | P a | Sitesb | LRT | P a | Sitesb | ||
| OG8_13653 | 6.9040 | 0.0317 | 12A | 8.0162 | 0.0182 | 12A | homologous-pairing protein meu13 |
| OG8_12939 | 6.5458 | 0.0379 | 51A | 7.8069 | 0.0202 | 51A | expressed protein |
| OG8_13485 | 6.2762 | 0.0434 | 39M | 6.3493 | 0.0418 | 39M 68L | expressed protein |
| OG8_14174 | 9.9498 | 0.0069 | 48T 59E | glyoxalase family protein | |||
| OG8_14288 | 7.6284 | 0.0221 | 10E 12V 59A 63Q | gamma-glutamyl hydrolase precursor | |||
| OG8_14337 | 6.5172 | 0.0384 | 84M | OsClp8 - Putative Clp protease homologue | |||
| OG8_14931 | 7.1406 | 0.0281 | 86Q 211I | DNA-directed RNA polymerase subunit | |||
| OG8_14221 | 7.3265 | 0.0256 | 60R 87E | transcriptional regulator | |||
| OG8_14202 | 6.7371 | 0.0344 | 5S 205T 206E | L1P family of ribosomal proteins domain protein | |||
P value of LRT between models M1a vs M2a or M7 vs M8.
When P value of LRT is lower 0.05, positively selected sites (PSS) estimated by BEB (BEB Value >85%), and sites in bold have BEB Value >95%.
Functional Categories of OGs
Function classifications were investigated by BLASTX, GO and KEGG pathway analyses for all OGs. Within 314 one-to-one OGs in two bamboo species, protein function for each OG was assigned using the BLASTX best hit against rice protein database (Table S3). Of those OGs with strong (ω>1) and weak (ω between 0.5 and 1) positive selection, some important functional proteins were related to modulator, cytokinesis, cold acclimation, growth and development, and stress response, including ‘nodal modulator 1 precursor (OG8_12558)’ [95], ‘SNARE associated Golgi protein (OG8_12263)’ [96], ‘ENTH domain containing protein (OG8_13258)’ [97], ‘cold acclimation protein WCOR413 (OG8_12874)’ [98], ‘TCP family transcription factor (OG8_13720)’ [99], ‘40S ribosomal protein S15a (OG8_15094)’ [100], ‘RNA recognition motif containing protein (OG8_14698)’ [101], ‘eukaryotic translation initiation factor (OG8_15048)’ [102], [103], and ‘zinc finger, C3HC4 type domain containing protein (OG8_12853)’ [104].
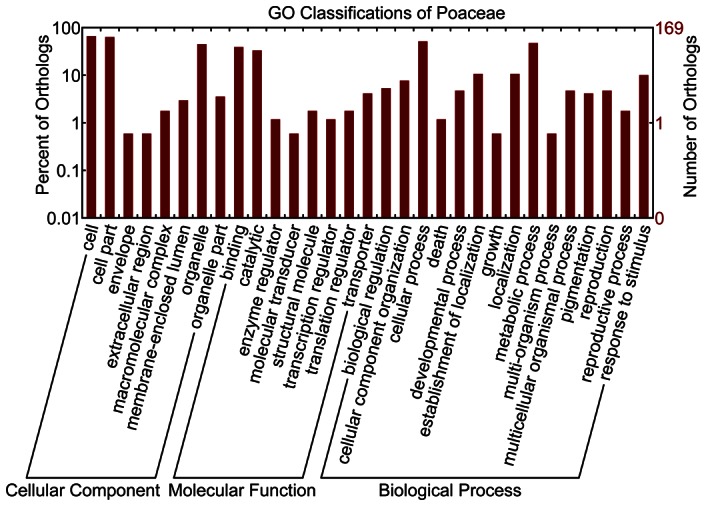
For GO annotation of 314 one-to-one OGs, there were 307 OGs classified into 82 GO terms (Figure 3, Tables S5 and S6). Among 24 strong and weak positively selected OGs, 16 OGs were mainly involved in ‘biosynthetic process’, ‘metabolic process’, ‘protein modification process’, ‘response to biotic, abiotic and stress’, and ‘signal transduction’; 11 OGs were mainly related to ‘protein binding’, ‘carbohydrate binding’, ‘lipid binding’, ‘nucleotide binding’, ‘structural molecule activity’ and ‘transferase activity’; eight OGs were mostly involved in ‘plasma membrane’, ‘endoplasmic reticulum’, ‘Golgi apparatus’, ‘plastid’, ‘cytosol’, ‘cytoplasm’ and ‘nucleus’ within biological process, molecular function and cellular component category, respectively (Table S5). To investigate biochemical pathways of these OGs, pathway analyses using KAAS (KEGG Automatic Annotation Server, http://www.genome.jp/tools/kaas/) were also carried out. Using KEGG pathway information, 81 of 314 one-to-one OGs could be associated with at least one pathway, among of which five OGs (ω>0.5) were assigned to ‘Methane metabolism’, ‘RNA degradation’, ‘Biosynthesis of secondary metabolites’, ‘Nicotinate and nicotinamide metabolism’, and ‘Histidine metabolism’ (Table S7). In 103 pathways identified, ‘Metabolic pathways’ and ‘Biosynthesis of secondary metabolites’ showed the highest number of associated OGs (Table S8).
Figure 3. GO classification for 314 orthologs of D. latiflorus – P. edulis.

Similar analyses were also implemented for 173 one-to-one OGs in the grass family. We observed that the proteins of nine OGs with amino acid sites under positive selection were mainly involved in meiosis, abiotic stresses, transcription control and important enzymes, including ‘homologous-pairing protein meu13 (OG8_13653)’ [105], ‘glyoxalase family protein (OG8_14174)’ [106], ‘gamma-glutamyl hydrolase precursor (OG8_14288)’ [107], [108], ‘OsClp8-Putative Clp protease homologue (OG8_14337)’ [109] and ‘DNA-directed RNA polymerase subunit (OG8_14931)’ [110] (Table S4).
Among the 173 one-to-one OGs, a total of 167 OGs were assigned to 75 GO terms (Figure 4, Tables S9 and S10). For biological processes, nine OGs with positively selected sites were mainly related to ‘cellular process’, ‘carbohydrate metabolic process’, ‘biosynthetic process’, and ‘translation’. As to molecular functions, ‘protein binding’, ‘hydrolase activity’, ‘transferase activity’, and ‘structural molecule activity’ were mostly represented. Regarding to cellular components, ‘cytosol’, ‘thylakoid’, ‘cytoplasm’, ‘nucleus’, ‘ribosome’, and ‘membrane’ were detected (Table S10). To further provide insights into positive selection in plant metabolism, KAAS predicted a total of 75 pathways for 48 of 173 OGs (Tables S10 and S11). For three of nine OGs under positive selection, metabolite pathways were mainly assigned to ‘Pyruvate metabolism’, ‘MAPK signaling pathway’, ‘Folate biosynthesis’, ‘Purine metabolism’, and ’RNA polymerase’ (Table S12).
Figure 4. GO classification for 173 orthologs of Poaceae.
Discussion
Incongruence of Gene Trees
In previous phylogenetic studies of the three subfamilies, various relationships were proposed based on cpDNA sequences and several nuclear gene fragments. Recent studies revealed that Bambusoideae and Pooideae were more closely related by chloroplast genome data [33], [34], [35], [38]. The inconsistent phylogenies might result from a small number of chloroplast markers which might have evolved at different rates or sampling errors [3], [4], [111]. In plants, nuclear genomes are characterized by a high rate of gene duplication and loss, which generates complex patterns of orthologs and paralogs [112], [113]. Two recent studies have separately used 18,896 gene families that had at least four sequences and sequences from at least three taxa [43], and 43 cDNA orthologs [44] to attempt to uncover the phylogenetic relationships of the three subfamilies based on nuclear genes, but their relationships still remain unresolved. It is possible that gene duplications and losses, missing data and sampling errors potentially blur the phylogenetic signal to inhibit a recovery of the phylogenies of these subfamilies [9], [114], [115], [116], [117]. In this study, the tree that has been reconstructed from the super-alignments of 37,150 amino acid positions using NJ method was incongruent with other nine trees. This incongruence may be attributed to two factors. On the one hand, incomplete genes from EST sequences in some taxa could lead to missing data [118], unless there is complete genomic sequence data for all taxa. On the other hand, there are the potentially serious weaknesses that the observed differences do not accurately reflect the true evolutionary distances between sequences, while building a phylogenetic tree by NJ method [119], [120], [121], [122], [123].
Taxon and Gene Random Sampling
Single-copy and low-copy nuclear genes have just begun to be adopted for the phylogenetic studies of plants [124], [125]. UCOs (Ultra Conserved Orthologs) [126] and APVO (Arabidopsis thaliana, Populus trichocarpa, Vitis vinifera and Oryza sativa) [127] sequences represent highly conserved subsets of single-copy genes shared in eukaryotic and plant genomes, respectively, and can be taken as a proxy for gene detection. Compared with gene sets of UCOs and APVO, these 45 and 20 gene IDs of 121 one-to-one OGs were identical with the list of 3790 UCOs specific sequence IDs (http://compgenomics.ucdavis.edu/compositae_reference.php) and 959 APVO single copy nuclear gene IDs from Arabidopsis, respectively (Table S13).
Phylogenomic datasets usually represent sets of tens to hundreds of orthologs, but large size only is not always more reliable on account of the quality and saturation of orthologs [118]. Philippe et al. thereby proposed that genes and taxa should be randomly sampled when researchers inferred phylogenetic relationships using phylogenomic datasets, especially comprising some ESTs data [118]. Therefore, to evaluate whether the phylogenetic signals of the genes or taxa sampling in different matrices have an impact on the support of the BEP clade, we randomly examined 30, 40 and 60 of 121 one-to-one OGs (Figures S5, S6, S7, S8, S9, S10), 12 of 17 taxa (Figures S11 and S12) from nucleotide and protein sequences, respectively. Again both the BEP clade and the sister relationship between Bambusoideae and Pooideae received high support (72%–100% bootstrap values) by MP, ML, BI and MP-EST, although the bootstrap values dropped in several nodes.
In this study, the phylogenetic relationships of the BEP clade were resolved using 121 one-to-one OGs in all 17 species of angiosperm, and were obtained the consistent conclusion with the ((B, P), E) chloroplast-based topology. However, we still realize that this study is based on limited data. For example, due to the scarcity of public whole-sequenced genome and transcriptome data, Ehrhartoideae was represented by only one genus, which may introduce a sampling bias. Therefore, further researches including more genera, species and orthologous nuclear genes should been deeply needed.
Genes under Positive Selection
Orthologs under positive selection contained some interesting candidate genes that were mostly related to abiotic and biotic stress response, development, reproduction, biosynthesis, metabolism, and enzyme (Tables 3, 4, S3, S4, S5, S7, S9 and S11).
The ‘OG8_12558’ orthologous gene was identified as strong positive selection in two bamboo species, and encodes ‘nodal modulator 1 precursor (PM5)’ protein (Tables 3 and S3). PM proteins play important roles in defense signal transduction during pathogen attack [128]. PM5 protein is one of PM proteins, and taken as a transmembrane nodal modulator bound with Chitooligomers or chitooligosaccharides (COS) elicitors, which is related to elicitor-mediated disease response for plant [95], [129]. Plants have evolved a sophisticated and effective system to defend against invading pathogens. Disease resistance genes of plants have also been a positive impact on the enhanced fitness by natural selection in the presence of the pathogen from an evolutionary viewpoint [130].
The ‘OG8_12874’ orthologous gene was detected to be subject to weak positive selection in two bamboos, and encodes ‘WCOR413’ protein which is one of cold acclimation proteins (Tables 3 and S3). ‘WCOR413’ gene mainly contains two distinct multispanning transmembrane proteins: COR413-PM (COR413-plasma membrane) and COR413-TM (COR413-thylakoid membrane) to stabilize the plasma membrane and thylakoid membrane, respectively [98]. In the cold acclimation process, cold-regulated (COR) genes play an important role [131]. The expression of COR gene regulates the osmotic pressure of plant cell, and stabilizes membranes against freeze-induced injury to maintain normal physiological activities of the plant. Previous studies revealed that WCOR413 gene is correlated with freezing tolerance in cereals and Arabidopsis [132]. From an evolutionary point of view, many plants fixed favorable mutations to increase freezing tolerance to enhance their ability of adaptation and survival, when encountered to low, nonfreezing temperatures [133].
The ‘OG8_15094’ orthologous gene of two bamboos was identified to be subject to weak positive selection, and encodes ‘40S ribosomal protein S15a’ (Tables 3 and S3). Ribosomal proteins (r-proteins) have a major role in controlling cell growth, division, and development [134]. A deficiency in specific r-proteins can impose deleterious effects on the development and physiology of an organism [100]. Ribosomal proteins such as 40S subunits are important components for the eukaryotic ribosome, and required for translation of particular mRNAs [135], [136]. Translation is an ancient cellular process through which cellular ribosomes manufacture proteins. Because ribosome functioning affects almost all cellular processes, high positive selection pressure is expected to act against deleterious mutations from an evolutionary perspective. In recent studies, some r-proteins under positive selection have been shown [137].
The ‘OG8_13330’ orthologous gene was subject to weak positive selection in two bamboos, and encodes ‘RNA-recognition-motif (RRM)’ protein (Tables 3 and S3). In the grass family, three OGs (‘OG8_13380’, ‘OG8_13682’, ‘OG8_14698’) with potentially positively selected sites also encode the same protein (Table S4), although P value (LRTs, likelihood ratio tests) is not lower than 0.05. The RRM protein contains two consensus RNA binding submotifs: RNP1 (octamer) and RNP2 (hexamer) [138], [139]. It has been discovered with similar function for reproduction system in some species such as yeast, human, Arabidopsis and rice [101], [138], [140], [141]. The RRM protein was one of RNA-binding modules, and associated with post-transcriptional regulation of gene expression, from RNA processing and export in the nucleus, to mRNA translation, the regulation of germ cell development and the initiation of meiotic entry [101], [142]. The initiating meiotic entry is a fundamentally process for meiosis in all sexually reproducing species, so positive selection favoring may be promoted from an evolutionary standpoint [143], [144].
The ‘OG8_13653’ orthologous gene was detected sites undergone positive selection in the grass family, and encodes ‘homologous-pairing protein Meu13’ (Tables 4 and S4) which was first discovered to be the requirement for homologous pairing and meiotic recombination in fission yeast [145]. Homologous pairing is essential for ensuring reductional segregation during meiosis I in sexually reproducing eukaryotes [146], [147]. In the process, homologous-pairing genes play key roles [105], [148]. Most people think that while meiosis certainly evolved from mitosis, strong selective pressures on these genes fostered the elimination of harmful gene mutations, and promoted beneficial ones for adaptation [143].
The ‘OG8_14174’ orthologous gene was identified two sites under positive selection in the grass family, and encodes ‘glyoxalase protein’ (Tables 4 and S4). The glyoxalase protein family consists of two enzymes glyoxalase I (EC 4.4.1.5, lactoylglutathione lyase) and glyoxalase II (EC 3.1.2.6, hydroxacylglutathione hydrolase) [149]. They play important roles in tolerate drought, soil salinity and other abiotic stresses. According to previous studies, they have been demonstrated the high adaptation to cope with climate change or environmental stress factors for the ultimate survival of plants [150], [151].
The ‘OG8_14931’ orthologous gene with two sites subjected to positive selection encodes ‘DNA-directed RNA polymerase II subunit’ protein (Tables 4 and S4), which is one of RNA polymerases [152]. RNA polymerase II which is an enzyme found in eukaryotic cells plays vital function to catalyzes the transcription of DNA to synthesize precursors of mRNA and most snRNA and microRNA [153], [154]. It is an indispensable factor to transcribe genetic information and establish transcript maturation. So, from an evolutionary viewpoint, it must maintain beneficial mutations to enhance adaptation for environmental signals [155].
Other OGs identified as under positive selection in the grass family (Tables 4, S4 and S11) was involved in important protein and biochemical function, such as folate biosynthesis pathway (OG8_14288, gamma-glutamyl hydrolase) [108], putative Clp protease homologue protein (OG8_14337, Clp8) [109], transcriptional regulator (OG8_14221) and L1P family of ribosomal proteins domain (OG8_14202) [156]. In short, signatures of positive selection indicate that these genes have important roles in adaptation of organisms to environmental changes, along with variability in protein-coding sequences [133].
Positive selection is an important source of evolutionary innovation and adaptation, so one of the major goals of our study is to identify genes to be subject to positive selection. Although several methods have been developed to detect positive selection in protein-coding DNA sequences level, it is still difficult to avoid false positive signals of positive selection completely because of sequencing and alignments errors [157], [158]. Previous studies have investigated orthologs or paralogs under positive selection within plant genomes [23], [47], [159], [160], however, this study mainly focused on orthologs in the grass family. Our study found that only 24 and nine OGs might be subject to have undergone positive selective pressure from two bamboo species and 14 grass species, respectively. A small number of positively selected genes identified in this study could be due to the limitations of the data available, in particular, EST sequences that produce many incomplete genes. Additionally, we only detected one-to-one OGs which may be single or low copy genes. Further research will be carried out to identify orthologs and paralogs for more species with whole-genome sequences in the grass family. It is worth noting that in agreement with previous studies [161] this study only found several genes under positive selection as well. We identified and annotated those positively selected genes, but other genes should also be worthy, which will offer further insights into our understanding of the evolution of the grass family.
Conclusions
Our study is the first report for the successful resolution of the relationships of the three subfamilies in the BEP clade with robust support based on phylogenomic approach using 121 one-to-one orthologous nuclear genes. The results confirm that BEP clade is a monophyletic group and Bambusoideae is sister to Pooideae rather to Ehrhartoideae, which is in consensus with recent chloroplast-based phylogenomic trees. This study also found 24 and nine orthologs with evidence of positive selection from 314 OGs and 173 OGs in two bamboos species and 14 grass species, respectively. They were mainly related to abiotic and biotic stress response, cell division, meiosis, reproduction and development, transcription control, folate biosynthesis, plant metabolism and enzymes, for instance, PM5, homologous-pairing protein Meu13, OsClp8, ribosomal proteins, gamma-glutamyl hydrolase precursor protein, and DNA-directed RNA polymerase II. These genes provide valuable insights into adaptive selection of the grass family at the sequence level and will be great candidates for future functional validation.
Supporting Information
Data flow diagram of bioinformatics pipeline.
(PDF)
Length Distributions of contigs and transcripts assembled by Trinity and TGICL.
(PDF)
Phylogenomic trees based on 121 one-to-one OGs, 37,150 amino acid positions in 17 species using NJ method. Support values are shown for nodes as NJ method. Branch lengths were estimated through NJ analysis, and scale bar denotes substitutions per site.
(PDF)
Phylogenomic trees based on 121 one-to-one OGs, 209,007 nucleotide acid positions in 17 species NJ method. Support values are shown for nodes as NJ method. Branch lengths were estimated through NJ analysis, and scale bar denotes substitutions per site.
(PDF)
Phylogenomic trees based on 30 one-to-one OGs of protein in 17 species for the concatenated and coalescent analyses. Support values are shown for nodes as maximum parsimony bootstrap/maximum likelihood bootstrap/Bayesian inference posterior probability/maximum pseudo-likelihood model bootstrap. Branch lengths were estimated through Bayesian analysis, and scale bar denotes substitutions per site.
(PDF)
Phylogenomic trees based on 40 one-to-one OGs of protein in 17 species for the concatenated and coalescent analyses. Support values are shown for nodes as maximum parsimony bootstrap/maximum likelihood bootstrap/Bayesian inference posterior probability/maximum pseudo-likelihood model bootstrap. Branch lengths were estimated through Bayesian analysis, and scale bar denotes substitutions per site.
(PDF)
Phylogenomic trees based on 60 one-to-one OGs of protein in 17 species for the concatenated and coalescent analyses. Support values are shown for nodes as maximum parsimony bootstrap/maximum likelihood bootstrap/Bayesian inference posterior probability/maximum pseudo-likelihood model bootstrap. Branch lengths were estimated through Bayesian analysis, and scale bar denotes substitutions per site.
(PDF)
Phylogenomic trees based on 30 one-to-one OGs of CDS in 17 species for the concatenated and coalescent analyses. Support values are shown for nodes as maximum parsimony bootstrap/maximum likelihood bootstrap/Bayesian inference posterior probability/maximum pseudo-likelihood model bootstrap. Branch lengths were estimated through Bayesian analysis, and scale bar denotes substitutions per site.
(PDF)
Phylogenomic trees based on 40 one-to-one OGs of CDS in 17 species for the concatenated and coalescent analyses. Support values are shown for nodes as maximum parsimony bootstrap/maximum likelihood bootstrap/Bayesian inference posterior probability/maximum pseudo-likelihood model bootstrap. Branch lengths were estimated through Bayesian analysis, and scale bar denotes substitutions per site.
(PDF)
Phylogenomic trees based on 60 one-to-one OGs of CDS in 17 species for the concatenated and coalescent analyses. Support values are shown for nodes as maximum parsimony bootstrap/maximum likelihood bootstrap/Bayesian inference posterior probability/maximum pseudo-likelihood model bootstrap. Branch lengths were estimated through Bayesian analysis, and scale bar denotes substitutions per site.
(PDF)
Phylogenomic trees of 121 one-to-one OGs of protein in 12 species for the concatenated and coalescent analyses. Support values are shown for nodes as maximum parsimony bootstrap/maximum likelihood bootstrap/Bayesian inference posterior probability/maximum pseudo-likelihood model bootstrap. Branch lengths were estimated through Bayesian analysis, and scale bar denotes substitutions per site.
(PDF)
Phylogenomic trees based on 121 one-to-one OGs of CDS in 12 species for the concatenated and coalescent analyses. Support values are shown for nodes as maximum parsimony bootstrap/maximum likelihood bootstrap/Bayesian inference posterior probability/maximum pseudo-likelihood model bootstrap. Branch lengths were estimated through Bayesian analysis, and scale bar denotes substitutions per site.
(PDF)
Overview of the species used in this study and the corresponding data sources.
(XLS)
These 2822 one-to-one core-orthologs selected by OrthoMCL in all eight primer taxa.
(TXT)
Ka, Ks and protein functional annotation in 314 D. latiflorus - P. edulis one-to-one OGs.
(XLS)
Parameter estimates of site models CODEML analyses and protein functional annotation for 173 one-to-one OGs in 14 species of Poaceae.
(XLS)
Ka, Ks and 307 OGs annotated with GO terms in two bamboo species.
(XLS)
82 GO terms for 307 OGs of two bamboo species.
(XLS)
Ka, Ks and OGs annotated with KEGG pathways for two bamboo species.
(XLS)
KEGG pathways associated to OGs for two bamboo species.
(XLS)
167 OGs annotated with GO terms for 173 one-to-one OGs in 14 species of Poaceae.
(XLS)
75 GO terms for 167 OGs of 14 species in Poaceae.
(XLS)
48 OGs and 3 positively selected OGs annotated with KEGG pathways for 173 one-to-one OGs in 14 species of Poaceae.
(XLS)
75 KEGG pathways for 48 OGs of 14 species of Poaceae.
(XLS)
45 and 20 gene IDs detected from UCOs and APVO.
(XLS)
Acknowledgments
We thank to Yu-Xiao Zhang, Xue-Mei Zhang, and Hui-Fu Zhuang of Kunming Institute of Botany, Chinese Academy of Sciences for assistance and computational supports.
Funding Statement
This project was supported by the Knowledge Innovation Project of the Chinese Academy of Sciences (KSCX2-YW-N-067); the National Natural Science Foundation of China (30990244); NSFC-Yunnan province joint foundation (U1136603); Scientific Research Foundation for the Returned Overseas Chinese Scholars, State Education Ministry and the Young Academic and Technical Leader Raising Foundation of Yunnan Province (No. 2008PY065, awarded to Z-HG). The funders had no role in study design, data collection and analysis, decision to publish, or preparation of the manuscript.
References
- 1. Soltis DE, Kuzoff RK (1995) Discordance between nuclear and chloroplast phylogenies in the Heuchera Group (Saxifragaceae). Evolution 49: 727–742. [DOI] [PubMed] [Google Scholar]
- 2. Small RL, Cronn RC, Wendel JF (2004) Use of nuclear genes for phylogeny reconstruction in plants. Aust Syst Bot 17: 145–170. [Google Scholar]
- 3. Zhang YJ, Li DZ (2011) Advances in phylogenomics based on complete chloroplast genomes. Plant Divers Resour 33 (4): 365–375. [Google Scholar]
- 4. Martin W, Deusch O, Stawski N, Grunheit N, Goremykin V (2005) Chloroplast genome phylogenetics: why we need independent approaches to plant molecular evolution. Trends Plant Sci 10: 203–209. [DOI] [PubMed] [Google Scholar]
- 5. Maddison WP (1997) Gene trees in species trees. Syst Biol 46: 523–536. [Google Scholar]
- 6. Metzker ML (2010) Sequencing technologies - the next generation. Nat Rev Genet 11: 31–46. [DOI] [PubMed] [Google Scholar]
- 7.Philippe H, Blanchette M (2007) Overview of the first phylogenomics conference. BMC Evol Biol 7. [DOI] [PMC free article] [PubMed]
- 8. Delsuc F, Brinkmann H, Philippe H (2005) Phylogenomics and the reconstruction of the tree of life. Nat Rev Genet 6: 361–375. [DOI] [PubMed] [Google Scholar]
- 9. Philippe H, Delsuc F, Brinkmann H, Lartillot N (2005) Phylogenomics. Annu Rev Ecol Evol Syst 36: 541–562. [Google Scholar]
- 10. Philippe H, Derelle R, Lopez P, Pick K, Borchiellini C, et al. (2009) Phylogenomics revives traditional views on deep animal relationships. Curr Biol 19: 706–712. [DOI] [PubMed] [Google Scholar]
- 11. Kocot KM, Cannon JT, Todt C, Citarella MR, Kohn AB, et al. (2011) Phylogenomics reveals deep molluscan relationships. Nature 477: 452–456. [DOI] [PMC free article] [PubMed] [Google Scholar]
- 12. Smith SA, Wilson NG, Goetz FE, Feehery C, Andrade SC, et al. (2011) Resolving the evolutionary relationships of molluscs with phylogenomic tools. Nature 480: 364–367. [DOI] [PubMed] [Google Scholar]
- 13. Struck TH, Paul C, Hill N, Hartmann S, Hosel C, et al. (2011) Phylogenomic analyses unravel annelid evolution. Nature 471: 95–98. [DOI] [PubMed] [Google Scholar]
- 14. Ebersberger I, de Matos Simoes R, Kupczok A, Gube M, Kothe E, et al. (2012) A consistent phylogenetic backbone for the fungi. Mol Biol Evol 29: 1319–1334. [DOI] [PMC free article] [PubMed] [Google Scholar]
- 15. Medina EM, Jones GW, Fitzpatrick DA (2011) Reconstructing the fungal tree of life using phylogenomics and a preliminary investigation of the distribution of yeast prion-like proteins in the fungal kingdom. J Mol Evol 73: 116–133. [DOI] [PubMed] [Google Scholar]
- 16.Simon S, Narechania A, Desalle R, Hadrys H (2012) Insect phylogenomics: Exploring the source of incongruence using new transcriptomic data. Genome Biol Evol. [DOI] [PMC free article] [PubMed]
- 17. Chiari Y, Cahais V, Galtier N, Delsuc F (2012) Phylogenomic analyses support the position of turtles as the sister group of birds and crocodiles (Archosauria). BMC Biol 10: 65. [DOI] [PMC free article] [PubMed] [Google Scholar]
- 18. Liu Y, Leigh JW, Brinkmann H, Cushion MT, Rodriguez-Ezpeleta N, et al. (2009) Phylogenomic analyses support the monophyly of Taphrinomycotina, including Schizosaccharomyces fission yeasts. Mol Biol Evol 26: 27–34. [DOI] [PMC free article] [PubMed] [Google Scholar]
- 19. Meusemann K, von Reumont BM, Simon S, Roeding F, Strauss S, et al. (2010) A phylogenomic approach to resolve the arthropod tree of life. Mol Biol Evol 27: 2451–2464. [DOI] [PubMed] [Google Scholar]
- 20. Song S, Liu L, Edwards SV, Wu SY (2012) Resolving conflict in eutherian mammal phylogeny using phylogenomics and the multispecies coalescent model. Proc Natl Acad Sci U S A 109: 14942–14947. [DOI] [PMC free article] [PubMed] [Google Scholar]
- 21. Chen M, Zou M, Yang L, He S (2012) Basal jawed vertebrate phylogenomics using transcriptomic data from Solexa sequencing. PLoS One 7: e36256. [DOI] [PMC free article] [PubMed] [Google Scholar]
- 22. Regier JC, Shultz JW, Zwick A, Hussey A, Ball B, et al. (2010) Arthropod relationships revealed by phylogenomic analysis of nuclear protein-coding sequences. Nature 463: 1079–1083. [DOI] [PubMed] [Google Scholar]
- 23. Lee EK, Cibrian-Jaramillo A, Kolokotronis SO, Katari MS, Stamatakis A, et al. (2011) A functional phylogenomic view of the seed plants. PLoS Genet 7: e1002411. [DOI] [PMC free article] [PubMed] [Google Scholar]
- 24. Timme RE, Bachvaroff TR, Delwiche CF (2012) Broad phylogenomic sampling and the sister lineage of land plants. PLoS One 7: e29696. [DOI] [PMC free article] [PubMed] [Google Scholar]
- 25. Straub SC, Parks M, Weitemier K, Fishbein M, Cronn RC, et al. (2012) Navigating the tip of the genomic iceberg: Next-generation sequencing for plant systematics. Am J Bot 99: 349–364. [DOI] [PubMed] [Google Scholar]
- 26. Zimmer EA, Wen J (2012) Using nuclear gene data for plant phylogenetics: progress and prospects. Mol Phylogenet Evol 65: 774–785. [DOI] [PubMed] [Google Scholar]
- 27. Soltis DE, Burleigh G, Barbazuk WB, Moore MJ, Soltis PS (2010) Advances in the use of next-generation sequence data in plant systematics and evolution. Acta Hort (ISHS) 859: 193–206. [Google Scholar]
- 28. Egan AN, Schlueter J, Spooner DM (2012) Applications of next-generation sequencing in plant biology. Am J Bot 99: 175–185. [DOI] [PubMed] [Google Scholar]
- 29. Clark LG, Zhang WP, Wendel JF (1995) A phylogeny of the grass family (Poaceae) based on ndhF sequence data. Syst Bot 20: 436–460. [Google Scholar]
- 30. Bouchenak-Khelladi Y, Salamin N, Savolainen V, Forest F, Bank M, et al. (2008) Large multi-gene phylogenetic trees of the grasses (Poaceae): progress towards complete tribal and generic level sampling. Mol Phylogenet Evol 47: 488–505. [DOI] [PubMed] [Google Scholar]
- 31. Vicentini A, Barber JC, Aliscioni AA, Giussani LM, Kellogg EA (2008) The age of the grasses and clusters of origins of C4 photosynthesis. Global Change Biol 14: 2693–2977. [Google Scholar]
- 32. GPWG (2001) Phylogeny and subfamilial classification of the grasses (Poaceae). Ann Mol Bot Gard 88: 373–457. [Google Scholar]
- 33. Wu ZQ, Ge S (2012) The phylogeny of the BEP clade in grasses revisited: evidence from the whole-genome sequences of chloroplasts. Mol Phylogenet Evol 62: 573–578. [DOI] [PubMed] [Google Scholar]
- 34. Zhang YJ, Ma PF, Li DZ (2011) High-throughput sequencing of six bamboo chloroplast genomes: phylogenetic implications for temperate woody bamboos (Poaceae: Bambusoideae). PLoS One 6: e20596. [DOI] [PMC free article] [PubMed] [Google Scholar]
- 35. GPWG II (2012) New grass phylogeny resolves deep evolutionary relationships and discovers C4 origins. New Phytol 193: 304–312. [DOI] [PubMed] [Google Scholar]
- 36. Inda LA, Segarra-Moragues JG, Muller J, Peterson PM, Catalan P (2008) Dated historical biogeography of the temperate Loliinae (Poaceae, Pooideae) grasses in the northern and southern hemispheres. Mol Phylogenet Evol 46: 932–957. [DOI] [PubMed] [Google Scholar]
- 37. Davis JI, Soreng RJ (2010) Migration of endpoints of two genes relative to boundaries between regions of the plastid genome in the grass family (Poaceae). Am J Bot 97: 874–892. [DOI] [PubMed] [Google Scholar]
- 38. Burke SV, Grennan CP, Duvall MR (2012) Plastome sequences of two New World bamboos–Arundinaria gigantea and Cryptochloa strictiflora (Poaceae)–extend phylogenomic understanding of Bambusoideae. Am J Bot 99: 1951–1961. [DOI] [PubMed] [Google Scholar]
- 39. Birky CW Jr (1995) Uniparental inheritance of mitochondrial and chloroplast genes: mechanisms and evolution. Proc Natl Acad Sci U S A 92: 11331–11338. [DOI] [PMC free article] [PubMed] [Google Scholar]
- 40. Alvarez I, Wendel JF (2003) Ribosomal ITS sequences and plant phylogenetic inference. Mol Phylogenet Evol 29: 417–434. [DOI] [PubMed] [Google Scholar]
- 41. Buckler ESt, Ippolito A, Holtsford TP (1997) The evolution of ribosomal DNA: divergent paralogues and phylogenetic implications. Genetics 145: 821–832. [DOI] [PMC free article] [PubMed] [Google Scholar]
- 42. Harris SA, Ingram R (1991) Chloroplast DNA and Biosystematics: The Effects of Intraspecific Diversity and Plastid Transmission. Taxon 40: 393–412. [Google Scholar]
- 43. Burleigh JG, Bansal MS, Eulenstein O, Hartmann S, Wehe A, et al. (2011) Genome-scale phylogenetics: inferring the plant tree of life from 18,896 gene trees. Syst Biol 60: 117–125. [DOI] [PMC free article] [PubMed] [Google Scholar]
- 44. Peng Z, Lu T, Li L, Liu X, Gao Z, et al. (2010) Genome-wide characterization of the biggest grass, bamboo, based on 10,608 putative full-length cDNA sequences. BMC Plant Biol 10: 116. [DOI] [PMC free article] [PubMed] [Google Scholar]
- 45. Kellogg EA (2001) Evolutionary history of the grasses. Plant Physiol 125: 1198–1205. [DOI] [PMC free article] [PubMed] [Google Scholar]
- 46. Sungkaew S, Stapleton CM, Salamin N, Hodkinson TR (2009) Non-monophyly of the woody bamboos (Bambuseae; Poaceae): a multi-gene region phylogenetic analysis of Bambusoideae s.s. J Plant Res 122: 95–108. [DOI] [PubMed] [Google Scholar]
- 47.Rech GE, Vargas WA, Sukno SA, Thon MR (2012) Identification of positive selection in disease response genes within members of the Poaceae. Plant Signal Behav 7. [DOI] [PMC free article] [PubMed]
- 48. Zamora A, Sun Q, Hamblin MT, Aquadro CF, Kresovich S (2009) Positively selected disease response orthologous gene sets in the cereals identified using Sorghum bicolor L. Moench expression profiles and comparative genomics. Mol Biol Evol 26: 2015–2030. [DOI] [PMC free article] [PubMed] [Google Scholar]
- 49. Christin PA, Samaritani E, Petitpierre B, Salamin N, Besnard G (2009) Evolutionary insights on C4 photosynthetic subtypes in grasses from genomics and phylogenetics. Genome Biol Evol 1: 221–230. [DOI] [PMC free article] [PubMed] [Google Scholar]
- 50. Wang X, Gowik U, Tang H, Bowers JE, Westhoff P, et al. (2009) Comparative genomic analysis of C4 photosynthetic pathway evolution in grasses. Genome Biol 10: R68. [DOI] [PMC free article] [PubMed] [Google Scholar]
- 51. Buschiazzo E, Ritland C, Bohlmann J, Ritland K (2012) Slow but not low: genomic comparisons reveal slower evolutionary rate and higher dN/dS in conifers compared to angiosperms. BMC Evol Biol 12: 8. [DOI] [PMC free article] [PubMed] [Google Scholar]
- 52. de Queiroz A, Gatesy J (2007) The supermatrix approach to systematics. Trends Ecol Evol 22: 34–41. [DOI] [PubMed] [Google Scholar]
- 53. Liu L, Yu L, Edwards SV (2010) A maximum pseudo-likelihood approach for estimating species trees under the coalescent model. BMC Evol Biol 10: 302. [DOI] [PMC free article] [PubMed] [Google Scholar]
- 54. Liu L, Yu LL, Pearl DK, Edwards SV (2009) Estimating Species Phylogenies Using Coalescence Times among Sequences. Syst Biol 58: 468–477. [DOI] [PubMed] [Google Scholar]
- 55. Degnan JH, Rosenberg NA (2009) Gene tree discordance, phylogenetic inference and the multispecies coalescent. Trends Ecol Evol 24: 332–340. [DOI] [PubMed] [Google Scholar]
- 56. Kumar V, Hallstrom BM, Janke A (2013) Coalescent-based genome analyses resolve the early branches of the euarchontoglires. PLoS One 8: e60019. [DOI] [PMC free article] [PubMed] [Google Scholar]
- 57. Chen F, Mackey AJ, Stoeckert CJ Jr, Roos DS (2006) OrthoMCL-DB: querying a comprehensive multi-species collection of ortholog groups. Nucleic Acids Res 34: D363–368. [DOI] [PMC free article] [PubMed] [Google Scholar]
- 58. Ebersberger I, Strauss S, von Haeseler A (2009) HaMStR: profile hidden markov model based search for orthologs in ESTs. BMC Evol Biol 9: 157. [DOI] [PMC free article] [PubMed] [Google Scholar]
- 59. Zhang XM, Zhao L, Larson-Rabin Z, Li DZ, Guo ZH (2012) De novo sequencing and characterization of the floral transcriptome of Dendrocalamus latiflorus (Poaceae: Bambusoideae). PLoS One 7: e42082. [DOI] [PMC free article] [PubMed] [Google Scholar]
- 60. Al-Dous EK, George B, Al-Mahmoud ME, Al-Jaber MY, Wang H, et al. (2011) De novo genome sequencing and comparative genomics of date palm (Phoenix dactylifera). Nat Biotechnol 29: 521–527. [DOI] [PubMed] [Google Scholar]
- 61. D’Hont A, Denoeud F, Aury JM, Baurens FC, Carreel F, et al. (2012) The banana (Musa acuminata) genome and the evolution of monocotyledonous plants. Nature 488: 213–217. [DOI] [PubMed] [Google Scholar]
- 62. Grabherr MG, Haas BJ, Yassour M, Levin JZ, Thompson DA, et al. (2011) Full-length transcriptome assembly from RNA-Seq data without a reference genome. Nat Biotechnol 29: 644–U130. [DOI] [PMC free article] [PubMed] [Google Scholar]
- 63. Zhao L, Zachary LR, Chen SY, Guo ZH (2012) Comparing De Novo Transcriptome Assemblers Using Illumina RNA-Seq Reads. Plant Divers Resour 34 (5): 487–501. [Google Scholar]
- 64. Gao ZM, Li CL, Peng ZH (2011) Generation and analysis of expressed sequence tags from a normalized cDNA library of young leaf from Ma bamboo (Dendrocalamus latiflorus Munro). Plant Cell Rep 30: 2045–2057. [DOI] [PubMed] [Google Scholar]
- 65. Pertea G, Huang X, Liang F, Antonescu V, Sultana R, et al. (2003) TIGR Gene Indices clustering tools (TGICL): a software system for fast clustering of large EST datasets. Bioinformatics 19: 651–652. [DOI] [PubMed] [Google Scholar]
- 66. Min XJ, Butler G, Storms R, Tsang A (2005) OrfPredictor: predicting protein-coding regions in EST-derived sequences. Nucleic Acids Res 33: W677–680. [DOI] [PMC free article] [PubMed] [Google Scholar]
- 67. Katoh K, Kuma K, Toh H, Miyata T (2005) MAFFT version 5: improvement in accuracy of multiple sequence alignment. Nucleic Acids Res 33: 511–518. [DOI] [PMC free article] [PubMed] [Google Scholar]
- 68. Eddy SR (1998) Profile hidden Markov models. Bioinformatics 14: 755–763. [DOI] [PubMed] [Google Scholar]
- 69. Loytynoja A, Goldman N (2005) An algorithm for progressive multiple alignment of sequences with insertions. Proc Natl Acad Sci U S A 102: 10557–10562. [DOI] [PMC free article] [PubMed] [Google Scholar]
- 70. Capella-Gutierrez S, Silla-Martinez JM, Gabaldon T (2009) trimAl: a tool for automated alignment trimming in large-scale phylogenetic analyses. Bioinformatics 25: 1972–1973. [DOI] [PMC free article] [PubMed] [Google Scholar]
- 71. Tamura K, Peterson D, Peterson N, Stecher G, Nei M, et al. (2011) MEGA5: Molecular Evolutionary Genetics Analysis Using Maximum Likelihood, Evolutionary Distance, and Maximum Parsimony Methods. Mol Biol Evol 28: 2731–2739. [DOI] [PMC free article] [PubMed] [Google Scholar]
- 72. Roure B, Rodriguez-Ezpeleta N, Philippe H (2007) SCaFoS: a tool for selection, concatenation and fusion of sequences for phylogenomics. BMC Evol Biol 7 Suppl 1S2. [DOI] [PMC free article] [PubMed] [Google Scholar]
- 73. Darriba D, Taboada GL, Doallo R, Posada D (2011) ProtTest 3: fast selection of best-fit models of protein evolution. Bioinformatics 27: 1164–1165. [DOI] [PMC free article] [PubMed] [Google Scholar]
- 74. Posada D, Crandall KA (1998) MODELTEST: testing the model of DNA substitution. Bioinformatics 14: 817–818. [DOI] [PubMed] [Google Scholar]
- 75. Posada D, Buckley TR (2004) Model selection and model averaging in phylogenetics: Advantages of akaike information criterion and Bayesian approaches over likelihood ratio tests. Syst Biol 53: 793–808. [DOI] [PubMed] [Google Scholar]
- 76.Swofford D (2002) PAUP*: phylogenetic analysis using parsimony (* and other methods). version 40b10 Sunderland, MA: Sinauer Associates.
- 77. Stamatakis A (2006) RAxML-VI-HPC: maximum likelihood-based phylogenetic analyses with thousands of taxa and mixed models. Bioinformatics 22: 2688–2690. [DOI] [PubMed] [Google Scholar]
- 78. Ronquist F, Huelsenbeck JP (2003) MrBayes 3: Bayesian phylogenetic inference under mixed models. Bioinformatics 19: 1572–1574. [DOI] [PubMed] [Google Scholar]
- 79. Shimodaira H, Hasegawa M (2001) CONSEL: for assessing the confidence of phylogenetic tree selection. Bioinformatics 17: 1246–1247. [DOI] [PubMed] [Google Scholar]
- 80. Yang Z (2007) PAML 4: phylogenetic analysis by maximum likelihood. Mol Biol Evol 24: 1586–1591. [DOI] [PubMed] [Google Scholar]
- 81. Swanson WJ, Clark AG, Waldrip-Dail HM, Wolfner MF, Aquadro CF (2001) Evolutionary EST analysis identifies rapidly evolving male reproductive proteins in Drosophila. Proc Natl Acad Sci U S A 98: 7375–7379. [DOI] [PMC free article] [PubMed] [Google Scholar]
- 82. Hughes AL (2007) Looking for Darwin in all the wrong places: the misguided quest for positive selection at the nucleotide sequence level. Heredity 99: 364–373. [DOI] [PubMed] [Google Scholar]
- 83. Elmer KR, Fan S, Gunter HM, Jones JC, Boekhoff S, et al. (2010) Rapid evolution and selection inferred from the transcriptomes of sympatric crater lake cichlid fishes. Mol Ecol 19 Suppl 1197–211. [DOI] [PubMed] [Google Scholar]
- 84. Swanson WJ, Wong A, Wolfner MF, Aquadro CF (2004) Evolutionary expressed sequence tag analysis of Drosophila female reproductive tracts identifies genes subjected to positive selection. Genetics 168: 1457–1465. [DOI] [PMC free article] [PubMed] [Google Scholar]
- 85. Wu GC, Joron M, Jiggins CD (2010) Signatures of selection in loci governing major colour patterns in Heliconius butterflies and related species. BMC Evol Biol 10: 368. [DOI] [PMC free article] [PubMed] [Google Scholar]
- 86. Barreto FS, Moy GW, Burton RS (2011) Interpopulation patterns of divergence and selection across the transcriptome of the copepod Tigriopus californicus. Mol Ecol 20: 560–572. [DOI] [PubMed] [Google Scholar]
- 87. Yang ZH, Swanson WJ (2002) Codon-substitution models to detect adaptive evolution that account for heterogeneous selective pressures among site classes. Mol Biol Evol 19: 49–57. [DOI] [PubMed] [Google Scholar]
- 88. Yang Z (1998) Likelihood ratio tests for detecting positive selection and application to primate lysozyme evolution. Mol Biol Evol 15: 568–573. [DOI] [PubMed] [Google Scholar]
- 89. Wong WS, Yang Z, Goldman N, Nielsen R (2004) Accuracy and power of statistical methods for detecting adaptive evolution in protein coding sequences and for identifying positively selected sites. Genetics 168: 1041–1051. [DOI] [PMC free article] [PubMed] [Google Scholar]
- 90. Yang Z, Wong WS, Nielsen R (2005) Bayes empirical bayes inference of amino acid sites under positive selection. Mol Biol Evol 22: 1107–1118. [DOI] [PubMed] [Google Scholar]
- 91. Moriya Y, Itoh M, Okuda S, Yoshizawa AC, Kanehisa M (2007) KAAS: an automatic genome annotation and pathway reconstruction server. Nucleic Acids Res 35: W182–185. [DOI] [PMC free article] [PubMed] [Google Scholar]
- 92. Ye J, Fang L, Zheng H, Zhang Y, Chen J, et al. (2006) WEGO: a web tool for plotting GO annotations. Nucleic Acids Res 34: W293–297. [DOI] [PMC free article] [PubMed] [Google Scholar]
- 93. APG III (2009) An update of the Angiosperm Phylogeny Group classification for the orders and families of flowering plants: APG III. Bot J Linn Soc 161: 105–121. [Google Scholar]
- 94. Anisimova M, Bielawski JP, Yang Z (2001) Accuracy and power of the likelihood ratio test in detecting adaptive molecular evolution. Mol Biol Evol 18: 1585–1592. [DOI] [PubMed] [Google Scholar]
- 95. Chen F, Yuan Y, Li Q, He Z (2007) Proteomic analysis of rice plasma membrane reveals proteins involved in early defense response to bacterial blight. Proteomics 7: 1529–1539. [DOI] [PubMed] [Google Scholar]
- 96. Sanderfoot A (2007) Increases in the number of SNARE genes parallels the rise of multicellularity among the green plants. Plant Physiol 144: 6–17. [DOI] [PMC free article] [PubMed] [Google Scholar]
- 97. Song K, Jang M, Kim SY, Lee G, Lee GJ, et al. (2012) An A/ENTH Domain-Containing Protein Functions as an Adaptor for Clathrin-Coated Vesicles on the Growing Cell Plate in Arabidopsis Root Cells. Plant Physiol 159: 1013–1025. [DOI] [PMC free article] [PubMed] [Google Scholar]
- 98. Breton G, Danyluk J, Charron JBF, Sarhan F (2003) Expression profiling and bioinformatic analyses of a novel stress-regulated multispanning transmembrane protein family from cereals and Arabidopsis. Plant Physiol 132: 64–74. [DOI] [PMC free article] [PubMed] [Google Scholar]
- 99. Yao X, Ma H, Wang J, Zhang DB (2007) Genome-wide comparative analysis and expression pattern of TCP gene families in Arabidopsis thaliana and Oryza sativa . J Integr Plant Biol 49: 885–897. [Google Scholar]
- 100. Horiguchi G, Molla-Morales A, Perez-Perez JM, Kojima K, Robles P, et al. (2011) Differential contributions of ribosomal protein genes to Arabidopsis thaliana leaf development. Plant J 65: 724–736. [DOI] [PubMed] [Google Scholar]
- 101.Nonomura KI, Eiguchi M, Nakano M, Takashima K, Komeda N, et al. (2011) A Novel RNA-Recognition-Motif Protein Is Required for Premeiotic G(1)/S-Phase Transition in Rice (Oryza sativa L.). PLoS Genet 7. [DOI] [PMC free article] [PubMed]
- 102. Chou WC, Huang YW, Tsay WS, Chiang TY, Huang DE, et al. (2004) Expression of genes encoding the rice translation initiation factor, eIF5A, is involved in developmental and environmental responses. Physiol Plant 121: 50–57. [DOI] [PubMed] [Google Scholar]
- 103. Kato Y, Konishi M, Shigyo M, Yoneyama T, Yanagisawa S (2010) Characterization of plant eukaryotic translation initiation factor 6 (eIF6) genes: The essential role in embryogenesis and their differential expression in Arabidopsis and rice. Biochem Biophys Res Commun 397: 673–678. [DOI] [PubMed] [Google Scholar]
- 104. Ma K, Mao JH, Li XH, Zhang QF, Lian XM (2009) Sequence and expression analysis of the C3HC4-type RING finger gene family in rice. Gene 444: 33–45. [DOI] [PubMed] [Google Scholar]
- 105. Ma H (2005) Molecular genetic analyses of microsporogenesis and microgametogenesis in flowering plants. Annu Rev Plant Biol 56: 393–434. [DOI] [PubMed] [Google Scholar]
- 106. Mustafiz A, Singh AK, Pareek A, Sopory SK, Singla-Pareek SL (2011) Genome-wide analysis of rice and Arabidopsis identifies two glyoxalase genes that are highly expressed in abiotic stresses. Funct Integr Genomics 11: 293–305. [DOI] [PubMed] [Google Scholar]
- 107. Basset GJC, Quinlivan EP, Gregory JF, Hanson AD (2005) Folate synthesis and metabolism in plants and prospects for biofortification. Crop Sci 45: 449–453. [Google Scholar]
- 108. Hanson AD, Gregory JF (2011) Folate biosynthesis, turnover, and transport in plants. Annu Rev Plant Biol 62: 105–125. [DOI] [PubMed] [Google Scholar]
- 109. Peltier JB, Ripoll DR, Friso G, Rudella A, Cai Y, et al. (2004) Clp protease complexes from photosynthetic and non-photosynthetic plastids and mitochondria of plants, their predicted three-dimensional structures, and functional implications. J Biol Chem 279: 4768–4781. [DOI] [PubMed] [Google Scholar]
- 110. Wierzbicki AT, Haag JR, Pikaard CS (2008) Noncoding transcription by RNA polymerase Pol IVb/Pol V mediates transcriptional silencing of overlapping and adjacent genes. Cell 135: 635–648. [DOI] [PMC free article] [PubMed] [Google Scholar]
- 111. Wortley AH, Rudall PJ, Harris DJ, Scotland RW (2005) How much data are needed to resolve a difficult phylogeny? case study in Lamiales. Syst Biol 54: 697–709. [DOI] [PubMed] [Google Scholar]
- 112. Adams KL, Wendel JF (2005) Polyploidy and genome evolution in plants. Curr Opin Plant Biol 8: 135–141. [DOI] [PubMed] [Google Scholar]
- 113. Jiao Y, Wickett NJ, Ayyampalayam S, Chanderbali AS, Landherr L, et al. (2011) Ancestral polyploidy in seed plants and angiosperms. Nature 473: 97–100. [DOI] [PubMed] [Google Scholar]
- 114. Soltis DE, Albert VA, Savolainen V, Hilu K, Qiu YL, et al. (2004) Genome-scale data, angiosperm relationships, and ‘ending incongruence’: a cautionary tale in phylogenetics. Trends Plant Sci 9: 477–483. [DOI] [PubMed] [Google Scholar]
- 115. Berglund-Sonnhammer AC, Steffansson P, Betts MJ, Liberles DA (2006) Optimal gene trees from sequences and species trees using a soft interpretation of parsimony. J Mol Evol 63: 240–250. [DOI] [PubMed] [Google Scholar]
- 116. Boussau B, Szollosi GJ, Duret L, Gouy M, Tannier E, et al. (2013) Genome-scale coestimation of species and gene trees. Genome Res 23: 323–330. [DOI] [PMC free article] [PubMed] [Google Scholar]
- 117. de la Torre-Barcena JE, Kolokotronis SO, Lee EK, Stevenson DW, Brenner ED, et al. (2009) The impact of outgroup choice and missing data on major seed plant phylogenetics using genome-wide EST data. PLoS One 4: e5764. [DOI] [PMC free article] [PubMed] [Google Scholar]
- 118. Philippe H, Brinkmann H, Lavrov DV, Littlewood DT, Manuel M, et al. (2011) Resolving difficult phylogenetic questions: why more sequences are not enough. PLoS Biol 9: e1000602. [DOI] [PMC free article] [PubMed] [Google Scholar]
- 119. Yang Z, Rannala B (2012) Molecular phylogenetics: principles and practice. Nat Rev Genet 13: 303–314. [DOI] [PubMed] [Google Scholar]
- 120. Holder M, Lewis PO (2003) Phylogeny estimation: traditional and Bayesian approaches. Nat Rev Genet 4: 275–284. [DOI] [PubMed] [Google Scholar]
- 121. Hall BG (2005) Comparison of the accuracies of several phylogenetic methods using protein and DNA sequences (vol 22, pg 792, 2005). Mol Biol Evol 22: 1160–1160. [DOI] [PubMed] [Google Scholar]
- 122. Leache AD, Rannala B (2011) The accuracy of species tree estimation under simulation: a comparison of methods. Syst Biol 60: 126–137. [DOI] [PubMed] [Google Scholar]
- 123. Ogdenw TH, Rosenberg MS (2006) Multiple sequence alignment accuracy and phylogenetic inference. Syst Biol 55: 314–328. [DOI] [PubMed] [Google Scholar]
- 124. Sang T (2002) Utility of low-copy nuclear gene sequences in plant phylogenetics. Crit Rev Biochem Mol Biol 37: 121–147. [DOI] [PubMed] [Google Scholar]
- 125. Zhang N, Zeng L, Shan H, Ma H (2012) Highly conserved low-copy nuclear genes as effective markers for phylogenetic analyses in angiosperms. New Phytol 195: 923–937. [DOI] [PubMed] [Google Scholar]
- 126. Alexander K, Matvienko M, Kozik I, Leeuwen Hv, Deynze AV, et al. (2008) Eukaryotic ultra conserved orthologs and estimation of gene capture In EST libraries [abstract]. Plant and Animal Genomes Conference 16: P6. [Google Scholar]
- 127. Duarte JM, Wall PK, Edger PP, Landherr LL, Ma H, et al. (2010) Identification of shared single copy nuclear genes in Arabidopsis, Populus, Vitis and Oryza and their phylogenetic utility across various taxonomic levels. BMC Evol Biol 10: 61. [DOI] [PMC free article] [PubMed] [Google Scholar]
- 128. Wang Y, Kim SG, Kim ST, Agrawal GK, Rakwal R, et al. (2011) Biotic Stress-Responsive Rice Proteome: An Overview. J Plant Biol 54: 219–226. [Google Scholar]
- 129. Alexandersson E, Saalbach G, Larsson C, Kjellbom P (2004) Arabidopsis plasma membrane proteomics identifies components of transport, signal transduction and membrane trafficking. Plant Cell Physiol 45: 1543–1556. [DOI] [PubMed] [Google Scholar]
- 130. Meyers BC, Kaushik S, Nandety RS (2005) Evolving disease resistance genes. Curr Opin Plant Biol 8: 129–134. [DOI] [PubMed] [Google Scholar]
- 131. Thomashow MF (1999) PLANT COLD ACCLIMATION: Freezing Tolerance Genes and Regulatory Mechanisms. Annu Rev Plant Physiol Plant Mol Biol 50: 571–599. [DOI] [PubMed] [Google Scholar]
- 132. Hannah MA, Heyer AG, Hincha DK (2005) A global survey of gene regulation during cold acclimation in Arabidopsis thaliana . PLoS Genet 1: e26. [DOI] [PMC free article] [PubMed] [Google Scholar]
- 133. Des Marais DL, Juenger TE (2010) Pleiotropy, plasticity, and the evolution of plant abiotic stress tolerance. Ann N Y Acad Sci 1206: 56–79. [DOI] [PubMed] [Google Scholar]
- 134. Barakat A, Szick-Miranda K, Chang IF, Guyot R, Blanc G, et al. (2001) The organization of cytoplasmic ribosomal protein genes in the Arabidopsis genome. Plant Physiol 127: 398–415. [PMC free article] [PubMed] [Google Scholar]
- 135. Carroll AJ, Heazlewood JL, Ito J, Millar AH (2008) Analysis of the Arabidopsis cytosolic ribosome proteome provides detailed insights into its components and their post-translational modification. Mol Cell Proteomics 7: 347–369. [DOI] [PubMed] [Google Scholar]
- 136. Giavalisco P, Wilson D, Kreitler T, Lehrach H, Klose J, et al. (2005) High heterogeneity within the ribosomal proteins of the Arabidopsis thaliana 80S ribosome. Plant Mol Biol 57: 577–591. [DOI] [PubMed] [Google Scholar]
- 137. Wissler L, Codoner FM, Gu J, Reusch TB, Olsen JL, et al. (2011) Back to the sea twice: identifying candidate plant genes for molecular evolution to marine life. BMC Evol Biol 11: 8. [DOI] [PMC free article] [PubMed] [Google Scholar]
- 138. Lorkovic ZJ, Barta A (2002) Genome analysis: RNA recognition motif (RRM) and K homology (KH) domain RNA-binding proteins from the flowering plant Arabidopsis thaliana . Nucleic Acids Res 30: 623–635. [DOI] [PMC free article] [PubMed] [Google Scholar]
- 139. Cassola A, Noe G, Frasch AC (2010) RNA recognition motifs involved in nuclear import of RNA-binding proteins. RNA Biol 7: 339–344. [DOI] [PubMed] [Google Scholar]
- 140. Pedrotti S, Busa R, Compagnucci C, Sette C (2012) The RNA recognition motif protein RBM11 is a novel tissue-specific splicing regulator. Nucleic Acids Res 40: 1021–1032. [DOI] [PMC free article] [PubMed] [Google Scholar]
- 141. Harigaya Y, Tanaka H, Yamanaka S, Tanaka K, Watanabe Y, et al. (2006) Selective elimination of messenger RNA prevents an incidence of untimely meiosis. Nature 442: 45–50. [DOI] [PubMed] [Google Scholar]
- 142. Clery A, Blatter M, Allain FH (2008) RNA recognition motifs: boring? Not quite. Curr Opin Struct Biol 18: 290–298. [DOI] [PubMed] [Google Scholar]
- 143. Wilkins AS, Holliday R (2009) The evolution of meiosis from mitosis. Genetics 181: 3–12. [DOI] [PMC free article] [PubMed] [Google Scholar]
- 144. Alba MM, Pages M (1998) Plant proteins containing the RNA-recognition motif. Trends Plant Sci 3: 15–21. [Google Scholar]
- 145. Nabeshima K, Kakihara Y, Hiraoka Y, Nojima H (2001) A novel meiosis-specific protein of fission yeast, Meu13p, promotes homologous pairing independently of homologous recombination. EMBO J 20: 3871–3881. [DOI] [PMC free article] [PubMed] [Google Scholar]
- 146. Tsai JH, McKee BD (2011) Homologous pairing and the role of pairing centers in meiosis. J Cell Sci 124: 1955–1963. [DOI] [PubMed] [Google Scholar]
- 147. Ohtaka A, Saito TT, Okuzaki D, Nojima H (2007) Meiosis specific coiled-coil proteins in Shizosaccharomyces pombe. Cell Div 2: 14. [DOI] [PMC free article] [PubMed] [Google Scholar]
- 148. Nonomura KL, Nakano M, Fukuda T, Eiguchi M, Miyao A, et al. (2004) The novel gene HOMOLOGOUS PAIRING ABERRATION IN RICE MEIOSIS1 of rice encodes a putative coiled-coil protein required for homologous chromosome pairing in meiosis. Plant Cell 16: 1008–1020. [DOI] [PMC free article] [PubMed] [Google Scholar]
- 149. Thornalley PJ (1990) The Glyoxalase System - New Developments Towards Functional-Characterization of a Metabolic Pathway Fundamental to Biological Life. Biochem J 269: 1–11. [DOI] [PMC free article] [PubMed] [Google Scholar]
- 150. Ahuja I, de Vos RCH, Bones AM, Hall RD (2010) Plant molecular stress responses face climate change. Trends Plant Sci 15: 664–674. [DOI] [PubMed] [Google Scholar]
- 151. Bhomkar P, Upadhyay CP, Saxena M, Muthusamy A, Prakash NS, et al. (2008) Salt stress alleviation in transgenic Vigna mungo L. Hepper (blackgram) by overexpression of the glyoxalase I gene using a novel Cestrum yellow leaf curling virus (CmYLCV) promoter. Mol Breed 22: 169–181. [Google Scholar]
- 152. Woychik NA, Young RA (1990) Rna Polymerase-Ii - Subunit Structure and Function. Trends Biochem Sci 15: 347–351. [DOI] [PubMed] [Google Scholar]
- 153. Sims RJ, Mandal SS, Reinberg D (2004) Recent highlights of RNA-polymerase-II-mediated transcription. Curr Opin Cell Biol 16: 263–271. [DOI] [PubMed] [Google Scholar]
- 154. Brookes E, Pombo A (2009) Modifications of RNA polymerase II are pivotal in regulating gene expression states. Embo Reports 10: 1213–1219. [DOI] [PMC free article] [PubMed] [Google Scholar]
- 155. Conrad TM, Frazier M, Joyce AR, Cho BK, Knight EM, et al. (2010) RNA polymerase mutants found through adaptive evolution reprogram Escherichia coli for optimal growth in minimal media. Proc Natl Acad Sci U S A 107: 20500–20505. [DOI] [PMC free article] [PubMed] [Google Scholar]
- 156. Lecompte O, Ripp R, Thierry JC, Moras D, Poch O (2002) Comparative analysis of ribosomal proteins in complete genomes: an example of reductive evolution at the domain scale. Nucleic Acids Res 30: 5382–5390. [DOI] [PMC free article] [PubMed] [Google Scholar]
- 157. Schneider A, Souvorov A, Sabath N, Landan G, Gonnet GH, et al. (2009) Estimates of positive Darwinian selection are inflated by errors in sequencing, annotation, and alignment. Genome Biol Evol 1: 114–118. [DOI] [PMC free article] [PubMed] [Google Scholar]
- 158. Jordan G, Goldman N (2012) The effects of alignment error and alignment filtering on the sitewise detection of positive selection. Mol Biol Evol 29: 1125–1139. [DOI] [PubMed] [Google Scholar]
- 159. Pentony MM, Winters P, Penfold-Brown D, Drew K, Narechania A, et al. (2012) The plant proteome folding project: structure and positive selection in plant protein families. Genome Biol Evol 4: 360–371. [DOI] [PMC free article] [PubMed] [Google Scholar]
- 160. Roth C, Liberles DA (2006) A systematic search for positive selection in higher plants (Embryophytes). BMC Plant Biol 6: 12. [DOI] [PMC free article] [PubMed] [Google Scholar]
- 161. Gossmann TI, Song BH, Windsor AJ, Mitchell-Olds T, Dixon CJ, et al. (2010) Genome wide analyses reveal little evidence for adaptive evolution in many plant species. Mol Biol Evol 27: 1822–1832. [DOI] [PMC free article] [PubMed] [Google Scholar]
Associated Data
This section collects any data citations, data availability statements, or supplementary materials included in this article.
Supplementary Materials
Data flow diagram of bioinformatics pipeline.
(PDF)
Length Distributions of contigs and transcripts assembled by Trinity and TGICL.
(PDF)
Phylogenomic trees based on 121 one-to-one OGs, 37,150 amino acid positions in 17 species using NJ method. Support values are shown for nodes as NJ method. Branch lengths were estimated through NJ analysis, and scale bar denotes substitutions per site.
(PDF)
Phylogenomic trees based on 121 one-to-one OGs, 209,007 nucleotide acid positions in 17 species NJ method. Support values are shown for nodes as NJ method. Branch lengths were estimated through NJ analysis, and scale bar denotes substitutions per site.
(PDF)
Phylogenomic trees based on 30 one-to-one OGs of protein in 17 species for the concatenated and coalescent analyses. Support values are shown for nodes as maximum parsimony bootstrap/maximum likelihood bootstrap/Bayesian inference posterior probability/maximum pseudo-likelihood model bootstrap. Branch lengths were estimated through Bayesian analysis, and scale bar denotes substitutions per site.
(PDF)
Phylogenomic trees based on 40 one-to-one OGs of protein in 17 species for the concatenated and coalescent analyses. Support values are shown for nodes as maximum parsimony bootstrap/maximum likelihood bootstrap/Bayesian inference posterior probability/maximum pseudo-likelihood model bootstrap. Branch lengths were estimated through Bayesian analysis, and scale bar denotes substitutions per site.
(PDF)
Phylogenomic trees based on 60 one-to-one OGs of protein in 17 species for the concatenated and coalescent analyses. Support values are shown for nodes as maximum parsimony bootstrap/maximum likelihood bootstrap/Bayesian inference posterior probability/maximum pseudo-likelihood model bootstrap. Branch lengths were estimated through Bayesian analysis, and scale bar denotes substitutions per site.
(PDF)
Phylogenomic trees based on 30 one-to-one OGs of CDS in 17 species for the concatenated and coalescent analyses. Support values are shown for nodes as maximum parsimony bootstrap/maximum likelihood bootstrap/Bayesian inference posterior probability/maximum pseudo-likelihood model bootstrap. Branch lengths were estimated through Bayesian analysis, and scale bar denotes substitutions per site.
(PDF)
Phylogenomic trees based on 40 one-to-one OGs of CDS in 17 species for the concatenated and coalescent analyses. Support values are shown for nodes as maximum parsimony bootstrap/maximum likelihood bootstrap/Bayesian inference posterior probability/maximum pseudo-likelihood model bootstrap. Branch lengths were estimated through Bayesian analysis, and scale bar denotes substitutions per site.
(PDF)
Phylogenomic trees based on 60 one-to-one OGs of CDS in 17 species for the concatenated and coalescent analyses. Support values are shown for nodes as maximum parsimony bootstrap/maximum likelihood bootstrap/Bayesian inference posterior probability/maximum pseudo-likelihood model bootstrap. Branch lengths were estimated through Bayesian analysis, and scale bar denotes substitutions per site.
(PDF)
Phylogenomic trees of 121 one-to-one OGs of protein in 12 species for the concatenated and coalescent analyses. Support values are shown for nodes as maximum parsimony bootstrap/maximum likelihood bootstrap/Bayesian inference posterior probability/maximum pseudo-likelihood model bootstrap. Branch lengths were estimated through Bayesian analysis, and scale bar denotes substitutions per site.
(PDF)
Phylogenomic trees based on 121 one-to-one OGs of CDS in 12 species for the concatenated and coalescent analyses. Support values are shown for nodes as maximum parsimony bootstrap/maximum likelihood bootstrap/Bayesian inference posterior probability/maximum pseudo-likelihood model bootstrap. Branch lengths were estimated through Bayesian analysis, and scale bar denotes substitutions per site.
(PDF)
Overview of the species used in this study and the corresponding data sources.
(XLS)
These 2822 one-to-one core-orthologs selected by OrthoMCL in all eight primer taxa.
(TXT)
Ka, Ks and protein functional annotation in 314 D. latiflorus - P. edulis one-to-one OGs.
(XLS)
Parameter estimates of site models CODEML analyses and protein functional annotation for 173 one-to-one OGs in 14 species of Poaceae.
(XLS)
Ka, Ks and 307 OGs annotated with GO terms in two bamboo species.
(XLS)
82 GO terms for 307 OGs of two bamboo species.
(XLS)
Ka, Ks and OGs annotated with KEGG pathways for two bamboo species.
(XLS)
KEGG pathways associated to OGs for two bamboo species.
(XLS)
167 OGs annotated with GO terms for 173 one-to-one OGs in 14 species of Poaceae.
(XLS)
75 GO terms for 167 OGs of 14 species in Poaceae.
(XLS)
48 OGs and 3 positively selected OGs annotated with KEGG pathways for 173 one-to-one OGs in 14 species of Poaceae.
(XLS)
75 KEGG pathways for 48 OGs of 14 species of Poaceae.
(XLS)
45 and 20 gene IDs detected from UCOs and APVO.
(XLS)